. 2022 Mar 7:13:832230.
doi: 10.3389/fimmu.2022.832230. eCollection 2022.

TIGIT Blockade Exerts Synergistic Effects on Microwave Ablation Against Cancer

Affiliations

TIGIT Blockade Exerts Synergistic Effects on Microwave Ablation Against Cancer

Yaping Chen et al. Front Immunol. .

Abstract

Background: Combination immunotherapy based on immune checkpoint inhibitors (ICIs) has shown great success in the treatment of many types of cancers and has become the mainstream in the comprehensive treatment of cancers. Ablation in combination with immunotherapy has achieved tremendous efficacy in some preclinical and clinical studies. To date, our team proved that ablation in combination with ICIs was a promising antitumor therapeutic strategy for the liver metastasis of colorectal cancer (CRC). Moreover, we found that the expression of T cell immunoglobulin and immunoreceptor tyrosine-based inhibitory motif domain (TIGIT) expression was up-regulated after microwave ablation (MWA), indicating that TIGIT was involved in immunosuppression, and the combination of MWA and TIGIT blockade represented a potential clinical treatment strategy.

Methods: In the present study, we examined the expression of TIGIT using a preclinical mouse model treated with MWA. Moreover, we evaluated the antitumor functions of MWA alone or in combination with TIGIT blockade by monitoring tumor growth and survival of the mice. Besides, we also detected the numbers of tumor-infiltrating lymphocytes (TILs), and effector molecules of CD8+ T cells using flow cytometry. Finally, we analyzed the single-cell RNA sequencing (scRNA-seq) data from the MWA and MWA plus anti-TIGIT groups.

Results: The expression of TIGIT in various immune cells was up-regulated after MWA, and the addition of TIGIT blockade to MWA prolonged survival and delayed tumor growth in the MC38 tumor model. Taken together, our findings showed that TIGIT blockade in combination with MWA significantly promoted the expansion and functions of CD8+ TILs and reshaped myeloid cells in the tumor microenvironment (TME) using flow cytometry and scRNA-seq analysis.

Conclusions: TIGIT blockade in combination with MWA was a novel treatment strategy for the liver metastasis of CRC, and this combination therapy could reprogram the TME toward an antitumor environment.

Keywords: TIGIT; ablation; immune checkpoint inhibitors; immunotherapy; tumor microenvironment.


Conflict of interest statement

The authors declare that the research was conducted in the absence of any commercial or financial relationships that could be construed as a potential conflict of interest.

Figures
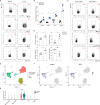
Figure 1
Figure 1
TIGIT is up-regulated in the distant tumors after MWA treatment and expressed at high levels in TILs. (A, B) A total of 1.5×10⁶ MC38 cells were inoculated subcutaneously into the left flank of C57BL/6 mice (n=4). (A) Representative flow cytometry plots of TIGIT expression in spleens and TILs of MC38 tumor-bearing mice (not subjected to MWA). (B) Quantitative percentage of TIGIT in TILs and spleens of MC38 tumor-bearing mice (not subjected to MWA). (C, D) A total of 3×10⁶ MC38 cells were subcutaneously inoculated into the bilateral flanks of C57BL/6 mice (n=4). MWA was performed on the tumor on the right flank when the tumor volume reached approximately 300 mm3. (C) Representative flow cytometry plots of TIGIT expression in TILs, including CD4+ T, CD8+ T, NK cells and CD4+ Foxp3+ Tregs on day 0 after MWA and day 10 after MWA. (D) Quantitation of the percentage of TIGIT in TILs on day 0 before MWA and day 10 of MWA. (E–G) Cluster analysis. Immune cells from vaccinated Panc02 tumor-bearing mice belonging to the control group (not subjected to RFA) and RFA group were determined by performing a UMAP dimensionality reduction analysis of scRNA-seq data and were colored according to the expression of TIGIT. Data were presented as the mean ± SEM, n=4, ns (not significant, P>0.05), * P<0.05, ** P<0.01, *** P<0.001, and **** P<0.0001 according to two-tailed unpaired Student’s t-test.
Figure 2
Figure 2
The combination of MWA and anti-TIGIT treatment synergistically inhibits the growth of distant tumors. (A–G) A total of 3×10⁶ MC38 cells were subcutaneously inoculated into the bilateral flanks of C57BL/6 mice. Mice with MC38 colon cancer mice were divided into four groups: the control group, which was treated with an isotype control antibody; the MWA group, which was treated with MWA and an isotype control antibody; the TIGIT group, which was treated with anti-TIGIT; and the MWA plus TIGIT group, which was treated with MWA and anti-TIGIT. MWA was conducted only for the tumor on the right flank when the tumor volume reached approximately 300 mm3 and the right flank tumor was cured after MWA. Anti-TIGIT mAbs (200 μg per mouse per injection) were intraperitoneally administered to the mice on day 1 after MWA, and subsequently once every 3 days for a total of four injections. The mice were considered dead when the tumor size reached 20mm in diameter or tumor ruptured. (A) The tumor size of on the left flank was measured every 2 days after MWA. (B) Kaplan-Meier survival curves were shown (n=10). (C) Frequencies of infiltrating CD45+ TILs (n=5). (D) Frequencies of infiltrating CD4+ TILs (n=5). (E) Frequencies of infiltrating CD8+ TILs (n=5). (F) Frequencies of infiltrating NK+ cells (n=5). (G) Frequencies of infiltrating Tregs (n=5). Data were presented as the mean ± SEM, ns (not significant, P>0.05), * P<0.05, ** P<0.01, *** P<0.001, and **** P<0.0001 according to the two-way ANOVA test and the log-rank test (A, B), and the one-way ANOVA test (C–G).
Figure 3
Figure 3
The combination of MWA and anti-TIGIT treatment enhances the CD8+ T responses in distant tumors. (A–D) A total of 3×10⁶ MC38 cells were subcutaneously inoculated into the bilateral flanks of C57BL/6 mice (n=4-5). The MC38 tumor-bearing mouse models were treated with MWA, anti-TIGIT antibody, and MWA plus anti-TIGIT antibody, as described in Figure 2 . (A) Representative flow cytometry plots of IFN-γ, TNF-α and GZMB expressions in CD8+ T cells. (B–D) Quantitative analysis of the percentages of IFN-γ, TNF-α and GZMB expressions in CD8+ T cells. Data were presented as the mean ± SEM, n=4-5, ns (not significant, P>0.05), * P<0.05, ** P<0.01, *** P<0.001, and **** P<0.0001 according to the one-way ANOVA test. (E, F) For the depletion of CD8+ T cells, the mice were administered 250 µg anti-CD8 antibodies starting from 1 day before MWA and subsequently every 3 days after MWA. (E) The tumor size on the left blank after MWA was measured every 2 days after MWA. (F) Kaplan–Meier survival curves were shown. Data were presented as the mean ± SEM, ns (not significant, P>0.05), * P<0.05, ** P<0.01, and *** P<0.001 according to the two-way ANOVA test and the log-rank test.
Figure 4
Figure 4
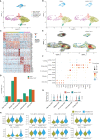
The combination of MWA and anti-TIGIT treatment reverses the exhaustion of CD8+ T cells in the TME. MC38 tumor-bearing mouse models were established and treated with MWA or MWA plus anti-TIGIT antibody, and CD45+ TILs were then purified using FACS and subjected to scRNA-seq analysis. (A) UMAP analysis showed that CD8+ TILs were classified into stem-like, interferon-induced, effector, exhausted and cycling subpopulations. (B) UMAP analysis of different subpopulations of CD8+ TILs in the MWA group or MWA plus TIGIT group. (C) Heatmap displaying marker genes expressed in different subpopulations of CD8+ TILs. (D) Percentages of different subpopulations of CD8+ TILs in the MWA group or MWA plus TIGIT group. (E) Contour map showing different subpopulations of CD8+ TILs in the MWA group or MWA plus TIGIT group. (F) Selected DEGs were identified in different sub-populations of CD8+ TILs in the two groups. (G) Violin plot showing the expression of the chemokine receptor CXCR3 in different subpopulations of CD8+ TILs in the MWA group or MWA plus TIGIT group. (H) Violin plot showing the selected pathways regulated by effector CD8+ T cells and exhausted CD8+ T cells in the MWA group or MWA plus TIGIT group.
Figure 5
Figure 5
The combination of MWA and anti-TIGIT treatment reshapes myeloid cells in the TME. MC38 tumor-bearing mouse models were established and treated with MWA and MWA plus anti-TIGIT antibodies, and then CD45+ TILs were purified using FACS and subjected to scRNA-seq analysis. (A) UMAP analysis showed that tumor-infiltrating myeloid cells were classified into neutrophils, monocytes, TAM1s, TAM2s, cycling TAMs, macrophages and DCs. (B) UMAP analysis showed the distribution of different subpopulations of myeloid cells in tumors from the MWA group or MWA plus TIGIT group. (C) Bar plot showing the percentages of different subpopulations of myeloid cells in MC38 tumors from the MWA group or MWA plus TIGIT group. (D) Dot plot showing selected chemokines in different subpopulations of myeloid cells in MC38 tumors from the MWA group or MWA plus TIGIT group. (E) Dot plot showing the ligands of TIGIT and PD-1 expressed on myeloid cells in MC38 tumors from the MWA group or MWA plus TIGIT group.
Figure 6
Figure 6
The combination of MWA and anti-TIGIT treatment alters the cell-cell communication across all immune subsets. (A, B) The cell-cell communication among immune cell populations between the MWA group and MWA plus TIGIT group. Blue represents a strong interaction among the immune cell populations of the MWA group, and red represents a strong interaction among the immune cell populations of the MWA plus TIGIT group. (A) Ring diagram. (B) Heatmap. (C, D) Heatmap showing the differences in receptor signaling pathways among immune cell populations between the MWA group and the MWA plus TIGIT group. (C) Receptor signaling pathways among immune cell populations in the MWA group. (D) Receptor signaling pathways among immune cell populations in the MWA plus TIGIT group.

Similar articles

Cited by

References

    1. Dupuy DE. Image-Guided Thermal Ablation of Lung Malignancies. Radiology (2011) 260(3):633–55. doi: 10.1148/radiol.11091126 - DOI - PubMed
    1. Chu KF, Dupuy DE. Thermal Ablation of Tumours: Biological Mechanisms and Advances in Therapy. Nat Rev Cancer (2014) 14(3):199–208. doi: 10.1038/nrc3672 - DOI - PubMed
    1. Garcia-Tejedor A, Guma A, Soler T, Valdivieso A, Petit A, Contreras N, et al. . Radiofrequency Ablation Followed by Surgical Excision Versus Lumpectomy for Early Stage Breast Cancer: A Randomized Phase II Clinical Trial. Radiology (2018) 289(2):317–24. doi: 10.1148/radiol.2018180235 - DOI - PubMed
    1. Kutlu OC, Chan JA, Aloia TA, Chun YS, Kaseb AO, Passot G, et al. . Comparative Effectiveness of First-Line Radiofrequency Ablation Versus Surgical Resection and Transplantation for Patients With Early Hepatocellular Carcinoma. Cancer (2017) 123(10):1817–27. doi: 10.1002/cncr.30531 - DOI - PubMed
    1. Heerink WJ, Ruiter SJS, Pennings JP, Lansdorp B, Vliegenthart R, Oudkerk M, et al. . Robotic Versus Freehand Needle Positioning in CT-Guided Ablation of Liver Tumors: A Randomized Controlled Trial. Radiology (2019) 290(3):826–32. doi: 10.1148/radiol.2018181698 - DOI - PubMed

Publication types

Substances