. 2022 Mar 22;12(1):4911.
doi: 10.1038/s41598-022-08900-y.

Dynamical modeling of miR-34a, miR-449a, and miR-16 reveals numerous DDR signaling pathways regulating senescence, autophagy, and apoptosis in HeLa cells

Affiliations

Dynamical modeling of miR-34a, miR-449a, and miR-16 reveals numerous DDR signaling pathways regulating senescence, autophagy, and apoptosis in HeLa cells

Shantanu Gupta et al. Sci Rep. .

Abstract

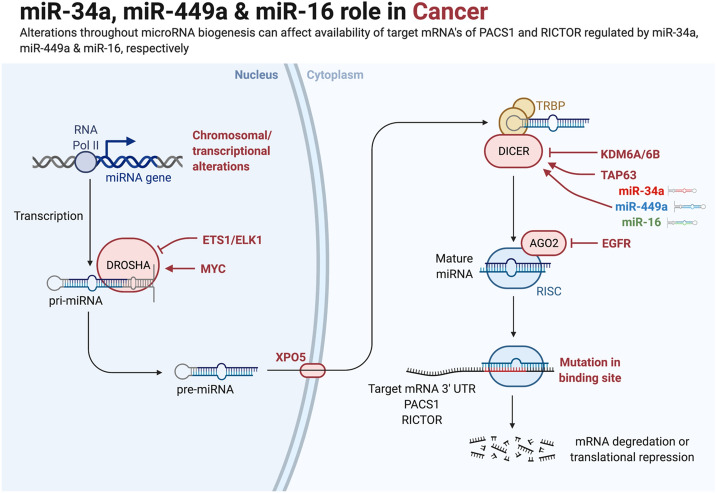
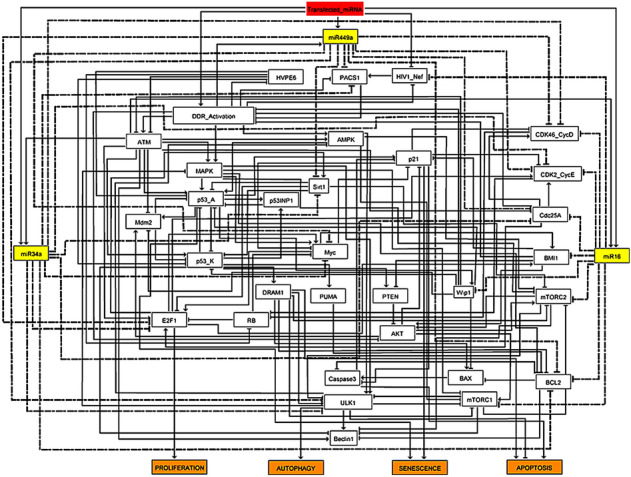
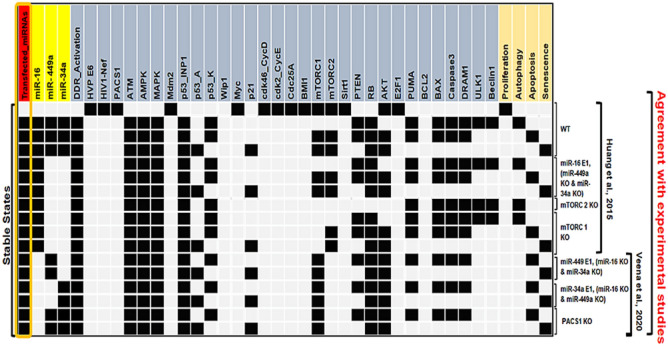
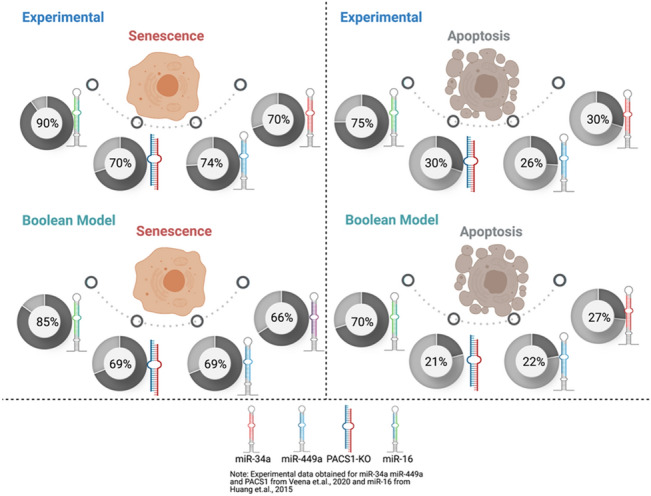
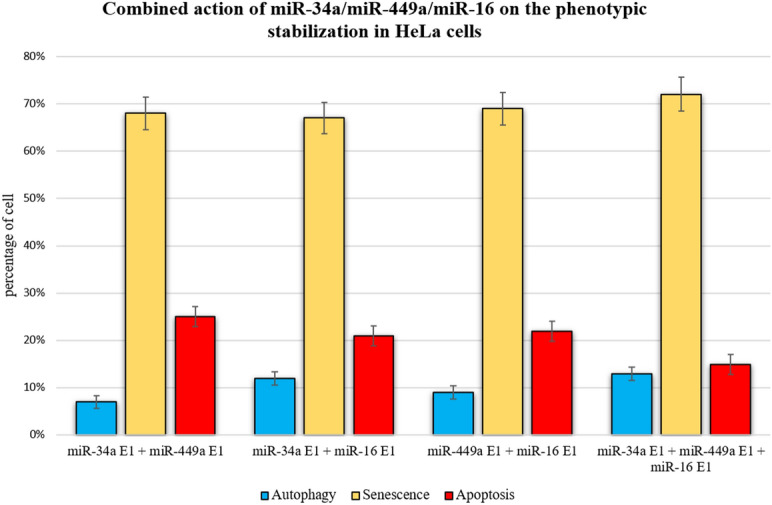
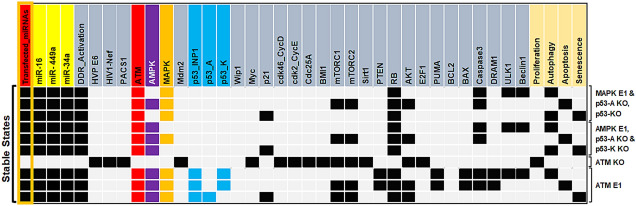
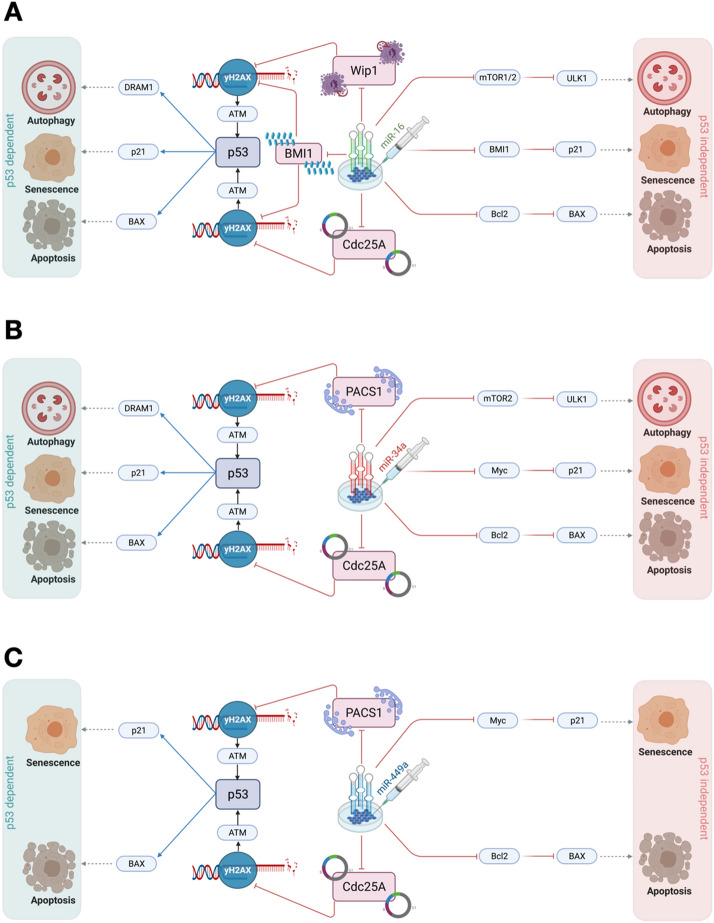
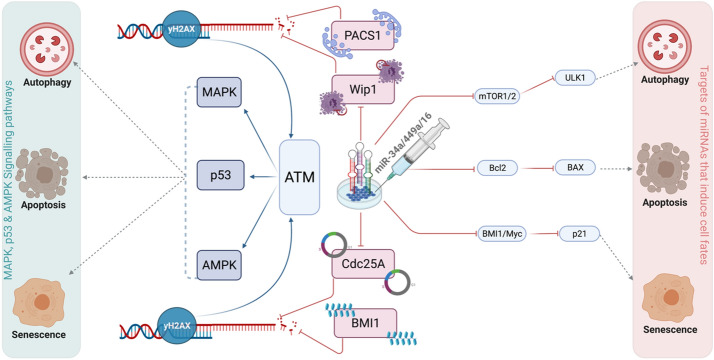
Transfection of tumor suppressor miRNAs such as miR-34a, miR-449a, and miR-16 with DNA damage can regulate apoptosis and senescence in cancer cells. miR-16 has been shown to influence autophagy in cervical cancer. However, the function of miR-34a and miR-449a in autophagy remains unknown. The functional and persistent G1/S checkpoint signaling pathways in HeLa cells via these three miRNAs, either synergistically or separately, remain a mystery. As a result, we present a synthetic Boolean network of the functional G1/S checkpoint regulation, illustrating the regulatory effects of these three miRNAs. To our knowledge, this is the first synthetic Boolean network that demonstrates the advanced role of these miRNAs in cervical cancer signaling pathways reliant on or independent of p53, such as MAPK or AMPK. We compared our estimated probability to the experimental data and found reasonable agreement. Our findings indicate that miR-34a or miR-16 may control senescence, autophagy, apoptosis, and the functional G1/S checkpoint. Additionally, miR-449a can regulate just senescence and apoptosis on an individual basis. MiR-449a can coordinate autophagy in HeLa cells in a synergistic manner with miR-16 and/or miR-34a.


Conflict of interest statement

The authors declare no competing interests.

Figures

Figure 1
Figure 1
Schematic illustration depicting the role of microRNAs (miR-34a, miR-449a, and miR-16) in Cancer. Alterations throughout miRNA biogenesis can affect the availability of target mRNA of PACS1 and RICTOR regulated by miR-34a, miR-449a, and miR-16, respectively. miRNA genes are transcribed by RNA polymerase II to produce the large primary transcripts pri-miRNAs. The pre-miRNAs are processed by another RNase III enzyme Dicer to a ~ 20–22-nucleotide miRNA/miRNA* duplex. After the duplex is unwound, the mature miRNA is incorporated into a protein complex termed RISC. A miRNA-loaded RISC mediates gene silencing via mRNA cleavage and degradation on the complementarity between the miRNA and the targeted mRNA transcript. In addition, miRNAs may function as ligands to directly bind with Toll-like receptors (TLR), triggering downstream signaling pathways. Methyltransferase-like 3 (METTL3) is recently discovered to methylate pri-miRNAs, marking them for recognition and processing by DGCR to yield mature miRNA.
Figure 2
Figure 2
Synthetic gene regulatory network for the functional G1/S checkpoint. Arrows denote activations and hammer-head arcs represent inhibitions, respectively. Dashed hammer-head arcs represent targets of miRNA-34a, miR-449a and miR-16. The yellow rectangular nodes represent miRNAs and the red one denotes transfected miRNAs which induces DNA damage response in HeLa cells. The network outputs are in orange rectangular nodes represents proliferation or autophagy or apoptosis or senescence.
Figure 3
Figure 3
The wild-type state of the synthetic network and experimental verified perturbations. WT, miR-16 E1 along with miR-449a KO and miR-34a KO, mTORC2 KO, mTORC1 KO, miR-449a E1 together with miR-16 KO and miR-34a KO, miR-34a E1 along with miR-449a KO and miR-16 KO, and at the last, PACS1 KO. E1 represents gain-of-function (GoF). Whereas, KO represents loss-of-function (LoF) perturbations corresponding to referential experiments. The left-most column shows levels of Input (Transfected_miRNAs), highlighted in orange color and the right-most column presents the model outputs: Proliferation, Autophagy, Apoptosis and Senescence. Each line represents a single stable state or fixed point corresponding to the input. White cells denote a null i.e., “inactive” value, whereas black cells denote activation means “active” (value 1), respectively.
Figure 4
Figure 4
Cross-validation through the experimental studies. Upperside: cell fate decisions such as senescence and apoptosis indicate its corresponding experimental study,. Whereas, down-side: cell fate decisions such as senescence and apoptosis signify the single node model perturbation. Each circle represents the phenotype percentage that was observed in each experimental study,. Whereas, the model perturbation for each molecule was obtained through the Monte Carlo simulations (10,000 runs). miR-34a, miR-449a, and miR-16 represent Gain-of-Function (GoF). Whereas, knockdown (KO) represents Loss-of-Function (LoF). For more detail see "Cross-validation through the experimental studies" section.
Figure 5
Figure 5
Integration of miR-34a, miR-449a, and miR-16 on the phenotypic stabilization in HeLa cells. The First synergy case between overexpression (E1) of miR-34a E1/miR-449a E1. The second synergy case between miR-34 E1/miR-16 E1 overexpression (E1). Whereas, the third case between miR-449a E1/miR-16 E1. At the last, all these miRNAs overexpressed (E1) together i.e., miR-34a E1/miR-449a E1/miR-16 E1. Each particular color bar denotes its corresponding phenotype. For each case, we have run 10.000 Monte Carlo simulations. In addition, the first three cases are compared with the last case of synergy. For more detail see "Integration of miR-34a/miR-449a/miR-16 on the phenotypic stabilization at the G1/S checkpoint" section.
Figure 6
Figure 6
The p53-independent signaling pathways. Gain of function (GoF) determines overexpression (E1) while loss of function (LoF) describes the knockout (KO) of the component corresponding to the model. The stable states were characterized for several scenarios: MAPK E1, AMPK E1 along with p53 KO, ATM KO, and ATM E1. White cells indicate a zero value, while black/red/purple/orange and blue cells indicate activation (value 1). The left-hand side highlighted in orange box presents the status of the input transfected miRNAs and the right-hand side shows the outputs of the model such as proliferation, autophagy, apoptosis, and senescence. Per line describes a single stable state or fixed point analogous to the input. The first three steady states or fixed points belong to the gain-of-function (GoF) of MAPK as well as loss-of-function (LoF) of p53 and the next three steady states describe the gain-of-function (GoF) of AMPK along with the loss-of-function (LoF) of p53: defines alternative signaling pathways in the G1/S arrest. The knockout (KO) of ATM inhibits arrest. Whereas, the gain-of-function (GoF) of ATM suppresses proliferation and induces the identified arresting phenotypes such as autophagy, apoptosis, and senescence.
Figure 7
Figure 7
Comprehensive molecular mechanisms of transfection of miRNAs on tumor growth and proliferation in HeLa cells. (A) Transfection of miR-16-induced DNA damage in cells by targeting Wip1 and Cdc25A. Once DNA damage is triggered in cells it may regulate p53-dependent or independent molecular mechanisms at the functional G1/S checkpoint. miR-16 directly targets mTOR1/2 induced autophagic cell death,. Whereas miR-16 controls the senescent phenotype by targeting BMI1, which regulates p21 expression. Whereas, miR-16 regulates apoptotic cell death by targeting Bcl2, which triggers BAX/Caspase expression. On the other hand, transfection of miR-16 regulates cell fate through the p53. miR-16 accelerated the p53 pathway and then, p53 induces autophagic cell death through DRAM1. Senescence by induction of p21 while apoptotic through induction of BAX/Caspase. (B) Transfection of miR-34-induced DNA damage in cells by targeting PACS1 and Cdc25A,. Once DNA damage is triggered in cells it may control p53-dependent or independent molecular mechanisms at the functional G1/S checkpoint. miR-34 directly targets mTOR2 induced autophagic cell death. Whereas miR-34a regulates the senescent phenotype by targeting Myc, which regulates p21 expression. Whereas, miR-34a rules apoptotic cell death by targeting Bcl2, which triggers BAX/Caspase expression. On the other hand, transfection of miR-34 coordinates cell fate through the p53. miR-34 stimulated the p53 pathway and then, p53 induces autophagic cell death through DRAM1. Senescence by induction of p21 while apoptotic through the introduction of BAX/Caspase. (C) Transfection of miR-449a-induced DNA damage in cells by targeting PACS1 and Cdc25A,. Once DNA damage is generated in cells it may control p53-dependent or independent molecular mechanisms at the functional G1/S checkpoint. miR-449a controls the senescent phenotype by targeting Myc, which modulates p21 expression. Whereas, miR-449a rules apoptotic cell death by targeting Bcl2, which triggers BAX/Caspase expression. On the other hand, transfection of miR-449a regulates cell fate through the p53. miR-449a activated the p53 pathway and then, p53 induces senescence by the activation of p21, while triggers the apoptosis by the activation of BAX/Caspase. On the right, p53-independent molecular mechanisms of cell fate decisions such as autophagy, senescence, and apoptosis. On the left, p53-dependent molecular mechanisms of cell fate determination (autophagy, senescence, and apoptosis). Red-hammer head arrows represent inhibitions, while blue arrows indicate activation, respectively.
Figure 8
Figure 8
Schematic illustration depiciting the role of three miRNAs (miR-34a, miR-449a, and miR-16) at the G1/S checkpoint which can modulate multiple DDR signaling pathways in HeLa cells.

Similar articles

Cited by

References

    1. Wang Y, Taniguchi T. MicroRNAs and DNA damage response. Cell Cycle. 2013;12:32–42. - PMC - PubMed
    1. Veena MS, Raychaudhuri S, Basak SK, Venkatesan N, Kumar P, Biswas R, Chakrabarti R, Lu J, Su T, Gallagher-Jones M, Morselli M, Fu H, Pellegrini M, Goldstein T, Aladjem MI, Rettig MB, Wilczynski SP, Shin DS, Srivatsan ES. Dysregulation of hsa-miR-34a and hsa-miR-449a leads to overexpression of PACS-1 and loss of DNA damage response (DDR) in cervical cancer. J. Biol. Chem. 2020;295:17169–17186. - PMC - PubMed
    1. Pothof J, Verkaik NS, Van Ijcken W, Wiemer EA, Ta VT, Van Der Horst GT, Jaspers NG, Van Gent DC, Hoeijmakers JH, Persengiev SP. MicroRNA-mediated gene silencing modulates the UV-induced DNA-damage response. EMBO J. 2009;28:2090–2099. - PMC - PubMed
    1. Wang H-Y, Liu Z-S, Qiu L, Guo J, Li Y-F, Zhang J, Wang T-J, Liu X-D. Knockdown of Wip1 enhances sensitivity to radiation in HeLa cells through activation of p38 MAPK. Oncol. Res. 2014;22:225–233. - PMC - PubMed
    1. Choi DW, Na W, Kabir MH, Yi E, Kwon S, Yeom J, Ahn J-W, Choi H-H, Lee Y, Seo KW, Shin MK, Park S-H, Yoo HY, Isono K-I, Koseki H, Kim S-T, Lee C, Kwon YK, Choi CY. WIP1, a homeostatic regulator of the DNA damage response, is targeted by HIPK2 for phosphorylation and degradation. Mol. Cell. 2013;51:374–385. - PubMed

Publication types