. 2022 Mar 2:13:833515.
doi: 10.3389/fimmu.2022.833515. eCollection 2022.

Celastrol Downmodulates Alpha-Synuclein-Specific T Cell Responses by Mediating Antigen Trafficking in Dendritic Cells

Affiliations

Celastrol Downmodulates Alpha-Synuclein-Specific T Cell Responses by Mediating Antigen Trafficking in Dendritic Cells

Lam Ng et al. Front Immunol. .

Erratum in

Abstract

Parkinson's Disease (PD) is a neurodegenerative disease that affects the elderly. It is associated with motor dysfunction due to the accumulation of misfolded or aggregated fibrillar alpha-synuclein (α-syn) in the mid-brain. Current treatments are mainly focused on relieving the symptoms but are accompanied by side effects and are limited in halting disease progression. Increasing evidence points to peripheral immune cells underlying disease development, especially T cells contributing to α-syn-related neuroinflammation in PD. The onset of these cells is likely mediated by dendritic cells (DCs), whose role in α-syn-specific responses remain less studied. Moreover, Traditional Chinese medicine (TCM)-derived compounds that are candidates to treat PD may alleviate DC-T cell-mediated immune responses. Therefore, our study focused on the role of DC in response to fibrillar α-syn and subsequent induction of antigen-specific T cell responses, and the effect of TCM Curcumin-analog C1 and Tripterygium wilfordii Hook F-derived Celastrol. We found that although fibrillar α-syn did not induce significant inflammatory or T cell-mediating cytokines, robust pro-inflammatory T cell responses were found by co-culturing fibrillar α-syn-pulsed DCs with α-syn-specific CD4+ T cells. Celastrol, but not C1, reduced the onset of pro-inflammatory T cell differentiation, through promoting interaction of endosomal, amphisomal, and autophagic vesicles with fibrillar α-syn, which likely lead to its degradation and less antigen peptides available for presentation and T cell recognition. In conclusion, regulating the intracellular trafficking/processing of α-syn by DCs can be a potential approach to control the progression of PD, in which Celastrol is a potential candidate to accomplish this.

Keywords: CD4+ T cell subsets; Celastrol; Parkinson’s Disease; autophagy; dendritic cell; endo-lysosomal pathway; α-synuclein.


Conflict of interest statement

The authors declare that the research was conducted in the absence of any commercial or financial relationships that could be construed as a potential conflict of interest.

Figures

Figure 1
Figure 1
Inflammatory cytokine gene expression of fibrillar α-syn-treated MoDCs. MoDCs were pre-treated with C1 (1 µM) or Celastrol (0.25 µM) for 1 h followed by treating with fibrillar α-syn (1 µg/ml) for 4 h. Relative qRT-PCR measured gene expression compared to GAPDH were calculated and were then normalized to α-syn only treatment. (A) il1b, (B) il6, (C) il23, (D) tnfa, (E) il10, and (F) tgfb1. Column graph data represents mean ± SD from 5 individual experiments. Statistical significance was calculated by one-way ANOVA and Tukey’s multiple comparisons test, *P < 0.05, **P < 0.01.
Figure 2
Figure 2
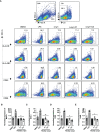
Analysis of surface expression of MHC-I/II and co-stimulatory molecules of fibrillar α-syn-treated MoDCs. MoDCs were pre-treated with C1 (1 µM) or Celastrol (0.25 µM) for 1 h followed by treatment with fibrillar α-syn (1 µg/ml) for 24 h. Surface expression of HLA-ABC, HLA-DR, CD80, and CD86 were assessed by flow cytometry. (A) Gating strategy and representative dot plots of HLA-DR (MHC-II), HLA-ABC (MHC-I), and CD80, CD86 expression from 6 individual experiments are shown. Live cells were first identified followed by gating lineage- cells representing MoDCs. Cells were further gated as HLA-DR+, HLA-ABC+, CD80+, and CD86+ cells. DMSO as the negative control and LPS as the positive control. (B–E) Column graphs showing frequencies of positive cells normalized to α-syn only treatment. Column graph data represents mean ± SD from 6 individual experiments. Statistical significance was calculated by one-way ANOVA and Tukey’s multiple comparisons test, *P < 0.05, **P < 0.01.
Figure 3
Figure 3
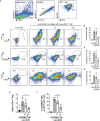
α-Syn-specific CD4+ T cell subsets stimulated by α-syn-pulsed MoDCs. α-syn specific CD4+ T cells (α-syn-CD4+ T cell) were co-cultured with MoDCs pre-treated with C1 (1 µM) or Celastrol (0.25 µM) for 1 h followed by α-syn treatment (α-syn-MoDC) and examined by flow cytometry. (A) Representative dot plots of 4 individual experiments showing frequencies of T-bet+IFN-γ+ (Th1), RORγt+IL-17A+ cells (Th17), and CD25+FoxP3+ (Treg) CD4+ T cells. α-syn-specific CD4+ T cells only served as the negative control. (B–D) Column graphs of flow cytometry results for the different subsets. (E) Ratio of Th17 to Treg in the co-culture conditions from 4 individual experiments. (F) Column graph showing percentage of RORγt expression in CD25+FoxP3+ (Treg) cells under different treatment conditions in 4 individual experiments. Column graph data represents mean ± SD from 4 individual experiments. Statistical significance was calculated by one-way ANOVA and Tukey’s multiple comparisons test, *P < 0.05, **P < 0.01.
Figure 4
Figure 4
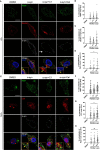
Intracellular Rab proteins colocalization with fibrillar α-syn in MoDCs. MoDCs were pre-treated with C1 (1 µM) or Celastrol (0.25 µM) for 1 h followed by treatment with fibrillar α-syn (1 µg/ml) for 15, 30 or 60 min. Rab5, Rab7, or Rab9 (green), Lamp1 (red) and α-syn (white) were immunostained for the corresponding timepoint with DAPI (blue) and observed under the confocal microscope. Representative images showing colocalization (yellow arrows) of Rab proteins with α-syn under different treatments and dot plots showing the percentage of colocalization. (A, B) Colocalization of Rab5 and α-syn at 15 min post α-syn treatment, (C, D) colocalization of Rab7 and α-syn at 30 min post α-syn treatment, (E, F) colocalization of Rab9 and α-syn at 60 min post α-syn treatment, and (G, H) colocalization of Lamp1 and α-syn at 60 min post α-syn treatment. Images are representative of 50 individual cells. Scale bar: 10 µm. Each dot in the dot plots represents data of a cell and the mean ± SD of 50 individual cells is indicated. Statistical significance was calculated by one-way ANOVA and Tukey’s multiple comparisons test, *P < 0.05, **P < 0.01, ***P < 0.001.
Figure 5
Figure 5
Colocalization of Rab proteins and autophagosome markers with fibrillar α-syn in MoDCs. MoDCs were pre-treated with C1 (1 µM) or Celastrol (0.25 µM) for 1 h followed by treatment with fibrillar α-syn (1 µg/ml) for 4 h or 16 h. Different Rab proteins (green) and autophagosome proteins (red) were immunostained for the corresponding timepoint along with α-syn (white) and DAPI (blue) and observed under the confocal microscope. (A) Representative images showing individual staining and merged images showing colocalization (yellow arrows) of Rab5 (green) and Beclin1 (red) with α-syn at 4 h post α-syn treatment. Scale bar: 10 µm. Dot plots showing the percentage of colocalization between (B) Rab5 and α-syn, (C) Beclin1 and α-syn and (D) Rab5, Beclin1 and α-syn. (E) Representative images showing individual staining and merged images showing colocalization (yellow arrows) of Rab7 (green) and LC3 (red) with α-syn at 16 h post α-syn treatment. Scale bar: 10 µm. Dot plots showing the percentage of colocalization between (F) Rab7 and α-syn, (G) LC3 and α-syn and (H) Rab7, LC3 and α-syn. Images are representative of 50 individual cells. Each dot in the dot plots represents data of a cell and the mean ± SD of 50 individual cells is indicated. Statistical significance was calculated by one-way ANOVA and Tukey’s multiple comparisons test, *P < 0.05, **P < 0.01.
Figure 6
Figure 6
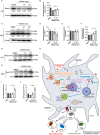
Autophagosome markers and Rab-GTP protein expression level in α-syn treated MoDCs. (A) The expression of Beclin1 in drug pre-treated MoDCs was determined by Western Blot at 4 h post α-syn treatment. Relative expressions of Beclin1 to β-actin were quantified by ImageJ and indicated on the blots, which were further normalized to α-syn only treatment shown in (B). Column graph data represents mean ± SD from 3 individual experiments. (C) The expressions of LC3-I and LC3-II in drug pre-treated MoDCs were determined by Western Blot at 16 h post α-syn treatment. Relative expressions of LC3-I or LC3-II to β-actin were quantified using ImageJ and indicated on the blots, which were further normalized to α-syn only treatment shown in (D, E). (F) The ratio of LC3-II to LC3-I in each treatment was calculated and further normalized to α-syn only treatment. Column graph data represents mean ± SD from 3 individual experiments. (G) Active Rab5-GTP (H) and Rab7-GTP were immunoprecipitated and their relative expressions towards whole cell lysate input control were quantified by ImageJ and indicated on blots, which were further normalized to α-syn only treatment shown in (I, J). Column graph data represents mean ± SD from 3 individual experiments. Statistical significance was calculated by one-way ANOVA and Tukey’s multiple comparisons test, *P < 0.05, **P < 0.01. (K) Schematic diagram of α-syn aggregates trafficking in MoDCs underlying antigen presentation and CD4+ T cell activation. Following uptake, α-syn interacts with components of three antigen trafficking and processing pathways: 1) Endo-lysosomal pathway (orange) beginning from Rab5+ early endosome (EE) to Rab7+ late endosome (LE) and to Rab9+/Lamp1+ lysosome degradation; 2) autophagic pathway (blue) starting from autophagosome formation (Beclin1+) enclosing aggregated α-syn, matured with LC3 and then to Rab9+/Lamp1+ lysosome degradation; 3) amphisomal pathway (purple) involves the fusion of Rab7+ LE from the endo-lysosomal pathway with LC3+ autophagosome from the autophagic pathway, which may also be regulated by the formation of Rab5+/Beclin1+ vesicles, and consequently fuse with Rab9+/Lamp1+ lysosomes. These three pathways could possibly allow the processing of the encapsulated α-syn by lysosomes and provide α-syn antigen peptides at different extent for MHC-II presentation to CD4+ T cells and trigger differentiation into Th1, Th17 and Treg subsets that may contribute to either neuroinflammation or neuroprotection. Celastrol promotes the colocalization of α-syn with Rab5+ EE and Rab7+ LE in the endo-lysosomal pathway, with autophagosome in the autophagic pathway, and the formation of amphisome containing α-syn in the amphisomal pathway. The increased α-syn interaction with components from degradation pathways likely favored the processing of α-syn and reduced α-syn peptides presentation to CD4+ T cell and decreased the frequencies of Th1, Th17 and Treg subsets.

Similar articles

Cited by

References

    1. Hirsch L, Jette N, Frolkis A, Steeves T, Pringsheim T. The Incidence of Parkinson’s Disease: A Systematic Review and Meta-Analysis. Neuroepidemiology (2016) 46(4):292–300. doi: 10.1159/000445751 - DOI - PubMed
    1. Michel PP, Hirsch EC, Hunot S. Understanding Dopaminergic Cell Death Pathways in Parkinson Disease. Neuron (2016) 90(4):675–91. doi: 10.1016/j.neuron.2016.03.038 - DOI - PubMed
    1. Kahle PJ, Neumann M, Ozmen L, Haass C. Physiology and Pathophysiology of Alpha-Synuclein. Cell Culture and Transgenic Animal Models Based on a Parkinson’s Disease-Associated Protein. Ann N Y Acad Sci (2000) 920:33–41. doi: 10.1111/j.1749-6632.2000.tb06902.x - DOI - PubMed
    1. Burré J, Sharma M, Tsetsenis T, Buchman V, Etherton MR, Südhof TC. Alpha-Synuclein Promotes SNARE-Complex Assembly In Vivo and In Vitro . Science (2010) 329(5999):1663–7. doi: 10.1126/science.1195227 - DOI - PMC - PubMed
    1. Ball N, Teo WP, Chandra S, Chapman J. Parkinson’s Disease and the Environment. Front Neurol (2019) 10:218. doi: 10.3389/fneur.2019.00218 - DOI - PMC - PubMed

Publication types