. 2022 Mar 17;12(1):4630.
doi: 10.1038/s41598-022-08455-y.

Argonaute 2 is lost from neuromuscular junctions affected with amyotrophic lateral sclerosis in SOD1G93A mice

Affiliations

Argonaute 2 is lost from neuromuscular junctions affected with amyotrophic lateral sclerosis in SOD1G93A mice

Dillon Shapiro et al. Sci Rep. .

Abstract

miRNAs are necessary for neuromuscular junction (NMJ) health; however, little is known about the proteins required for their activity in this regard. We examined expression of Argonaute 2 (Ago2) and miRNA biogenesis genes in skeletal muscles during development, following nerve injury and in the SOD1G93A ALS mouse model. We found that these genes are enriched in neonate muscles and in adult muscles following nerve injury. Despite widespread NMJ deterioration, these genes were not increased in muscles of SOD1G93A mice. We also found that Ago2 distribution is linked to maturation, innervation, and health of NMJs. Ago2 increasingly concentrates in synaptic regions during NMJ maturation, disperses following experimental denervation and reconcentrates at the NMJ upon reinnervation. Similar to experimentally denervated muscles, a homogenous distribution of Ago2 was observed in SOD1G93A muscle fibers. To determine if Ago2 is necessary for the health of adult muscles, we excised Ago2 from Ago2fl/fl mice using adeno-associated virus mediated Cre recombinase expression. We observed modest changes in muscle histology after 3 months of Ago2 knockdown. Together, these data provide critical insights into the role of Ago2 and miRNA biogenesis genes in healthy and ALS-afflicted skeletal muscles and NMJs.


Conflict of interest statement

The authors declare no competing interests.

Figures
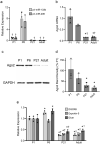
Figure 1
Figure 1
miRNA biogenesis gene expression is elevated in developing TA muscles. (a,b) qPCR analysis of pri-miRs 133b and 206 (a) and Ago2 mRNA (b) expression. (c,d) Western blot analysis of Ago2 protein levels. Images are cropped from the full-length blot, available in Fig. S5. (e) qPCR analysis of DGCR8, Exportin-5 and Dicer mRNA expression. *p < 0.05 versus P1. p < 0.05 versus P6. One-way ANOVA with Bonferroni post-hoc. All values reported as mean ± SD; n = 3.
Figure 2
Figure 2
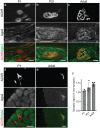
Ago2 distribution is concentrated at the NMJ in adult EDL muscle. (ac) Representative images of Ago2 IHC (green) and fBTX labeled AChRs (red) in P1 (a), P21 (b) and Adult (c) EDL. (d,e) Representative images of Ago2 IHC (green) and fBTX labeled AChRs (red) in P1 (d) and Adult (e) TA cross-sections. (f) Quantification of synaptic Ago2 pixel intensity, relative to non-synaptic Ago2 pixel intensity, in TA muscle cross sections. *p < 0.05, unpaired 2-sided t test. All values reported as mean ± SD; n = 3–4. All scale bars = 10 µm.
Figure 3
Figure 3
Ago2 expression and distribution is altered in the TA following fibular nerve crush injury. (a) qPCR analysis of Ago2 mRNA expression. (b,c) Western blot analysis of Ago2 protein levels. Images are cropped from the full-length blot, available in Fig. S6. (d,e) Representative images of Ago2 IHC in TA cross sections collected from uninjured leg (e) and at 7 days post-injury. (f) Quantification of synaptic Ago2 pixel intensity at 4, 7, and 9 days post-injury, relative to non-synaptic Ago2 pixel intensity. *p < 0.05 versus uninjured leg, One-way ANOVA with Bonferroni post-hoc (a,b) or unpaired 2-sided t test (d). All values reported as mean ± SD; n = 3. Scale bar = 10 µm.
Figure 4
Figure 4
Ago2 expression and distribution are disrupted in SOD1G93A muscle. (a) qPCR and (b) Western blot analysis of Ago2 levels in TA muscle collected from P70, P90, and P110 SOD1G93A and control littermates (N = 4). mRNA levels are relative to age-matched controls. Protein levels are normalized to total protein (Fig. S7c,f,i). Images are cropped from the full-length blot, available in Fig. S7. (c) Mean synaptic Ago2 pixel intensity in TA muscle fibers of P90 SOD1G93A and control littermates, reported as the ratio of synaptic versus non-synaptic pixel intensity within a muscle fiber (N = 3). (d,e) Representative images of Ago2 (green) distribution at fBTX-labeled NMJs (red) in TA cross sections of P90 control (d) and SOD1G93A (e) littermates. *p < 0.05, versus age-matched control, unpaired 2-sided T-test. All values reported as mean ± SD; n = 4 for all panels except C, where n = 3. Scale bar = 10 µm.
Figure 5
Figure 5
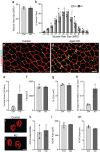
Ago2 knockdown minimally impacts skeletal muscle fiber health in young adult mice. Ago2fl/fl mice received control-eGFP or Cre AAVs to contralateral TAs at P17. (ah) Histological analysis of TAs performed at 3 months post-infection. (a) Mean muscle fiber size, assessed by measurement of minimum Feret’s diameter (MFD) of muscle fiber cross sections identified by laminin IHC. (b) Distribution of TA muscle fiber sizes. (c,d) Representative images of laminin (red) IHC of TA muscle cross sections collected from control (c) and Ago2 KD (d) legs. Arrows indicate areas of thickened interstitial space with nuclei. (e) Percentage of muscle fibers with centrally located nuclei. (f) Number of muscle fibers per TA cross section. (g) Cross-sectional area (CSA) of TA muscles. (h) Percentage of TA CSA containing thickened interstitial space. (i,j) Representative images of fBTX-labeled AChR clusters in control (i) and Ago2 KD (j) EDL muscles. (k) Number of AChR islands per NMJ. (l) Area of NMJ AChR area. (m) AChR cluster dispersion. All values reported as mean ± SD. Unpaired 2-sided t test used for all comparisons except panels (e) and (l), where unpaired 2-sided t test with Welch’s correction was used, and panel (h), where Mann–Whitney test was used. n = 3. Scale bar = 10 µm.

Similar articles

References

    1. Meister G. Argonaute proteins: Functional insights and emerging roles. Nat. Rev. Genet. 2013;14:447–459. doi: 10.1038/nrg3462. - DOI - PubMed
    1. Ha M, Kim VN. Regulation of microRNA biogenesis. Nat. Rev. Mol. Cell Biol. 2014;15:509–524. doi: 10.1038/nrm3838. - DOI - PubMed
    1. Winter J, Jung S, Keller S, Gregory RI, Diederichs S. Many roads to maturity: MicroRNA biogenesis pathways and their regulation. Nat. Cell Biol. 2009;11:228–234. doi: 10.1038/ncb0309-228. - DOI - PubMed
    1. Liu J, et al. Argonaute2 is the catalytic engine of mammalian RNAi. Science. 2004;305:1437–1441. doi: 10.1126/science.1102513. - DOI - PubMed
    1. Lessel D, et al. Germline AGO2 mutations impair RNA interference and human neurological development. Nat. Commun. 2020;11:1–14. doi: 10.1038/s41467-020-19572-5. - DOI - PMC - PubMed

Publication types