. 2022 Mar 16;18(3):e1010128.
doi: 10.1371/journal.pgen.1010128. eCollection 2022 Mar.

Cytosolic O-GlcNAcylation and PNG1 maintain Drosophila gut homeostasis by regulating proliferation and apoptosis

Affiliations

Cytosolic O-GlcNAcylation and PNG1 maintain Drosophila gut homeostasis by regulating proliferation and apoptosis

Hyun-Jin Na et al. PLoS Genet. .

Abstract

Tissue homeostasis requires a delicate balance between stem cell self-renewal, proliferation, and differentiation. Essential to this process is glycosylation, with both intra-and extra-cellular glycosylation being required for stem cell homeostasis. However, it remains unknown how intracellular glycosylation, O-GlcNAcylation, interfaces with cellular components of the extracellular glycosylation machinery, like the cytosolic N-glycanase NGLY1. In this study, we utilize the Drosophila gut and uncover a pathway in which O-GlcNAcylation cooperates with the NGLY1 homologue PNG1 to regulate proliferation in intestinal stem cells (ISCs) and apoptosis in differentiated enterocytes. Further, the CncC antioxidant signaling pathway and ENGase, an enzyme involved in the processing of free oligosaccharides in the cytosol, interact with O-GlcNAc and PNG1 through regulation of protein aggregates to contribute to gut maintenance. These findings reveal a complex coordinated regulation between O-GlcNAcylation and the cytosolic glycanase PNG1 critical to balancing proliferation and apoptosis to maintain gut homeostasis.


Conflict of interest statement

The authors have declared that no competing interests exist.

Figures
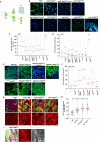
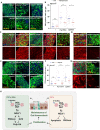
Fig 1
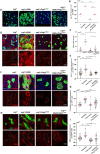
Fig 1. PNG1 regulates stem cell proliferation and is elevated in ROS-induced and OGA knockdown midgut ISCs/EBs.
(A) Model of the ISC regeneration and lineage specification process. (B) The midgut of esgts>+, esgts>Png1wt, esgts>Png1RNAi (103607), esgts>Png1C303A, esgts>Png1RNAi (BL54853), esgts>Png1EX18, esgts>sxc7, esgts>OgtRNAi, and esgts>OgaRNAi flies. (C) The number of esg-GFP-positive cells per field. (D) The number of PH3-positive cells in midguts from flies of the indicated genotype. (E) Imaging of Myo1A-GFP (green) in midgut of Myo1Ats>+, Myo1Ats>Png1wt, Myo1Ats>Png1RNAi (103607), Myo1Ats>Png1C303A, Myo1Ats>Png1RNAi (BL54853), Myo1Ats>OgtRNAi, and Myo1Ats>OgaRNAi flies. (F) The number of PH3-positive cells in midguts from flies of the indicated genotype. (G) Immunofluorescence staining of NGLY1 (red) in esg-GFP-positive cells (green) in midgut of 7-day-old esgts>+, PQ-treated esgts>+, esgts>OgaRNAi, and esgts;Ogadel.1 flies. (H) Quantification of NGLY1 mean fluorescence per esg-GFP-positive cell. (I) Immunofluorescence staining of NGLY1 (red) and O-GlcNAc (white) in esg-GFP-positive cells (green) from the midgut of esgts;Ogadel.1 flies. Outline indicates esg-positive cells. Data are represented as mean ± SD. *p< 0.05. **p< 0.01. ***p< 0.001. ****p< 0.0001. n.s., not significant., see S1 Table for N values.
Fig 2
Fig 2. PNG1 knockdown rescues dysplasia induced by hyper-O-GlcNAcylation in ISCs/EBs.
(A) After 7 days incubation at 29°C, the midgut of esgts>OgaRNAi, esgts>Png1C303A, and esgts>OgaRNAi+Png1C303A flies. (B) The number of esg-GFP-positive cells per field. (C) The number of PH3-positive cells in midguts from flies of the indicated genotype. (D) Immunofluorescence staining of NGLY1 (red) in esg-GFP-positive cells (green) in midgut of flies from the indicated genotype. (E) Quantification of NGLY1 mean fluorescence from the indicated genotype. (F) Immunofluorescence staining of O-GlcNAc (red) in esg-GFP-positive cells (green) in midgut of flies from the indicated genotype. (G) Quantification of O-GlcNAc mean fluorescence from the indicated genotype. (H) DHE staining (red) in midgut of flies. (I) Quantification of DHE mean fluorescence per esg-GFP-positive cell from the indicated genotype. Outline indicates esg-positive cells. Data are represented as mean ± SD. *p< 0.05. ****p< 0.0001., see S1 Table for N values.
Fig 3
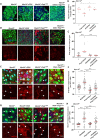
Fig 3. Regulation of PNG1 and OGT levels in ISCs/EBs.
(A) Immunofluorescence staining of MYC-Ogt (red) in midgut of esgts>Myc-Ogt, esgts>Png1RNAi, and esgts>Myc-Ogt+Png1RNAi flies using an anti-Myc tag antibody. (B) Quantification of MYC mean fluorescence per esg-GFP-positive cell. p values were calculated by one-way ANOVA with correction for multiple comparisons. (C) Immunofluorescence staining of NGLY1 (red) in esg-GFP-positive cells (green) in midgut of esgts and esgts>OgtRNAi flies. (D) Quantification of NGLY1 mean fluorescence per esg-GFP-positive cell from the indicated genotype. Outline indicate esg-positive cell. Data are represented as mean ± SD. ***p< 0.001. ****p< 0.0001., see S1 Table for N values.
Fig 4
Fig 4. Knockdown of OGA in ECs rescues gut dysfunction in PNG1 knockdown flies.
(A) After 5 days incubation at 29°C, the midgut of Myo1Ats>OgaRNAi, Myo1Ats>Png1C303A, and Myo1Ats>OgaRNAi+Png1C303A flies. (B) The number of Myo1A-GFP-positive cells per field. (C) The number of PH3-positive cells in midguts from flies of the indicated genotype. (D) Immunofluorescence staining of cCaspase (red) in Myo1A-GFP-positive cells (green) in midgut of Myo1Ats>OgaRNAi, Myo1Ats>Png1C303A, and Myo1Ats>OgaRNAi+Png1C303A flies. (E) Immunofluorescence staining of O-GlcNAc (red) in midgut of flies from the indicated genotypes. (F) Quantification of O-GlcNAc mean fluorescence per Myo1A-GFP-positive cell. (G) Immunofluorescence staining of NGLY1 (red) in midgut of flies from the indicated genotypes. (H) Quantification of NGLY1 mean fluorescence per Myo1A-GFP-positive cell from the indicated genotypes. White arrows indicate Myo1A-positive cell. Data are represented as mean ± SD. ****p< 0.0001., see S1 Table for N values.
Fig 5
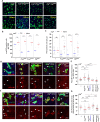
Fig 5. Consequences of OGT or PNG1 loss in ISCs/EBs can be rescued by modulating CncC activities.
(A) The midgut of transgene without or with Oltipraz 100 uM treatment for 7 days. (B) The number of esg-GFP-positive cells per field. (C) The number of PH3-positive cells in midguts from the indicated genotype and treatment. (D) Immunofluorescence staining of poly-UB (red) in esg-GFP-positive cells (green) in midgut of flies from the indicated genotype. (E) Quantification of poly-UB mean fluorescence. (F) Immunofluorescence staining of 26S Proteasome (red) in esg-GFP-positive cells (green) in midgut of flies from the indicated genotype. (G) Quantification of 26S Proteasome mean fluorescence. White arrows indicate esg-positive cell. Outline indicates esg-positive cell. Data are represented as mean ± SD. *p< 0.05. ****p< 0.0001. n.s., not significant., see S1 Table for N values.
Fig 6
Fig 6. Loss of OGT or PNG1 in ISCs/EBs can be rescued by modulating ENGase activities.
(A) Immunofluorescence staining of ENGase (red) in esg-GFP-positive cells (green) in midgut of flies with or without Rabeprazole 1 mM treatment for 7 days. (B) Quantification of ENGase mean fluorescence per esg-GFP-positive cell from the indicated genotype and treatment. (C) Immunofluorescence staining of esg-GFP (green) in midgut of transgene without or with Rabeprazole 1 mM treatment for 7 days. (D) The number of esg-GFP-positive cells per field. (E) The number of PH3-positive cells in midguts from the indicated genotype and treatment. (F) The midgut of esgts>ENGaseRNAi, esgts>Png1C303A, and esgts>ENGaseRNAi + Png1C303A flies. (G) The number of PH3-positive cells in midguts from the indicated genotype. (H) Immunofluorescence staining of ENGase (red) in esg-GFP-positive cells (green) in midgut of flies from the indicated genotype. (I) Quantification of ENGase mean fluorescence from the indicated genotypes. (J) Immunofluorescence staining of NGLY1 (red) in esg-GFP-positive cells (green) in midgut of flies from the indicated genotype. (K) Quantification of NGLY1 mean fluorescence. (L) Immunofluorescence staining of Poly-UB (red) in esg-GFP-positive cells (green) in midgut of flies from the indicated genotype. (M) Quantification of Poly-UB mean fluorescence. Outline indicates esg-positive cell. Data are represented as mean ± SD. *p< 0.05. ****p< 0.0001. n.s., not significant., see S1 Table for N values.
Fig 7
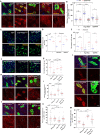
Fig 7. Modulating CncC or ENGase activity rescues EC-specific OGT or PNG1 knockdown phenotypes.
(A) The midgut of transgene without or with Rabeprazole 1 mM treatment for 5 days. (B) The number of PH3-positive cells in midguts from the indicated genotype and treatment group. (C) Immunofluorescence staining of ENGase (red) in Myo1A-GFP-positive cells (green) in midgut of flies of the indicated genotype with or without Rabeprazole. (D) Immunofluorescence staining of cCaspase (red) in Myo1A-GFP-positive cells (green) in midgut of flies from the indicated genotype with or without Rabeprazole. (E) Immunofluorescence staining of Myo1A-GFP (green) in midgut of transgene without or with Oltipraz 100 uM treatment for 5 days. (F) The number of PH3-positive cells in midguts from flies of the indicated genotpe and treatment. (G) Immunofluorescence staining of cCaspase (red) in Myo1A-GFP-positive cells (green) in midgut of flies from the indicated genotype with or without Oltipraz. (H) O-GlcNAc and PNG1 cooperate to influence intestinal homeostasis in Drosophila which can be modulated by Nrf2 and ENGase activity. Data are represented as mean ± SD. *p< 0.05. ***p< 0.001. ****p< 0.0001. n.s., not significant., see S1 Table for N values.

Similar articles

Cited by

References

    1. Chiaradonna F, Ricciardiello F, Palorini R. The Nutrient-Sensing Hexosamine Biosynthetic Pathway as the Hub of Cancer Metabolic Rewiring. Cells. 2018;7(6). Epub 2018/06/06. doi: 10.3390/cells7060053 ; PubMed Central PMCID: PMC6025041. - DOI - PMC - PubMed
    1. Carvalho-Cruz P, Alisson-Silva F, Todeschini AR, Dias WB. Cellular glycosylation senses metabolic changes and modulates cell plasticity during epithelial to mesenchymal transition. Dev Dyn. 2018;247(3):481–91. Epub 2017/07/20. doi: 10.1002/dvdy.24553 . - DOI - PubMed
    1. Pham LV, Bryant JL, Mendez R, Chen J, Tamayo AT, Xu-Monette ZY, et al.. Targeting the hexosamine biosynthetic pathway and O-linked N-acetylglucosamine cycling for therapeutic and imaging capabilities in diffuse large B-cell lymphoma. Oncotarget. 2016;7(49):80599–611. Epub 2016/10/08. doi: 10.18632/oncotarget.12413 ; PubMed Central PMCID: PMC5348344. - DOI - PMC - PubMed
    1. Barkeer S, Chugh S, Batra SK, Ponnusamy MP. Glycosylation of Cancer Stem Cells: Function in Stemness, Tumorigenesis, and Metastasis. Neoplasia. 2018;20(8):813–25. Epub 2018/07/18. doi: 10.1016/j.neo.2018.06.001 ; PubMed Central PMCID: PMC6037882. - DOI - PMC - PubMed
    1. Jang H, Kim TW, Yoon S, Choi SY, Kang TW, Kim SY, et al.. O-GlcNAc regulates pluripotency and reprogramming by directly acting on core components of the pluripotency network. Cell Stem Cell. 2012;11(1):62–74. Epub 2012/05/23. doi: 10.1016/j.stem.2012.03.001 . - DOI - PubMed

Publication types

LinkOut - more resources