Identification of lncRNAs based on different patterns of immune infiltration in gastric cancer
- PMID: 35284124
- PMCID: PMC8899746
- DOI: 10.21037/jgo-21-833
Identification of lncRNAs based on different patterns of immune infiltration in gastric cancer
Abstract
Background: Gastric cancer is one of the most common malignant tumors in the world, which brings great challenges to people's life and health. The purpose of this study was to investigate immune related-lncRNAs and identify new biomarkers for the prognosis of gastric cancer (GC).
Methods: We downloaded data from The Cancer Genome Atlas (TCGA) and used R software to determine the ESTIMATEScore, ImmuneScore, and StromalScore of each tumor sample. We performed prognostic analysis and identified the differentially expressed lnRNAs, which were then used to construct a prognostic model. Among the 44 hub genes in the competitive endogenous RNA (ceRNA) network, 3 differentially expressed genes were verified by qPCR.
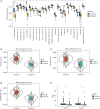
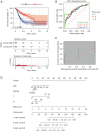
Results: Based on the degree of immune infiltration, cluster A had a higher ESTIMATEScore, ImmuneScore, and StromalScore and higher expression levels of PD-L1 (CD274) and CTLA4 than cluster B. Univariate Cox analysis was conducted for these differential lncRNAs, and 57 lncRNAs were found to have prognostic value (P<0.05). gene cluster A had a worse prognosis than gene cluster B (P=0.021). Then, a prognostic model was constructed. The low-risk group had a significantly higher survival rate. Finally, the qPCR results showed that the expression levels of BMPER, PRUNE2, and RBPMS2 were low in GC cell lines.
Conclusions: We identified a risk score of 19 lncRNAs as a prognostic marker of GC. There was a relationship between these 19 prognostic-related lncRNAs and the subtypes of infiltrating immune cells. An approach for predicting the prognosis of GC was therefore provided in this study.
Keywords: Gastric cancer (GC); The Cancer Genome Atlas (TCGA); immune infiltration.
2022 Journal of Gastrointestinal Oncology. All rights reserved.
Conflict of interest statement
Conflicts of Interest: All authors have completed the ICMJE uniform disclosure form (available at https://jgo.amegroups.com/article/view/10.21037/jgo-21-833/coif). The authors have no conflicts of interest to declare.
Figures


Similar articles
-
Comprehensive Analysis and Prognosis Prediction of N6-Methyladenosine-Related lncRNAs in Immune Microenvironment Infiltration of Gastric Cancer.Int J Gen Med. 2022 Mar 8;15:2629-2643. doi: 10.2147/IJGM.S349399. eCollection 2022. Int J Gen Med. 2022. PMID: 35300127 Free PMC article.
-
Identification of functional lncRNAs in gastric cancer by integrative analysis of GEO and TCGA data.J Cell Biochem. 2019 Oct;120(10):17898-17911. doi: 10.1002/jcb.29058. Epub 2019 May 28. J Cell Biochem. 2019. PMID: 31135068
-
CX3CR1 Acts as a Protective Biomarker in the Tumor Microenvironment of Colorectal Cancer.Front Immunol. 2022 Jan 24;12:758040. doi: 10.3389/fimmu.2021.758040. eCollection 2021. Front Immunol. 2022. PMID: 35140706 Free PMC article.
-
Comprehensive Analysis of lncRNAs Associated with the Pathogenesis and Prognosis of Gastric Cancer.DNA Cell Biol. 2020 Feb;39(2):299-309. doi: 10.1089/dna.2019.5161. Epub 2020 Jan 14. DNA Cell Biol. 2020. PMID: 31934786
-
The value of metabolic LncRNAs in predicting prognosis and immunotherapy efficacy of gastric cancer.Front Oncol. 2023 Jan 4;12:1019909. doi: 10.3389/fonc.2022.1019909. eCollection 2022. Front Oncol. 2023. PMID: 36686809 Free PMC article.
Cited by
-
Establishment and Analysis of an Artificial Neural Network Model for Early Detection of Polycystic Ovary Syndrome Using Machine Learning Techniques.J Inflamm Res. 2023 Nov 29;16:5667-5676. doi: 10.2147/JIR.S438838. eCollection 2023. J Inflamm Res. 2023. PMID: 38050562 Free PMC article.
-
Causal relationship between circulating immune cells and gastric cancer: a bidirectional Mendelian randomization analysis using UK Biobank and FinnGen datasets.Transl Cancer Res. 2024 Sep 30;13(9):4702-4713. doi: 10.21037/tcr-24-480. Epub 2024 Sep 5. Transl Cancer Res. 2024. PMID: 39430856 Free PMC article.
References
LinkOut - more resources
Full Text Sources
Research Materials
Miscellaneous
