. 2022 Feb 23:13:852571.
doi: 10.3389/fmicb.2022.852571. eCollection 2022.

The Verticillium dahliae Spt-Ada-Gcn5 Acetyltransferase Complex Subunit Ada1 Is Essential for Conidia and Microsclerotia Production and Contributes to Virulence

Affiliations

The Verticillium dahliae Spt-Ada-Gcn5 Acetyltransferase Complex Subunit Ada1 Is Essential for Conidia and Microsclerotia Production and Contributes to Virulence

Qi Geng et al. Front Microbiol. .

Abstract

Verticillium dahliae is a destructive soil-borne pathogen of many economically important dicots. The genetics of pathogenesis in V. dahliae has been extensively studied. Spt-Ada-Gcn5 acetyltransferase complex (SAGA) is an ATP-independent multifunctional chromatin remodeling complex that contributes to diverse transcriptional regulatory functions. As members of the core module in the SAGA complex in Saccharomyces cerevisiae, Ada1, together with Spt7 and Spt20, play an important role in maintaining the integrity of the complex. In this study, we identified homologs of the SAGA complex in V. dahliae and found that deletion of the Ada1 subunit (VdAda1) causes severe defects in the formation of conidia and microsclerotia, and in melanin biosynthesis and virulence. The effect of VdAda1 on histone acetylation in V. dahliae was confirmed by western blot analysis. The deletion of VdAda1 resulted in genome-wide alteration of the V. dahliae transcriptome, including genes encoding transcription factors and secreted proteins, suggesting its prominent role in the regulation of transcription and virulence. Overall, we demonstrated that VdAda1, a member of the SAGA complex, modulates multiple physiological processes by regulating global gene expression that impinge on virulence and survival in V. dahliae.

Keywords: Ada1 subunit; SAGA complex; Verticillium dahliae; melanin biosynthesis; transcriptional regulatory function; virulence.


Conflict of interest statement

The authors declare that the research was conducted in the absence of any commercial or financial relationships that could be construed as a potential conflict of interest.

Figures

FIGURE 1
FIGURE 1
Identification of the SAGA complex and Ada1 subunit in Verticillium dahliae. (A) Subunit and domain organization of the SAGA complex in V. dahliae. SAGA subunits are organized into the Tra1 lobe and the main lobe. The main lobe is divided into enzymatic HAT and DUB modules and a core module. The dotted circle near Spt3 and Spt8 indicates the TBP-binding site, where TBP is recruited. The numbers behind each subunit represent the number of amino acids. Figure design adapted from Cheon et al. (2020) and Papai et al. (2020) (B) Expression pattern analysis of VdAda1. The level of VdAda1 transcription was detected by reverse transcription-quantitative PCR during colonization on cotton at 0, 0.5, 1, 2, 3, 5, and 7 days post-inoculation (dpi). The expression level of VdAda1 at 0 dpi was set to 1.
FIGURE 2
FIGURE 2
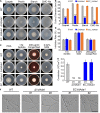
VdAda1 in Verticillium dahliae is necessary for conidia production and normal growth rate, but not for cell wall integrity and osmotic stress responses. (A) Colony morphology of the wild type strain, ΔVdAda1, and EC_VdAda1 strains on Czapek medium containing different four carbon sources. (B) Colony diameter (mm) of each strain grown on different medium. Values shown are the average of three colony diameters. Error bars represent the standard deviation calculated from three replicate experiments, and a triple asterisk indicates significant differences (P < 0.001) in colony diameter of ΔVdAda1 compared with the wild type using one-way analysis of variance (ANOVA). (C) Colony appearances of the wild type, ΔVdAda1, and EC_VdAda1 strains cultured on Czapek medium containing 1 M sorbitol, 200 μg/ml Congo red, and 0.02% SDS at 25°C for 7 days. (D) Sensitivity of the wild type, ΔVdAda1, and EC_VdAda1 strains to different cell wall stress chemicals. Values shown are the average from three repeated experiments and the data were analyzed using one-way analysis of variance (ANOVA). Error bars represent the standard deviation of three replicate experiments. (E) Quantification of conidial production. After the strains were grown on Czapek medium for 7 days, three 7 mm-diameter plugs of the fungal colony were collected by a hole puncher and shaken in 3 mL of sterile water, and the number of conidia were counted by a hemocytometer. The #1 and #2 indicate two independent deletion mutants or complemented transformants. Values shown are the average from three repeated experiments and the data were analyzed using one-way analysis of variance (ANOVA). Error bars represent the standard deviation calculated from three replicate experiments. (F) Observations of hyphae and production of conidia by the wild type, ΔVdAda1, and EC_VdAda1 strains grown on hydrophobic cover slips for 5 days using a differential interference contrast microscope. Scale bar = 20 μm.
FIGURE 3
FIGURE 3
VdAda1 is involved in melanin synthesis and microsclerotia formation in Verticillium dahliae. (A) Colony morphology of the wild type (AT13), ΔVdAda1, and EC_VdAda1 strains on PDA and V8 medium plates at 2 weeks post-incubation. ΔVdAda1 strains show reduced melanin production, and mutant complementation restored wild type morphology. (B) The conidial suspensions of the wild type, ΔVdAda1, and EC_VdAda1 strains were adjusted to 1 × 10⁶ propagules/ml and coated on BMM medium overlaid with cellophane layer. After 2 weeks incubation at 25°C, the appearance of microsclerotia on the cellophane layer were observed and photographed by stereo microscopy (Below). Scale bar = 20 μm (C) Gray-value curves were obtained by scanning microscopy photographs of microsclerotia in (B) using ImageJ software. The numbers indicate the range of gray values of each strain. The asterisks show significant differences (***P < 0.001) compared with the wild type using one-way analysis of variance (ANOVA). (D) VdAda1 regulates the expression of melanin-associated genes. RT-qPCR was used to measure expression levels of melanin-associated genes in the wild type, ΔVdAda1, and EC_VdAda1 strains cultured on BMM medium overlaid with a cellophane membrane for 2 weeks. The V. dahliae elongation factor 1-α (VDEF-1α) was used as an endogenous control for RT-qPCR. Error bars represent the standard deviation calculated from three replicate experiments, and the asterisks indicate significant treatment differences (***P < 0.001, **P < 0.01, and *P < 0.05, respectively) in expression compared with the wild type using one-way analysis of variance (ANOVA).
FIGURE 4
FIGURE 4
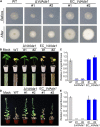
VdAda1 is required for the full virulence in Verticillium dahliae. (A) The first row shows colonies of the wild type, ΔVdAda1, and EC_VdAda1 strains grown on minimal medium (MM) overlaid with a cellophane layer at 3 dpi (before). Photographs in the second row were taken at 5 days after removal of the cellophane layer (after). (B) Phenotypes of 2-week-old cotton seedlings inoculated with agar plug (Mock), hyphae from PDA agar cultures of wild type V. dahliae strain AT13, the ΔVdAda1 mutant strains, and complemented strains. The virulence phenotypes were photographed at 14 dpi. The disease symptoms are shown at the top, and the discoloration of the inoculation shoot longitudinal sections is shown at the bottom. (C) The fungal biomass of ΔVdAda1 strains, and EC_VdAda1 strains on cotton were detected by quantitative PCR (qPCR). V. dahliae elongation factor 1-α (VdEF-1α) was used to quantify fungal colonization. The cotton 18S gene was used as endogenous plant reference gene. Error bars represent the standard deviation calculated from three replicate experiments compared with the wild type. ***, significant differences (P < 0.001) using one-way analysis of variance (ANOVA). (D) Phenotypes of 5-week-old N. benthamiana plants inoculated with agar plug (Mock), hyphae from PDA agar cultures of wild type AT13, ΔVdAda1 mutant, and complemented strains. The virulence phenotypes were photographed at 21 dpi. (E) The fungal biomass of ΔVdAda1 strains, and EC_VdAda1 strains on N. benthamiana were detected by qPCR. V. dahliae elongation factor 1-α (VdEF-1α) was used to quantify fungal colonization. The N. benthamiana EF-1α was used as endogenous plant reference gene. Error bars represent the standard deviation calculated from three replicate experiments, ***, significant differences (P < 0.001) compared with the wild type using one-way analysis of variance (ANOVA).
FIGURE 5
FIGURE 5
Influence of VdAda1 on histone acetylation in Verticillium dahliae. (A) Different acetylation of histone 3 (H3) were detected in wild type, ΔVdAda1, and EC_VdAda1 strains, using anti-H3K9ac, -H3K18ac, -H3K27ac antibodies. Hybridization with an anti-H3 C-terminus antibody served as a loading control. The molecular weight of the tested proteins was 17 kDa. (B) RT-qPCR was performed to detect the change of expression levels of all the subunits of the SAGA complex in ΔVdAda1 strain compared with wild type strain. Error bars represent the standard deviation calculated from three replicate experiments, and the asterisks show significant differences (***P < 0.001; **P < 0.01; *P < 0.05) in expression compared with the wild type using one-way analysis of variance (ANOVA).
FIGURE 6
FIGURE 6
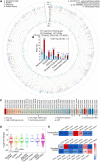
RNA-seq analysis reveals altered transcription in the ΔVdAda1 strain of Verticillium dahliae. (A) Expression pattern of 1671 DEGs in the ΔVdAda1 genome compared to the wild type strain. The DEGs of ΔVdAda1 versus wild type with cutoff log2 ratio ≥2 and P-value < 0.01. (B) Bioinformatics analysis of potential virulence-related genes regulated by VdAda1. The numbers in the columns indicate the number of different types of genes in the AT13 genome or DEGs. The numbers in blue above the columns indicate the ratio between downregulated and upregulated genes. (C) Heat map of differentially expressed transcription factors. Colored blocks from blue to red represent downregulated to upregulated genes, respectively; the fold change is the value of the log2 ratio; the corresponding gene ID is at the top of the colored blocks, and the sequences of genes beginning with DK185 that was only found in strain AT13 but not in VdLs.17 reference genome were listed in Supplementary Table 3. (D) Fold-change range of DEGs regulated by VdAda1. The range of fold-change is displayed in the Box whisker plot. The central point in each box plot represents the median, the rectangle gives the interval between the 25 and 75% percentiles, and the whisker indicates the range. Significance of log2 fold-change of secreted proteins and SCRPs compared with the total DEGs was identified using Student’s t-test. (E) Expression level of selected genes encoding secreted proteins and transcription factors were detected in the ΔVdAda1 strain compared with the expression level in wild type strain by RT-qPCR. The expression level of each gene in wild type strain was set to 1. The numbers inside the colored blocks represent the fold change of each gene.

Similar articles

Cited by

References

    1. Audic S., Claverie J. M. (1997). The significance of digital gene expression profiles. Genome Res. 7 986–995. 10.1101/gr.7.10.986 - DOI - PubMed
    1. Balasubramanian R., Pray-Grant M. G., Selleck W., Grant P. A., Tan S. (2002). Role of the Ada2 and Ada3 transcriptional coactivators in histone acetylation. J. Biol. Chem. 277 7989–7995. 10.1074/jbc.M110849200 - DOI - PubMed
    1. Baptista T., Grünberg S., Minoungou N., Koster M. J. E., Timmers H. T. M., Hahn S., et al. (2017). SAGA is a general cofactor for RNA polymerase II transcription. Mol. Cell 68 130–143. - PMC - PubMed
    1. Berger S. L., Piña B., Silverman N., Marcus G. A., Agapite J., Regier J. L., et al. (1992). Genetic isolation of ADA2: a potential transcriptional adaptor required for function of certain acidic activation domains. Cell 70 251–265. 10.1016/0092-8674(92)90100-q - DOI - PubMed
    1. Bhaumik S. R. (2011). Distinct regulatory mechanisms of eukaryotic transcriptional activation by SAGA and TFIID. Biochim. Biophys. Acta 1809 97–108. 10.1016/j.bbagrm.2010.08.009 - DOI - PMC - PubMed