. 2022 Feb 7;18(4):1677-1694.
doi: 10.7150/ijbs.69178. eCollection 2022.

TSG-6 promotes Cancer Cell aggressiveness in a CD44-Dependent Manner and Reprograms Normal Fibroblasts to create a Pro-metastatic Microenvironment in Colorectal Cancer

Affiliations

TSG-6 promotes Cancer Cell aggressiveness in a CD44-Dependent Manner and Reprograms Normal Fibroblasts to create a Pro-metastatic Microenvironment in Colorectal Cancer

Binbin Liu et al. Int J Biol Sci. .

Abstract

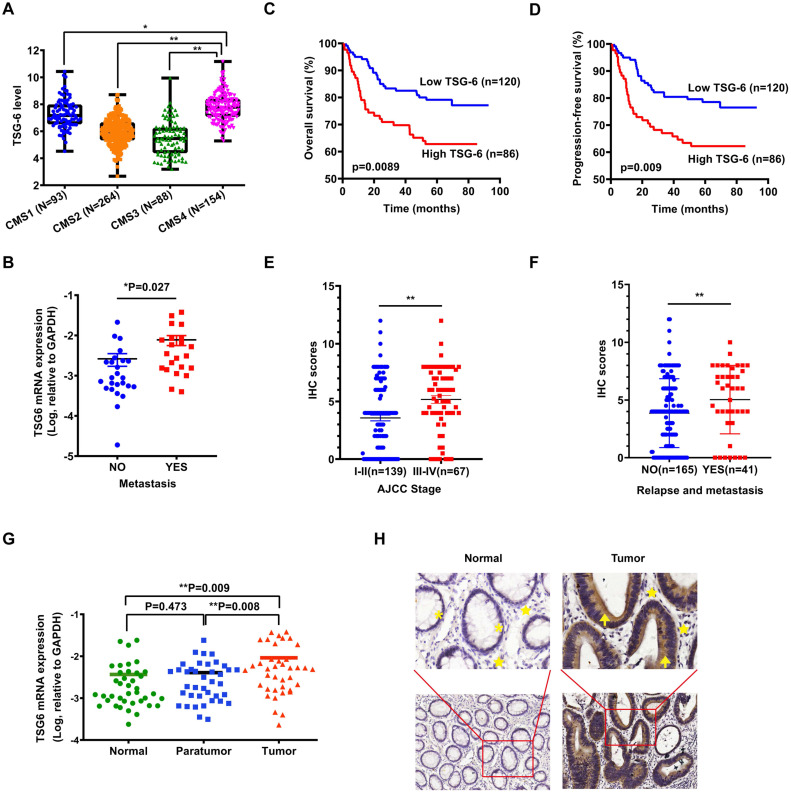
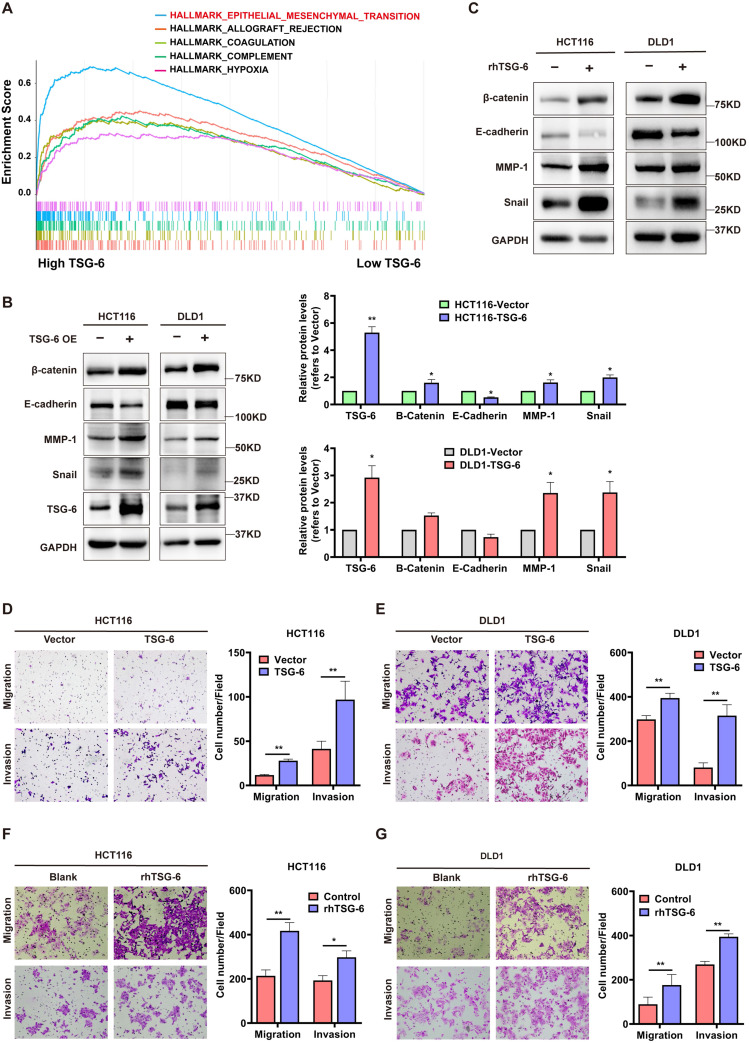
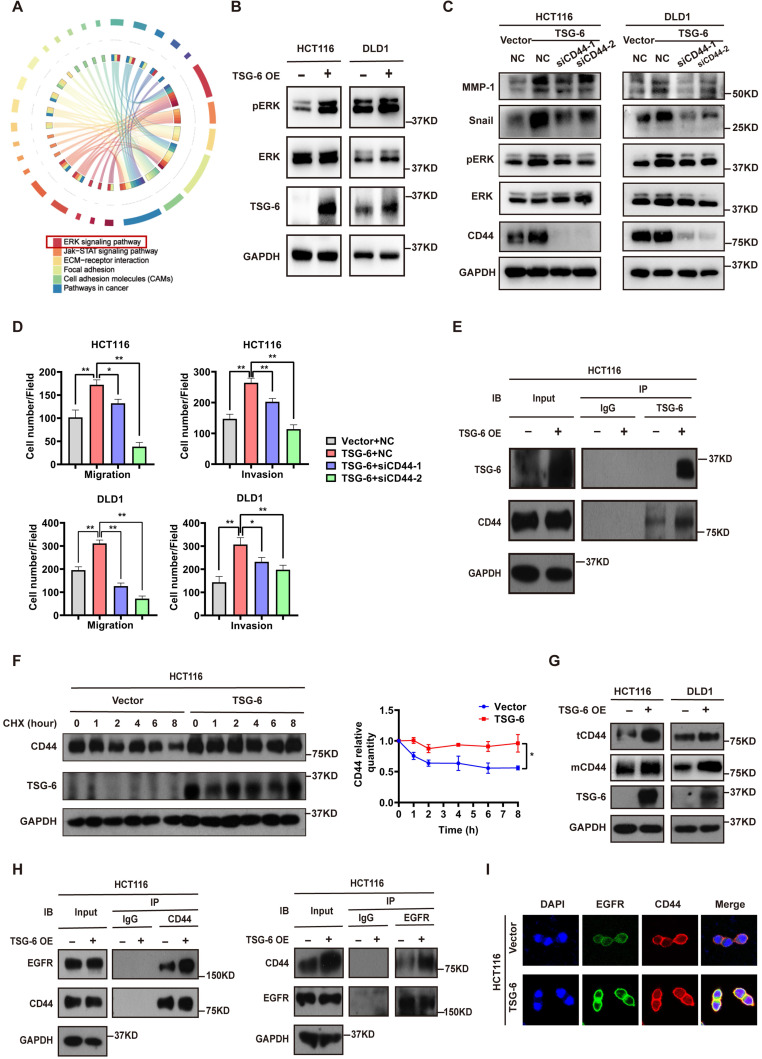
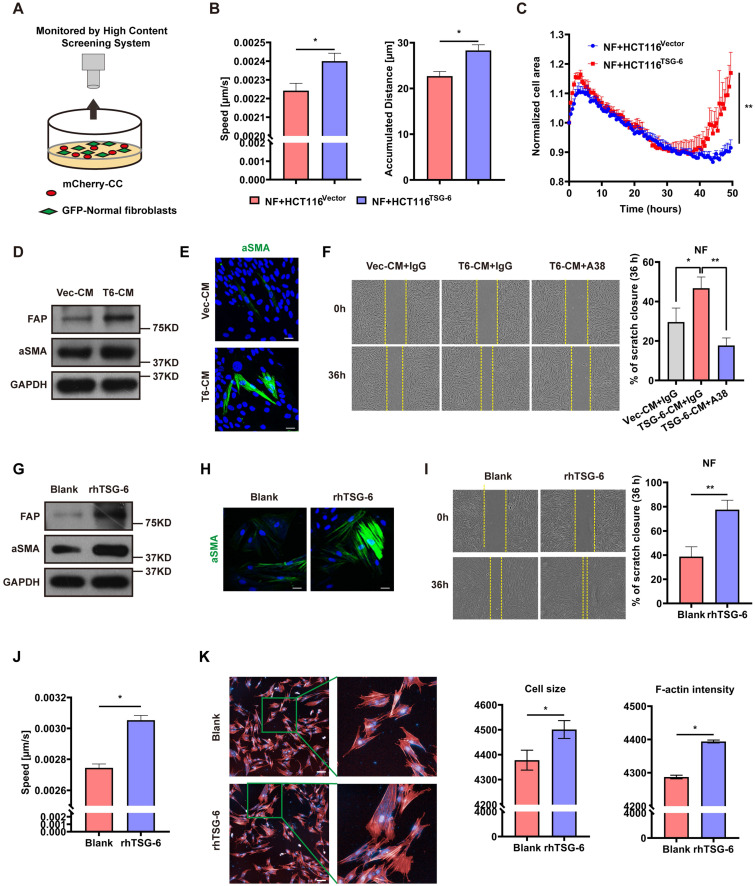
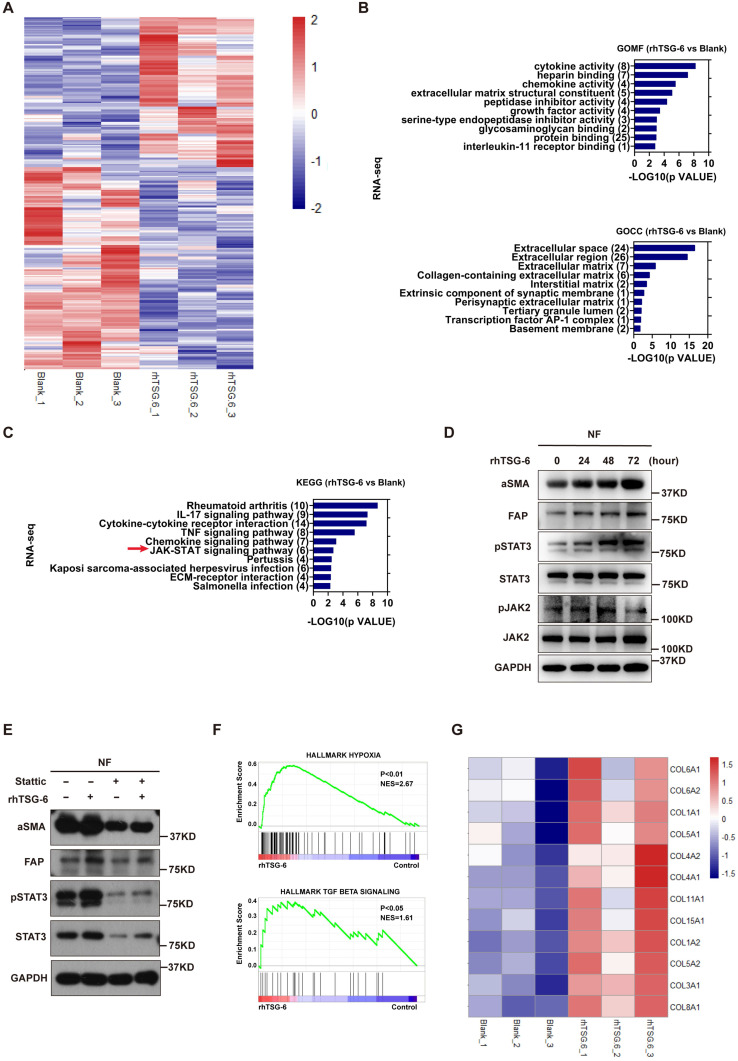
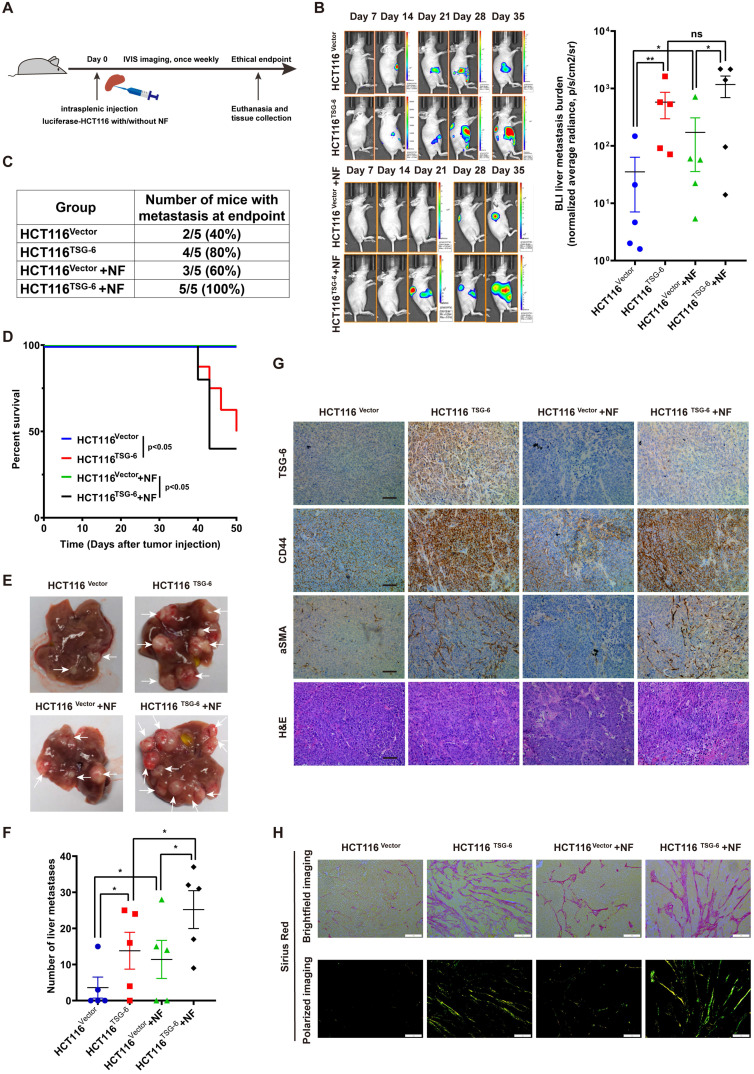
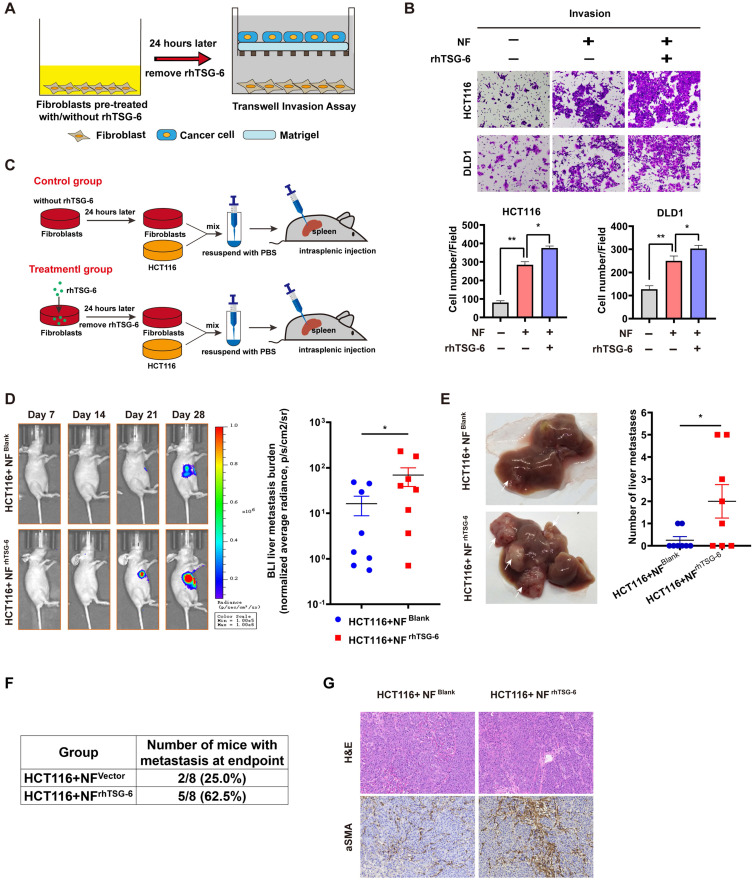
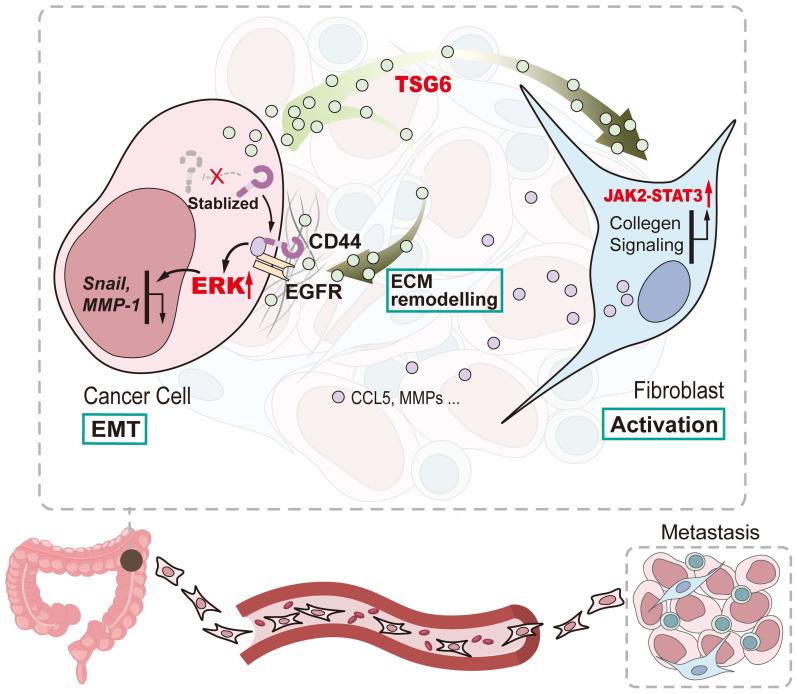
Tumor necrosis factor α stimulated gene 6 (TSG-6), a 30-KD secretory protein, plays an essential role in modulating inflammatory responses and extracellular matrix remodeling. However, little is known regarding the role of TSG-6 in human cancers. Here, we investigated the mechanism of action and the role of TSG-6 in colorectal cancer (CRC) metastasis. We found that TSG-6 was highly expressed in tumor tissues and was associated with poor prognosis and metastasis in CRC. Mechanistically, TSG-6 overexpression in CRC cells resulted in ERK activation and epithelial-mesenchymal transition by means of stabilizing CD44 and facilitating the CD44-EGFR complex formation on the cell membrane. Consequently, this resulted in the promotion of tumor migration and invasion both in vitro and in vivo. Notably, our data showed that CRC cells secreted TSG-6 could trigger a paracrine activation of JAK2-STAT3 signaling and reprogram normal fibroblasts into cancer-associated fibroblasts, which exhibited upregulation of pro-metastatic cytokines (CCL5 and MMP3) and higher movement ability. In animal models, the co-injection of cancer cells and TSG6-reprogrammed fibroblasts led to a significant increase in tumor metastasis. Our findings indicated that TSG-6 overexpression in CRC cells could promote cancer metastasis in both an autocrine and paracrine manner. Therefore, targeting TSG-6 might be a potential therapeutic strategy for the treatment of metastatic CRC.

Keywords: Colorectal Cancer; Fibroblast; Metastasis; TSG-6.


Conflict of interest statement

Competing Interests: The authors have declared that no competing interest exists.

Figures

Figure 1
Figure 1
TSG-6 is upregulated in CRC and associated with poor prognosis. (A) TSG-6 mRNA level in TCGA CRC tumors separated by CMS. (B) Quantification of TSG-6 mRNA in CRC patients with metastasis (n=25) and without metastasis (n=22). (C-D) OS (C) and PFS (D) of CRC patients (SYSU-cohort), stratified by TSG-6 IHC-score. (E) Quantification of TSG-6 IHC score in CRC patients (SYSU-cohort) separated by Stage I-II and Stage III-IV. (F) Quantification of TSG-6 IHC score in CRC patients (SYSU-cohort) separated by metastasis status. (G) Quantification of TSG-6 mRNA level in CRC tumor tissues, paired paratumor and normal tissues (n=39). (H) The representative images of immunohistochemistry staining of TSG-6 in tumor tissues and paired adjacent normal tissues. Yellow asterisks: normal epithelial cells. Yellow stars: stromal cells. Yellow arrows: cancer cells. The boxes in (A) indicate interquartile range, horizontal black lines represent median. Error bars in (B), (E), (F) and (G) represent mean ± S.E.M. Statistical analysis was performed using One-way ANOVA test (A), Log-rank Gehan-Breslow-Wilcoxon test (C, D), two tailed unpaired Student's t-test (B, E, F) and paired t-test (G). *p<0.05, **p<0.01.
Figure 2
Figure 2
TSG-6 promotes migration and invasion and induces EMT in CRC cells. (A) GSEA results showing HALLMARK (epithelial-mesenchymal transition) using GSE14333 datasets. (B-C) Western blot of indicated EMT markers in CRC cells transiently overexpressing TSG-6 (B) or treated with rhTSG-6 (C). (D-G) Transwell migration and invasion assays performed in CRC cells transiently overexpressing TSG-6 (D and E), or treated with rhTSG-6 (F and G). Cell numbers shown in the bar chart were the average of five random fields. Data information: Error bars represent mean ± S.E.M. Statistical analysis was performed using two tailed unpaired Student's t-test (B, D, E, F, G). *p<0.05, **p<0.01.
Figure 3
Figure 3
TSG-6 promotes metastasis of CRC cells by facilitating cell membrane CD44-EGFR complex formation and downstream ERK activation. (A) Chord diagram of KEGG results for mRNA expression profiles of TSG-6-overexpressed HCT116 cells versus control cells. TOP 1000 upregulated gene were selected to analyze. (B) Western blot evaluation of ERK phosphorylation in TSG-6-overexpressed CRC cells. (C) Western blot evaluation of indicated EMT markers and ERK phosphorylation in CRC cells co-transfected with TSG-6 overexpressing plasmids and siCD44. (D) Transwell migration and Matrigel invasion assays in CRC cells co-transfected with TSG-6 overexpressing plasmids and siCD44. Cell numbers shown in the bar chart were the average of five random fields. (E) CO-IP assay to determine the interaction between TSG-6 and CD44. (F) CHX chase assays to determine the half-life of CD44 in TSG-6-overexpressed HCT116 cells. (G) Western blot evaluation of total CD44 (tCD44) and membrane CD44 (mCD44) protein level in CRC cells. (H) CO-IP assay to determine the interaction between CD44 and EGFR upon TSG-6 overexpression. (I) Immunofluorescent analysis to investigate the co-localization of EGFR (green) and CD44 (red) in HCT116 transiently transfected with TSG-6 overexpressing plasmids. Data information: CRC cells used for the experiments were transiently transfected with plasmids or siRNA. Statistical analysis was performed using two tailed unpaired Student's t-test (D, F). *p<0.05, **p<0.01.
Figure 4
Figure 4
CRC cells derived TSG-6 reprograms NFs into CAFs. (A) Schematic representation of co-culture of cancer cells and GFP-labeled normal fibroblasts, cancer cells were transfected by mCherry-Vector plasmids or mCherry-TSG-6 overexpressing plasmids. (B-C) High Content Screening assay to monitor the speed, movement distance (B) and cell size (C) of NFs coculturing with CRC cells. (D) Western blot evaluation of α-SMA and FAP expression in NFs treated with Vec-CM or T6-CM. (E) Immunostaining of α-SMA in NFs treated with Vec-CM or T6-CM, detected by confocal microscopy (Magnification: 200×). Scale bars: 10 µm. (F) Wound healing assay to determine the migration of NFs cultured with T6-CM and Vec-CM. TSG-6 neutralizing antibody A38 could abolish the effect of T6-CM. (G) Western blot evaluation of α-SMA and FAP expression in NFs treated with or without rhTSG-6. (H) Immunostaining of α-SMA in NFs treated with or without rhTSG-6, detected by confocal microscopy (Magnification: 200×). Scale bars: 10 µm. (I) Wound healing assay to determine the migration of NFs treated with or without rhTSG-6. (J-K) High Content Screening assay to monitor the movement speed (J), cell size and F-actin intensity (K) of NFs treated with rhTSG-6. F-actin stained with phalloidin (red) and nuclei stained with DAPI (blue). Scale bars: 20 µm. Data information: Statistical analysis was performed using two tailed unpaired Student's t-test (B, C, F, I, J, K). *p<0.05, **p<0.01.
Figure 5
Figure 5
TSG-6 triggers paracrine activation of JAK2-STAT3 signaling in NFs. (A) Heat map displays dysregulated genes (p<0.05, |log2 FC|≥0.5) in fibroblasts after rhTSG-6 treatment (detail genes in supplementary Table S1). (B) GO analysis of the TOP 275 dysregulated gene for RNAseq identified enrichment of ECM remodeling and cytokine secretion features in rhTSG-6 treated NFs versus control NFs. GOMF means GO molecular function; GOCC means GO cellular component. (C) KEGG analysis for RNAseq showing the enrichment of JAK-STAT signaling pathway in rhTSG-6 treated NFs versus control NFs. (D) Western blot evaluation of indicated markers in NFs treated with rhTSG-6 for 0, 24, 48, 72 hours. (E) Western blot evaluation of indicated markers in NFs pre-treated with STAT3 inhibitor (Stattic) for 6 hours and then cultured with rhTSG-6 for 24 hours. (F) GSEA results showing enrichment of HALLMARK (hypoxia and TGF-b signaling) in NFs treated with rhTSG-6. (G) Heat map showing collagen expression in NFs upon rhTSG-6 treatment.
Figure 6
Figure 6
Crosstalk between TSG-6-overexpressed cancer cells and normal fibroblasts drives metastasis in vivo. (A) Schematic representation of intrasplenic injection of TSG-6-overexpressed HCT116 with or without fibroblasts and IVIS monitoring of liver metastasis. (B) Left panel: representative images of whole body IVIS imaging in mice bearing liver metastatic burden from four groups, five mice for each group (n=5). Right panel: statistical chart summarized the average bioluminescent imaging signal of all mice at the end of the experiment for each group. (C) Table summarizing liver metastatic rate for each group. (D) Kaplan-Meier analysis of survival in mice for each group. (E-F) Representative images of metastatic foci (pointed out with white arrow) in mice liver (E) and number of liver metastatic foci for mice (F) in all four groups. (G) IHC staining of TSG-6, CD44, α-SMA and H&E staining in paraffin-embedded sections from the resected mice livers. Scale bar represent 100 µm. (H) Representative images of picrosirius red staining imaged with brightfield or polarized light. Scale bar represent 100 µm. Data information: Error bars represent mean ± S.E.M. Statistical analysis was performed using two tailed unpaired Student's t-test (B, F) and Log-rank Gehan-Breslow-Wilcoxon test (D). *p<0.05, **p<0.01.
Figure 7
Figure 7
TSG-6 activated CAFs in turn promotes CRC metastasis. (A) Schematic representation of Transwell Invasion Assay. Normal fibroblasts were pretreated with or without rhTSG-6 for 24 hours and then changed to normal culture medium. Cancer cells and fibroblasts were seeded in the upper wells and lower wells, respectively. (B) Representative image of transwell invasion assays. Cell numbers shown in the bar chart were the average of five random fields. (C) Schematic representation of intrasplenic injection of HCT116 with normal fibroblasts which were pretreated with or without rhTSG-6 for 24 hours. IVIS monitoring of liver metastasis was performed once weekly. (D) Left panel: representative images of whole body IVIS imaging in mice bearing liver metastatic burden from both groups, eight mice for each group (n=8). Right panel: statistical chart summarized the average bioluminescent imaging signal of all mice at the end of the experiment for each group. (E) Representative images of metastatic foci (pointed out with white arrow) in mice liver and number of liver metastatic foci for mice in both groups. (F) Table summarizing liver metastatic rate for both groups. (G) IHC staining of α-SMA and H&E staining in paraffin-embedded sections from the resected mice livers for both groups. Scale bar represent 100 µm. Data information: Error bars represent mean ± S.E.M. Statistical analysis was performed using two tailed unpaired Student's t-test (B, D, E). *p<0.05, **p<0.01.
Figure 8
Figure 8
Schematic diagram of TSG-6 creating a pro-metastatic microenvironment in CRC. TSG-6-CD44-ERK autocrine signaling pathway in CRC cells and TSG-6-JAK2-STAT3 paracrine signaling pathway in fibroblasts synergistically promote CRC metastasis.

Similar articles

Cited by

References

    1. Sung H, Ferlay J, Siegel RL, Laversanne M, Soerjomataram I, Jemal A. et al. Global Cancer Statistics 2020: GLOBOCAN Estimates of Incidence and Mortality Worldwide for 36 Cancers in 185 Countries. CA Cancer J Clin. 2021;71:209–49. - PubMed
    1. Siegel RL, Miller KD, Goding Sauer A, Fedewa SA, Butterly LF, Anderson JC. et al. Colorectal cancer statistics, 2020. CA Cancer J Clin. 2020;70:145–64. - PubMed
    1. Thorsteinsson M, Jess P. The clinical significance of circulating tumor cells in non-metastatic colorectal cancer-a review. Eur J Surg Oncol. 2011;37:459–65. - PubMed
    1. Dienstmann R, Vermeulen L, Guinney J, Kopetz S, Tejpar S, Tabernero J. Consensus molecular subtypes and the evolution of precision medicine in colorectal cancer. Nat Rev Cancer. 2017;17:268. - PubMed
    1. Guinney J, Dienstmann R, Wang X, de Reynies A, Schlicker A, Soneson C. et al. The consensus molecular subtypes of colorectal cancer. Nat Med. 2015;21:1350–6. - PMC - PubMed

Publication types

MeSH terms