

Micro-Fourier-transform infrared reflectance spectroscopy as tool for probing IgG glycosylation in COVID-19 patients
- PMID: 35277543
- PMCID: PMC8914452
- DOI: 10.1038/s41598-022-08156-6
Micro-Fourier-transform infrared reflectance spectroscopy as tool for probing IgG glycosylation in COVID-19 patients
Abstract
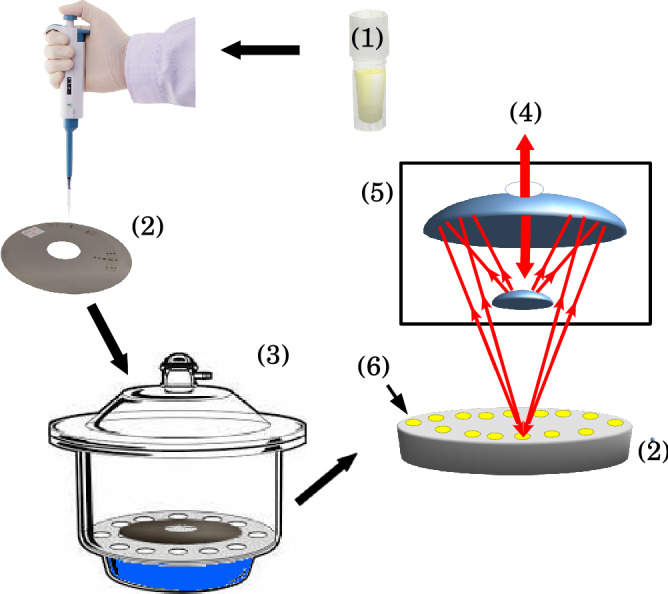
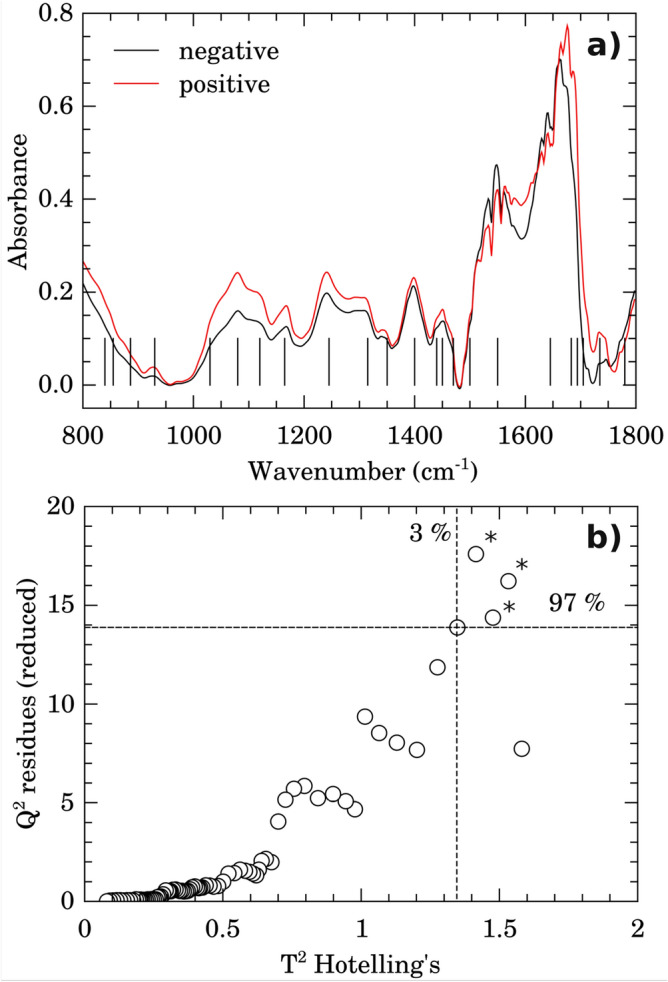
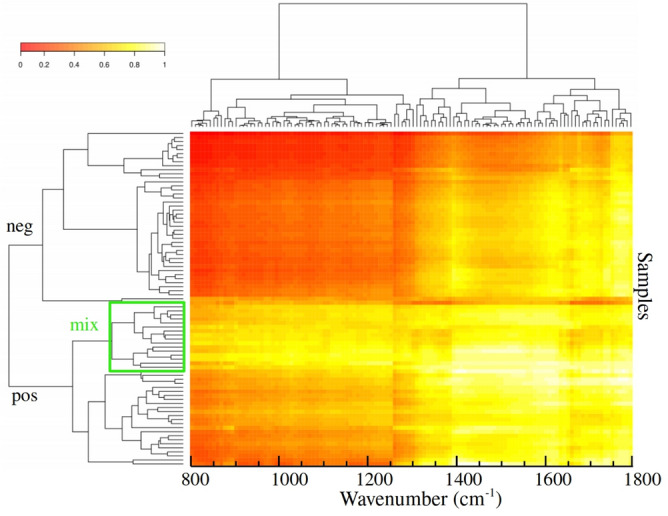
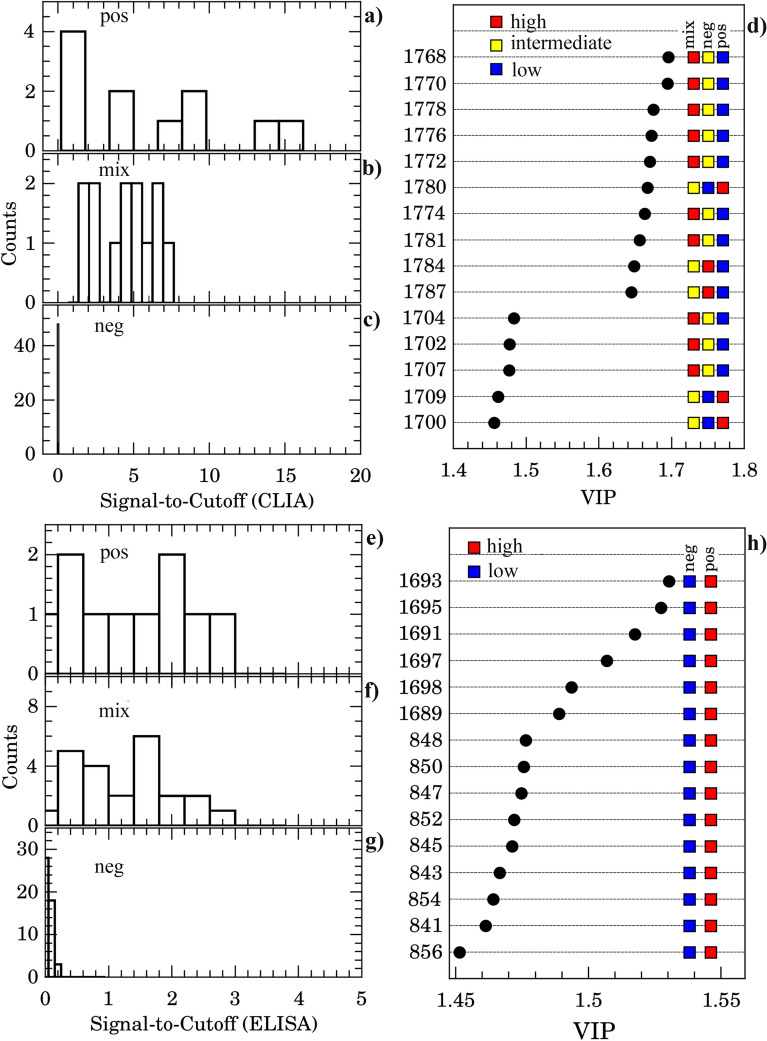
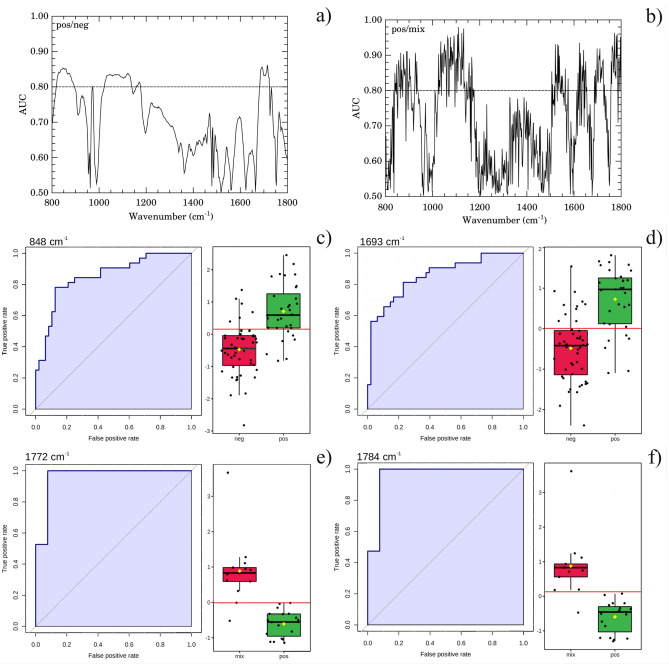
It has been reported that patients diagnosed with COVID-19 become critically ill primarily around the time of activation of the adaptive immune response. However the role of antibodies in the worsening of disease is not obvious. Higher titers of anti-spike immunoglobulin IgG1 associated with low fucosylation of the antibody Fc tail have been associated to excessive inflammatory response. In contrast it has been also reported that NP-, S-, RBD- specific IgA, IgG, and IgM are not associated with SARS-CoV-2 viral load, indicating that there is no obvious correlation between antibody response and viral antigen detection. In the present work the micro-Fourier-transform infrared reflectance spectroscopy (micro-FTIR) was employed to investigate blood serum samples of healthy and COVID-19-ill (mild or oligosymptomatic) individuals (82 healthcare workers volunteers in "Instituto de Infectologia Emilio Ribas", São Paulo, Brazil). The molecular-level-sensitive, multiplexing quantitative and qualitative FTIR data probed on 1 µL of dried biofluid was compared to signal-to-cutoff index of chemiluminescent immunoassays CLIA and ELISA (IgG antibodies against SARS-CoV-2). Our main result indicated that 1702-1785 [Formula: see text] spectral window (carbonyl C=O vibration) is a spectral marker of the degree of IgG glycosylation, allowing to probe distinctive sub-populations of COVID-19 patients, depending on their degree of severity. The specificity was 87.5 % while the detection rate of true positive was 100%. The computed area under the receiver operating curve was equivalent to CLIA, ELISA and other ATR-FTIR methods ([Formula: see text]). In summary, overall discrimination of healthy and COVID-19 individuals and severity prediction as well could be potentially implemented using micro-FTIR reflectance spectroscopy on blood serum samples. Considering the minimal and reagent-free sample preparation procedures combined to fast (few minutes) outcome of FTIR we can state that this technology is suitable for fast screening of immune response of individuals with COVID-19. It would be an important tool in prospective studies, helping investigate the physiology of the asymptomatic, oligosymptomatic, or severe individuals and measure the extension of infection dissemination in patients.
© 2022. The Author(s).
Conflict of interest statement
The authors declare no competing interests.
Figures
Similar articles
-
Diagnostic accuracy of an automated chemiluminescent immunoassay for anti-SARS-CoV-2 IgM and IgG antibodies: an Italian experience.J Med Virol. 2020 Sep;92(9):1671-1675. doi: 10.1002/jmv.25932. Epub 2020 May 10. J Med Virol. 2020. PMID: 32330291 Free PMC article.
-
Evaluation of Two Chemiluminescent and Three ELISA Immunoassays for the Detection of SARS-CoV-2 IgG Antibodies: Implications for Disease Diagnosis and Patients' Management.Front Immunol. 2020 Dec 23;11:609242. doi: 10.3389/fimmu.2020.609242. eCollection 2020. Front Immunol. 2020. PMID: 33424863 Free PMC article.
-
High titers and low fucosylation of early human anti-SARS-CoV-2 IgG promote inflammation by alveolar macrophages.Sci Transl Med. 2021 Jun 2;13(596):eabf8654. doi: 10.1126/scitranslmed.abf8654. Epub 2021 May 11. Sci Transl Med. 2021. PMID: 33979301 Free PMC article.
-
A comparative review of immunoassays for COVID-19 detection.Expert Rev Clin Immunol. 2021 Jun;17(6):573-599. doi: 10.1080/1744666X.2021.1908886. Expert Rev Clin Immunol. 2021. PMID: 33787412 Review.
-
Seropositivity rate and diagnostic accuracy of serological tests in 2019-nCoV cases: a pooled analysis of individual studies.Eur Rev Med Pharmacol Sci. 2020 Oct;24(19):10208-10218. doi: 10.26355/eurrev_202010_23243. Eur Rev Med Pharmacol Sci. 2020. PMID: 33090430 Review.
Cited by
-
Potential of ATR-FTIR-Chemometrics in Covid-19: Disease Recognition.ACS Omega. 2022 Aug 25;7(35):30756-30767. doi: 10.1021/acsomega.2c01374. eCollection 2022 Sep 6. ACS Omega. 2022. PMID: 36092630 Free PMC article.
-
Raman and fourier transform infrared spectroscopy techniques for detection of coronavirus (COVID-19): a mini review.Front Chem. 2023 May 18;11:1193030. doi: 10.3389/fchem.2023.1193030. eCollection 2023. Front Chem. 2023. PMID: 37273513 Free PMC article. Review.
References
Publication types
MeSH terms
Substances
Grants and funding
LinkOut - more resources
Full Text Sources
Medical
Miscellaneous
