. 2022 Mar 11;18(3):e1010371.
doi: 10.1371/journal.ppat.1010371. eCollection 2022 Mar.

Essential role of hyperacetylated microtubules in innate immunity escape orchestrated by the EBV-encoded BHRF1 protein

Affiliations

Essential role of hyperacetylated microtubules in innate immunity escape orchestrated by the EBV-encoded BHRF1 protein

Damien Glon et al. PLoS Pathog. .

Abstract

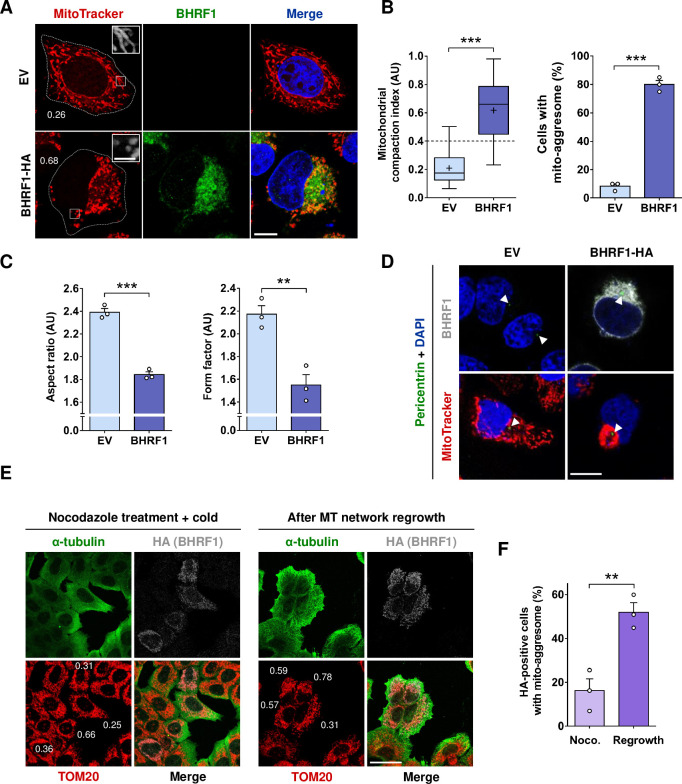
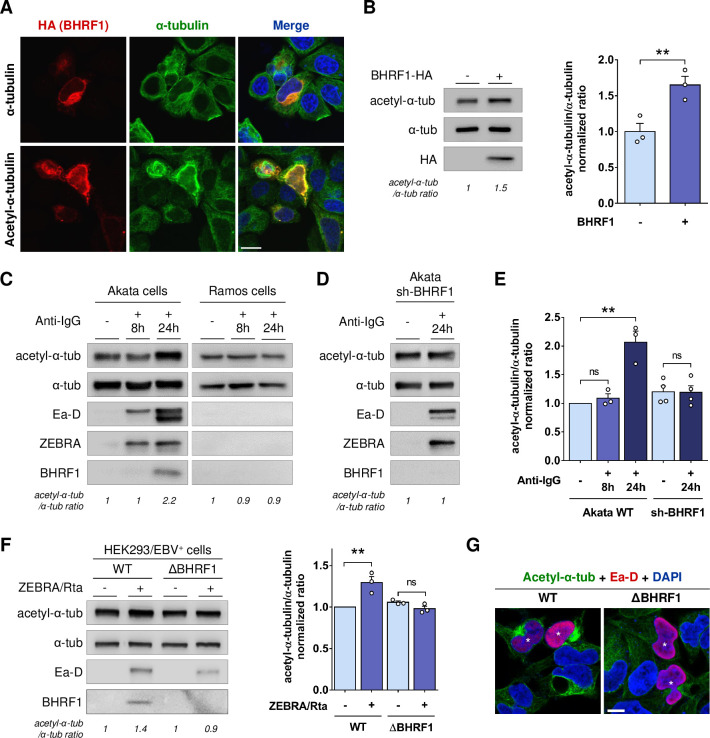
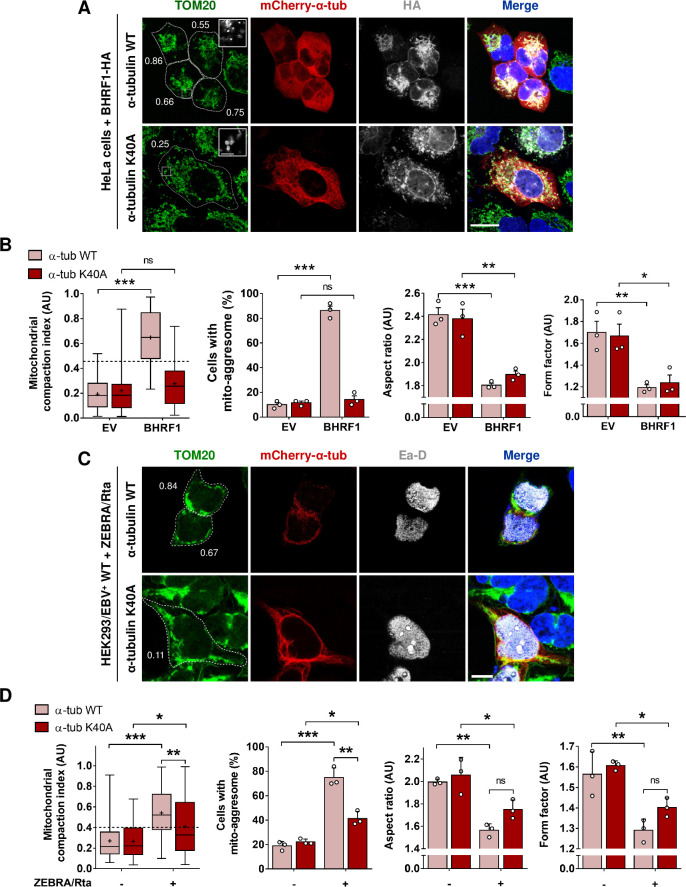
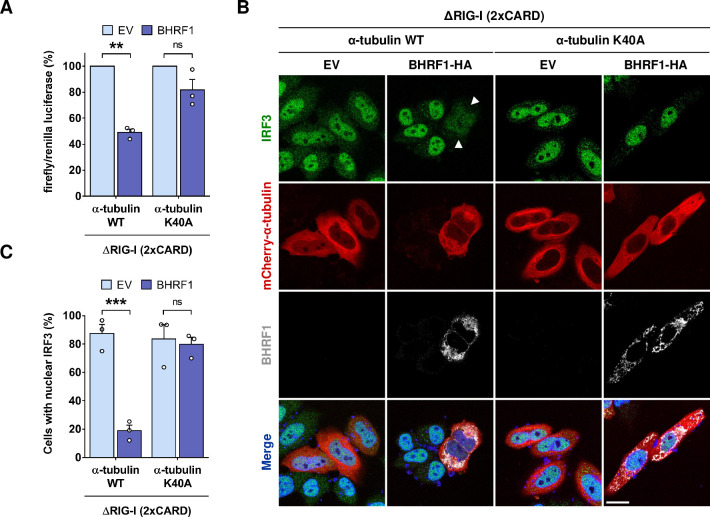
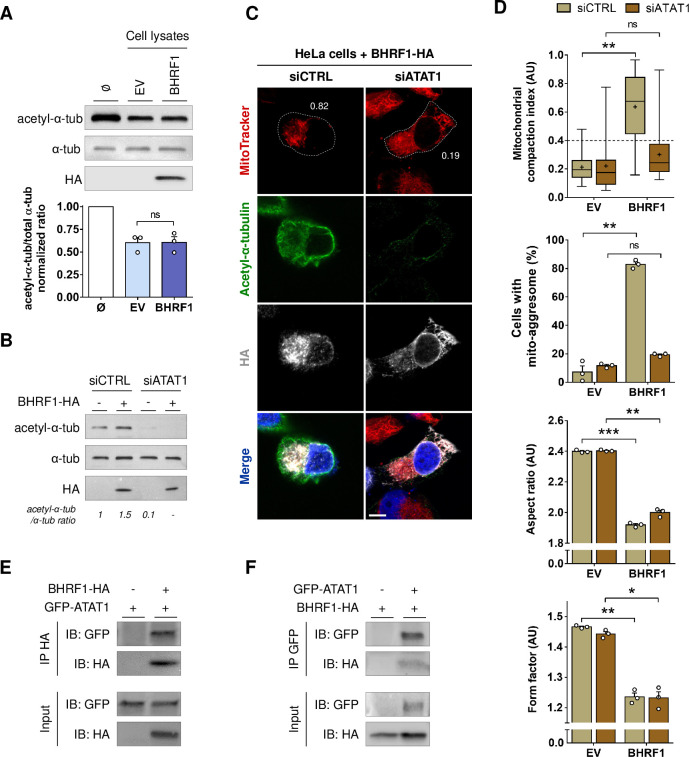
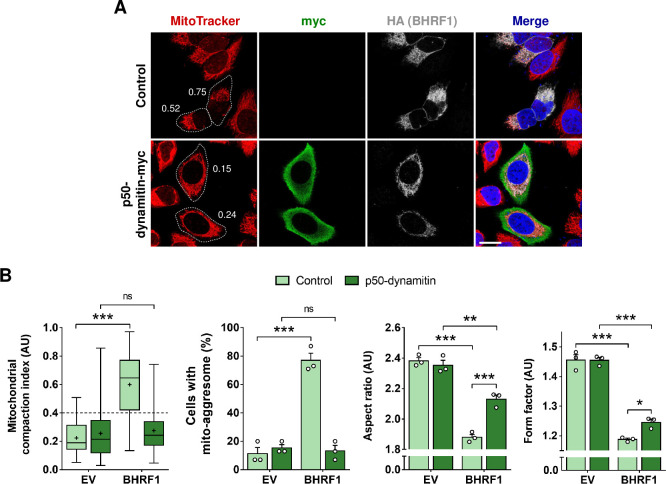
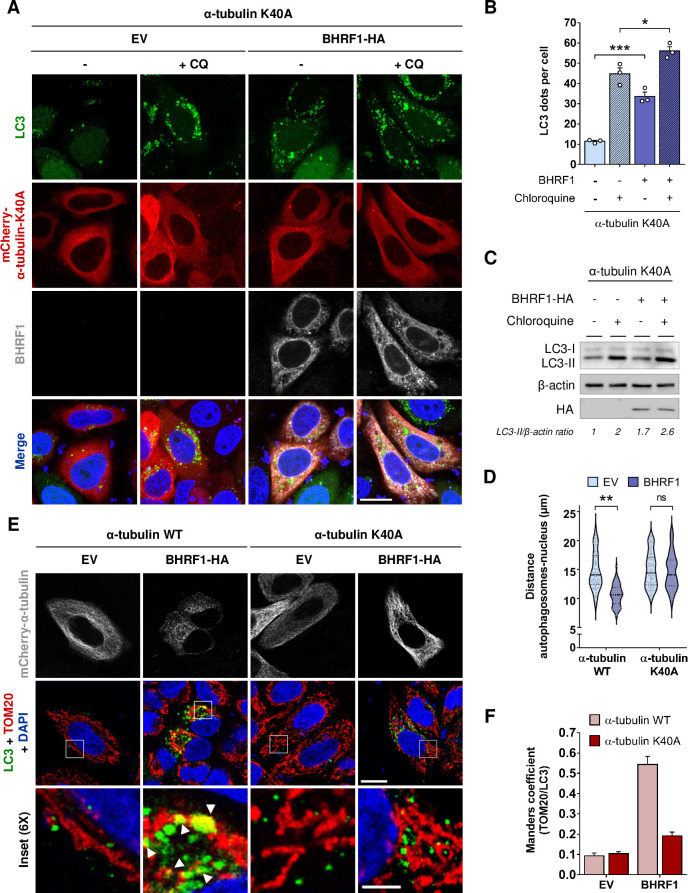
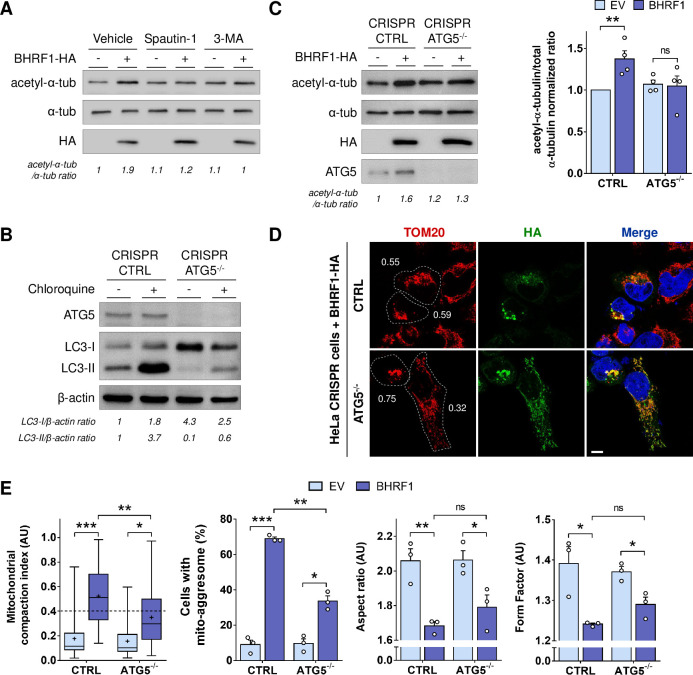
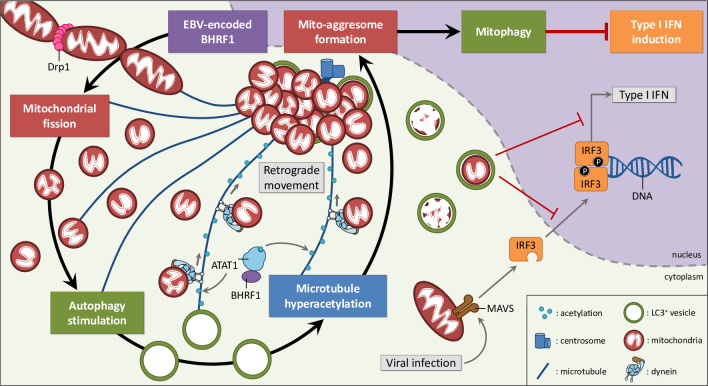
Innate immunity constitutes the first line of defense against viruses, in which mitochondria play an important role in the induction of the interferon (IFN) response. BHRF1, a multifunctional viral protein expressed during Epstein-Barr virus reactivation, modulates mitochondrial dynamics and disrupts the IFN signaling pathway. Mitochondria are mobile organelles that move through the cytoplasm thanks to the cytoskeleton and in particular the microtubule (MT) network. MTs undergo various post-translational modifications, among them tubulin acetylation. In this study, we demonstrated that BHRF1 induces MT hyperacetylation to escape innate immunity. Indeed, the expression of BHRF1 induces the clustering of shortened mitochondria next to the nucleus. This "mito-aggresome" is organized around the centrosome and its formation is MT-dependent. We also observed that the α-tubulin acetyltransferase ATAT1 interacts with BHRF1. Using ATAT1 knockdown or a non-acetylatable α-tubulin mutant, we demonstrated that this hyperacetylation is necessary for the mito-aggresome formation. Similar results were observed during EBV reactivation. We investigated the mechanism leading to the clustering of mitochondria, and we identified dyneins as motors that are required for mitochondrial clustering. Finally, we demonstrated that BHRF1 needs MT hyperacetylation to block the induction of the IFN response. Moreover, the loss of MT hyperacetylation blocks the localization of autophagosomes close to the mito-aggresome, impeding BHRF1 to initiate mitophagy, which is essential to inhibiting the signaling pathway. Therefore, our results reveal the role of the MT network, and its acetylation level, in the induction of a pro-viral mitophagy.


Conflict of interest statement

The authors declare that they have no conflict of interest.

Figures

Fig 1
Fig 1. BHRF1 induces the formation of mito-aggresomes in a MT-dependent manner.
(A-C) HeLa cells were transfected for 24 h with BHRF1-HA plasmid or with EV as a control. Mitochondria were labeled with MitoTracker and cells immunostained for BHRF1. Nuclei were stained with DAPI. (A) Confocal images with insets (3X) on mitochondrial phenotype. Values of mitochondrial CI are indicated on representative cells. Scale bars: 10 μm and 2 μm for insets. (B) Left, assessment of mitochondrial aggregation by calculation of CI. Right, percentage of cells presenting a mito-aggresome (n = 20 cells per condition). (C) Quantification of mitochondrial fission parameters, aspect ratio (AR; left panel) and form factor (FF, right panel). (D) Confocal images of HeLa cells transfected with BHRF1-HA plasmid (or EV) and immunostained for pericentrin and BHRF1 (upper panel) or mitochondria (lower panel). Nuclei were stained with DAPI. Scale bar: 20 μm. Arrowheads show the centrosomal localization of pericentrin. (E-F) MT network depolymerization assay. (E) Representative images where BHRF1 expression was visualized by HA immunostaining (gray), the MT network by α-tubulin immunostaining (green), and mitochondria are immunostained with an anti-TOM20 antibody (red). Values of mitochondrial CI are indicated on representative cells. Scale bars: 10 μm. (F) Percentage of BHRF1-HA-positive cells presenting a mito-aggresome (n = 30 cells per condition) in cells treated with nocodazole and after MT regrowth. Data represent the mean ± SEM of three independent experiments. ** P < 0.01; *** P < 0.001 (Student’s t-test).
Fig 2
Fig 2. BHRF1 stimulates MT hyperacetylation.
(A) Representative images of HeLa cells expressing BHRF1-HA and immunostained for HA and α-tubulin (upper panel) or acetyl-α-tubulin (lower panel). Nuclei were stained with DAPI. Scale bar: 20 μm. (B) Left, immunoblot analysis of acetyl and total α-tubulin in BHRF1-HA-transfected HeLa cells. Right, normalized ratios of acetyl-α-tubulin to total α-tubulin. (C) Immunoblot analysis of acetyl-α-tubulin, α-tubulin, Ea-D, ZEBRA and BHRF1 in the Akata and Ramos cells treated or not with anti-human IgG for 8 h or 24 h to induce EBV reactivation. (D) Immunoblot analysis of acetyl-α-tubulin, α-tubulin, Ea-D, ZEBRA and BHRF1 in Akata cells deficient for BHRF1 expression (sh-BHRF1). (E) Normalized ratios of acetyl-α-tubulin to α-tubulin in Akata cells. (F-G) EBV WT or EBV ΔBHRF1 were reactivated in HEK293 cells by transfection with ZEBRA and Rta plasmids for 24 h. (F) Left, immunoblot analysis of acetyl-α-tubulin, α-tubulin, Ea-D and BHRF1. Right, normalized ratios of acetyl-α-tubulin to α-tubulin. (G) Confocal images of HEK293/EBV+ cells immunostained for acetyl-α-tubulin and Ea-D. Nuclei were stained with DAPI. Scale bar: 20 μm. Stars indicate EBV-reactivated cells. Data represent the mean ± SEM of three independent experiments. ns = non-significant; ** P < 0.01 (Student’s t-test).
Fig 3
Fig 3. MT hyperacetylation is required for BHRF1-induced mito-aggresomes formation.
(A-B) HeLa cells were co-transfected with plasmids encoding BHRF1-HA and either mCherry-α-tubulin WT or a non-acetylatable form (K40A). (A) Confocal images with insets (3X) of cells immunostained for HA and TOM20. Nuclei were stained with DAPI. Scale bars: 10 μm and 4 μm for insets. Values of mitochondrial CI are indicated on representative cells. Images of control cells are presented in S3B Fig. (B) Quantification of CI, percentage of cells with a mito-aggresome and mitochondrial fission parameters (n = 20 cells per condition). (C-D) HEK293/EBV+ WT cells were co-transfected with plasmids encoding ZEBRA, Rta and either mCherry-α-tubulin WT or K40A. (C) Confocal images of cells immunostained for Ea-D and TOM20. Nuclei were stained with DAPI. Scale bar: 10 μm. Values of mitochondrial CI are indicated on representative cells. (D) Quantification of CI, percentage of cells with a mito-aggresome and mitochondrial fission parameters (n = 20 cells per condition). Data represent the mean ± SEM of three independent experiments. ns = non-significant; * P < 0.05; ** P < 0.01; *** P < 0.001 (Student’s t-test).
Fig 4
Fig 4. MT hyperacetylation is required for BHRF1 to block IFN.
(A) Luciferase reporter assay on HEK293T cells co-expressing BHRF1 (or EV) and α-tubulin K40A (or WT). Activation of the IFN-β promoter was analyzed 24 h post-transfection. Firefly/renilla luciferase ratios were calculated and normalized to control conditions. (B-C) HeLa cells were co-transfected for 24 h with plasmids encoding BHRF1-HA (or EV), mCherry-α-tubulin K40A (or WT), and ΔRIG-I (2xCARD). (B) Confocal images. BHRF1-HA-transfected cells were visualized with an anti-HA antibody and cells were immunostained with an-anti IRF3 antibody. Nuclei were stained with DAPI. Scale bar: 20 μm. Arrows indicate BHRF1-expressing cells without IRF3 nuclear localization. (C) Percentage of cells expressing mCherry-α-tubulin and presenting IRF3 nuclear localization (n = 50 cells per condition). Data represent the mean ± SEM of three independent experiments. ns = non-significant; ** P < 0.01; *** P < 0.001 (Student’s t-test).
Fig 5
Fig 5. MT hyperacetylation and mito-aggresome formation require ATAT1, which interacts with BHRF1.
(A) Tubulin deacetylation assay. HeLa cells were transfected with BHRF1-HA plasmid (or EV) and lysed 48 h post-transfection. Cell lysates were incubated in vitro with porcine brain tubulin and NAD+. BHRF1-HA, acetyl-α-tubulin and α-tubulin were detected by immunoblot, and the histograms represent the normalized ratios of acetyl-α-tubulin to α-tubulin. (B-D) After knockdown of ATAT1 by siRNA transfection, HeLa cells were transfected with BHRF1-HA for 24 h. (B) Loss of ATAT1 activity was visualized by immunoblot analysis of acetyl-α-tubulin and α-tubulin. (C) Confocal images. Mitochondria were labeled with MitoTracker, and cells were immunostained for acetyl-α-tubulin and HA. Nuclei were stained with DAPI. Values of mitochondrial CI are indicated on representative cells. Scale bar: 20 μm. Images of EV-transfected cells are presented in S6 Fig. (D) Quantification of CI, percentage of cells with a mito-aggresome and mitochondrial fission parameters (n = 20 cells per condition). (E-F) HeLa cells were co-transfected with GFP-ATAT1 and BHRF1-HA plasmids for 24 h. (E) After immunoprecipitation of BHRF1 with an anti-HA antibody, proteins were detected by immunoblotting with anti-GFP and anti-HA antibodies. (F) After immunoprecipitation of GFP-ATAT1 with an anti-GFP antibody, proteins were detected by immunoblotting with anti-GFP and anti-HA antibodies.Data represent the mean ± SEM of three independent experiments. ns = non-significant; * P < 0.05; ** P < 0.01; *** P < 0.001 (Student’s t-test).
Fig 6
Fig 6. Dynein-based transport is required for BHRF1 to aggregate mitochondria next to the nucleus.
(A-B) HeLa cells were co-transfected with plasmids encoding BHRF1-HA and p50-dynamitin-myc (or control) for 24 h. (A) Confocal images. Mitochondria were labeled with MitoTracker, and cells were immunostained for c-myc and HA. Nuclei were stained with DAPI. Values of mitochondrial CI are indicated on representative cells. Scale bar: 20 μm. Images of cells co-expressing EV and p50-dynamitin-myc are presented in S8A Fig. (B) Quantification of CI, percentage of cells with a mito-aggresome and mitochondrial fission parameters (n = 20 cells per condition). Data represent the mean ± SEM of three independent experiments. ns = non-significant; * P < 0.05, ** P < 0.01; *** P < 0.001 (Student’s t-test).
Fig 7
Fig 7. MT hyperacetylation is dispensable for BHRF1-pro-autophagic activity, but essential for mitophagy.
HeLa cells were co-transfected for 24 h with plasmids encoding BHRF1-HA (or EV) and mCherry-α-tubulin K40A (or WT) and treated with chloroquine when indicated. (A) Confocal images. Cells were immunostained for BHRF1 and LC3 and nuclei stained with DAPI. Scale bar: 10 μm. Images of cells transfected with mCherry-α-tubulin WT are presented in S9A Fig. (B) Quantification of LC3 dots (n = 30 cells per condition). (C) Immunoblot analysis of LC3 and BHRF1-HA expression. β-actin was used as a loading control. (D) Measurement of the distance between autophagosomes and nucleus (n = 60 cells from three independent experiments). (E) Confocal images of cells immunostained for TOM20 and LC3. Nuclei were stained with DAPI. Insets (6X) show colocalization events (see arrows). Scale bars: 10 μm and 5 μm for insets. (F) Colocalization level (Manders coefficient) between mitochondria (TOM20) and autophagosomes (LC3) (n = 30 cells per condition). Data represent the mean ± SEM of three independent experiments. ns = non-significant; * P < 0.05, ** P < 0.01; *** P < 0.001 (Student’s t-test).
Fig 8
Fig 8. Autophagy inhibition prevents BHRF1-induced hyperacetylation and mito-aggresome formation.
(A) Immunoblot analysis of acetyl-α-tubulin and α-tubulin of HeLa cells transfected with BHRF1-HA and treated or not with autophagic inhibitors (spautin-1 or 3-MA). (B) Control of the autophagy level and ATG5 extinction in HeLa cells treated or not with chloroquine. Immunoblot analysis of ATG5 and LC3. β-actin was used as a loading control. (C-E) HeLa cells deficient ATG5 (CRISPR ATG5-/-) and control cells (CRISPR CTRL) were transfected with BHRF1-HA for 24 h. (C) Left, immunoblot analysis of acetyl-α-tubulin, α-tubulin, HA and ATG5. Right, normalized ratios of acetyl-α-tubulin to α-tubulin. (D) Confocal images of cells immunostained for TOM20 and HA. Nuclei were stained with DAPI. Values of mitochondrial CI are indicated on representative cells. Scale bar: 10 μm. (E) Quantification of CI, percentage of cells with a mito-aggresome and mitochondrial fission parameters (n = 20 cells per condition). Data represent the mean ± SEM of three independent experiments. ns = non-significant; * P < 0.05; ** P < 0.01; *** P < 0.001 (Student’s t-test).
Fig 9
Fig 9. Working model.
EBV encodes a Bcl-2 homolog that dampens type I IFN induction thanks to MT hyperacetylation. BHRF1 induces Drp1-mediated mitochondrial fission and subsequently autophagy. These cellular modifications lead to the mito-aggresome formation, and we demonstrated that the MT network and in particular its acetylation level are essential for this mitochondrial phenotype. Moreover, BHRF1 interacts with ATAT1 and induces MT hyperacetylation through ATAT1 activation. This hyperacetylation allows the retrograde transport of mitochondria in a dynein-dependent manner. Finally, sequestration and degradation of mitochondria block the innate immunity.

Similar articles

Cited by

References

    1. Lee AJ, Ashkar AA. The Dual Nature of Type I and Type II Interferons. Front Immunol. 2018;9: 2061–2070. doi: 10.3389/fimmu.2018.02061 - DOI - PMC - PubMed
    1. Arnoult D, Soares F, Tattoli I, Girardin SE. Mitochondria in innate immunity. EMBO Rep. 2011;12: 901–910. doi: 10.1038/embor.2011.157 - DOI - PMC - PubMed
    1. West AP, Shadel GS, Ghosh S. Mitochondria in innate immune responses. Nat Rev Immunol. 2011;11: 389–402. doi: 10.1038/nri2975 - DOI - PMC - PubMed
    1. Frederick RL, Shaw JM. Moving Mitochondria: Establishing Distribution of an Essential Organelle. Traffic. 2007;8: 1668–1675. doi: 10.1111/j.1600-0854.2007.00644.x - DOI - PMC - PubMed
    1. Kruppa AJ, Buss F. Motor proteins at the mitochondria-cytoskeleton interface. J Cell Sci. 2021;134: 1–13. doi: 10.1242/jcs.254763 - DOI - PMC - PubMed

Grants and funding

This work was supported by institutional funding from CNRS and Université Paris Saclay and by grants from DIM MALINF Région IDF to GV and from the Agence Nationale de la Recherche (ANR) to AE and ML (ANR-14-CE14-0022), and to GB (ANR-20-IDEES-0002). The funders had no role in study design, data collection and analysis, decision to publish, or preparation of the manuscript.