. 2022 Mar 11;375(6585):eabj5861.
doi: 10.1126/science.abj5861. Epub 2022 Mar 11.

Local connectivity and synaptic dynamics in mouse and human neocortex

Luke Campagnola #  1 Stephanie C Seeman #  1 Thomas Chartrand  1 Lisa Kim  1 Alex Hoggarth  1 Clare Gamlin  1 Shinya Ito  1 Jessica Trinh  1 Pasha Davoudian  1 Cristina Radaelli  1 Mean-Hwan Kim  1 Travis Hage  1 Thomas Braun  2 Lauren Alfiler  1 Julia Andrade  1 Phillip Bohn  1 Rachel Dalley  1 Alex Henry  1 Sara Kebede  1 Mukora Alice  1 David Sandman  1 Grace Williams  1 Rachael Larsen  1 Corinne Teeter  1 Tanya L Daigle  1 Kyla Berry  1 Nadia Dotson  1 Rachel Enstrom  1 Melissa Gorham  1 Madie Hupp  1 Samuel Dingman Lee  1 Kiet Ngo  1 Philip R Nicovich  1 Lydia Potekhina  1 Shea Ransford  1 Amanda Gary  1 Jeff Goldy  1 Delissa McMillen  1 Trangthanh Pham  1 Michael Tieu  1 La'Akea Siverts  1 Miranda Walker  1 Colin Farrell  1 Martin Schroedter  1 Cliff Slaughterbeck  1 Charles Cobb  3 Richard Ellenbogen  4 Ryder P Gwinn  5 C Dirk Keene  6 Andrew L Ko  4   7 Jeffrey G Ojemann  4   7 Daniel L Silbergeld  4 Daniel Carey  1 Tamara Casper  1 Kirsten Crichton  1 Michael Clark  1 Nick Dee  1 Lauren Ellingwood  1 Jessica Gloe  1 Matthew Kroll  1 Josef Sulc  1 Herman Tung  1 Katherine Wadhwani  1 Krissy Brouner  1 Tom Egdorf  1 Michelle Maxwell  1 Medea McGraw  1 Christina Alice Pom  1 Augustin Ruiz  1 Jasmine Bomben  1 David Feng  1 Nika Hejazinia  1 Shu Shi  1 Aaron Szafer  1 Wayne Wakeman  1 John Phillips  1 Amy Bernard  1 Luke Esposito  1 Florence D D'Orazi  1 Susan Sunkin  1 Kimberly Smith  1 Bosiljka Tasic  1 Anton Arkhipov  1 Staci Sorensen  1 Ed Lein  1 Christof Koch  1 Gabe Murphy  1 Hongkui Zeng  1 Tim Jarsky  1
Affiliations

Local connectivity and synaptic dynamics in mouse and human neocortex

Luke Campagnola et al. Science. .

Abstract

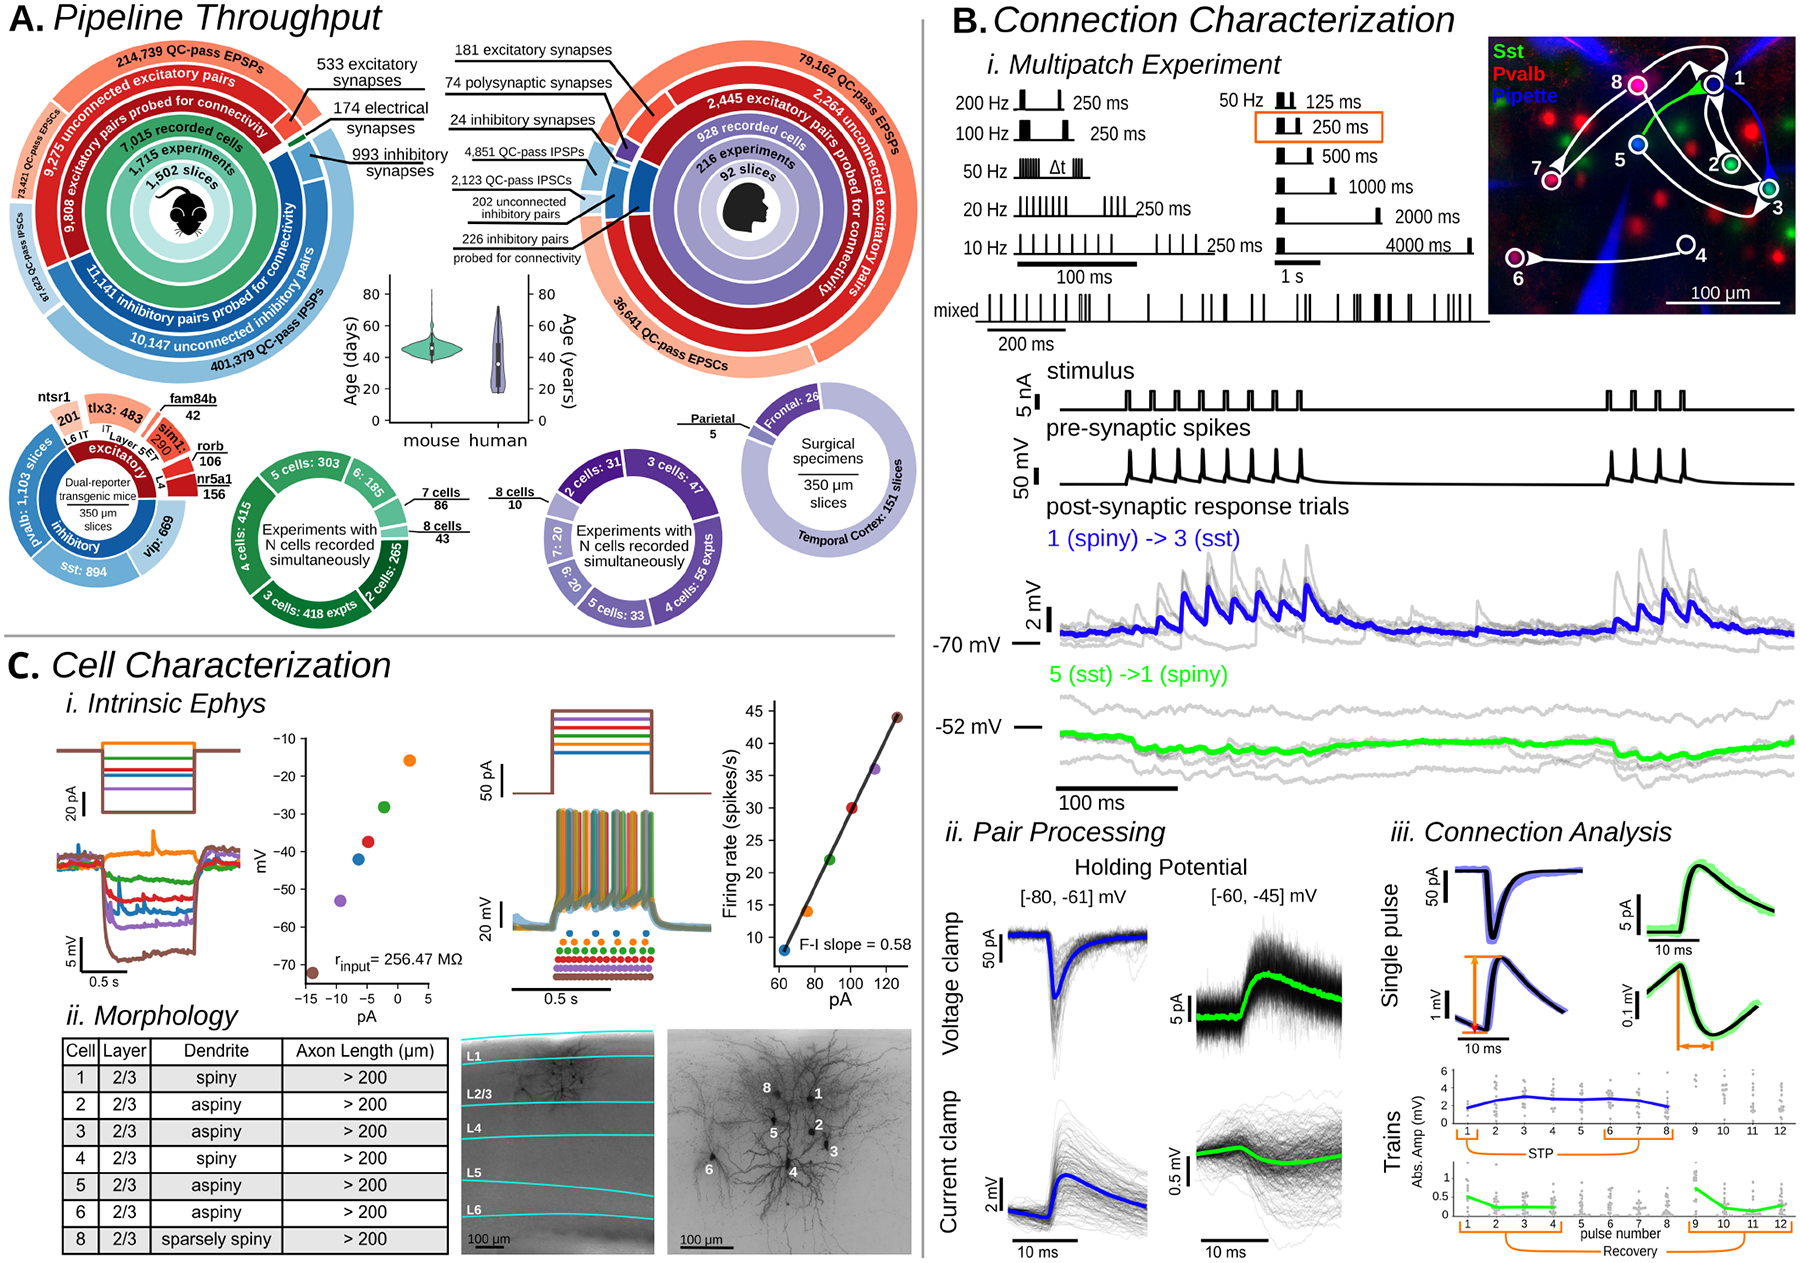
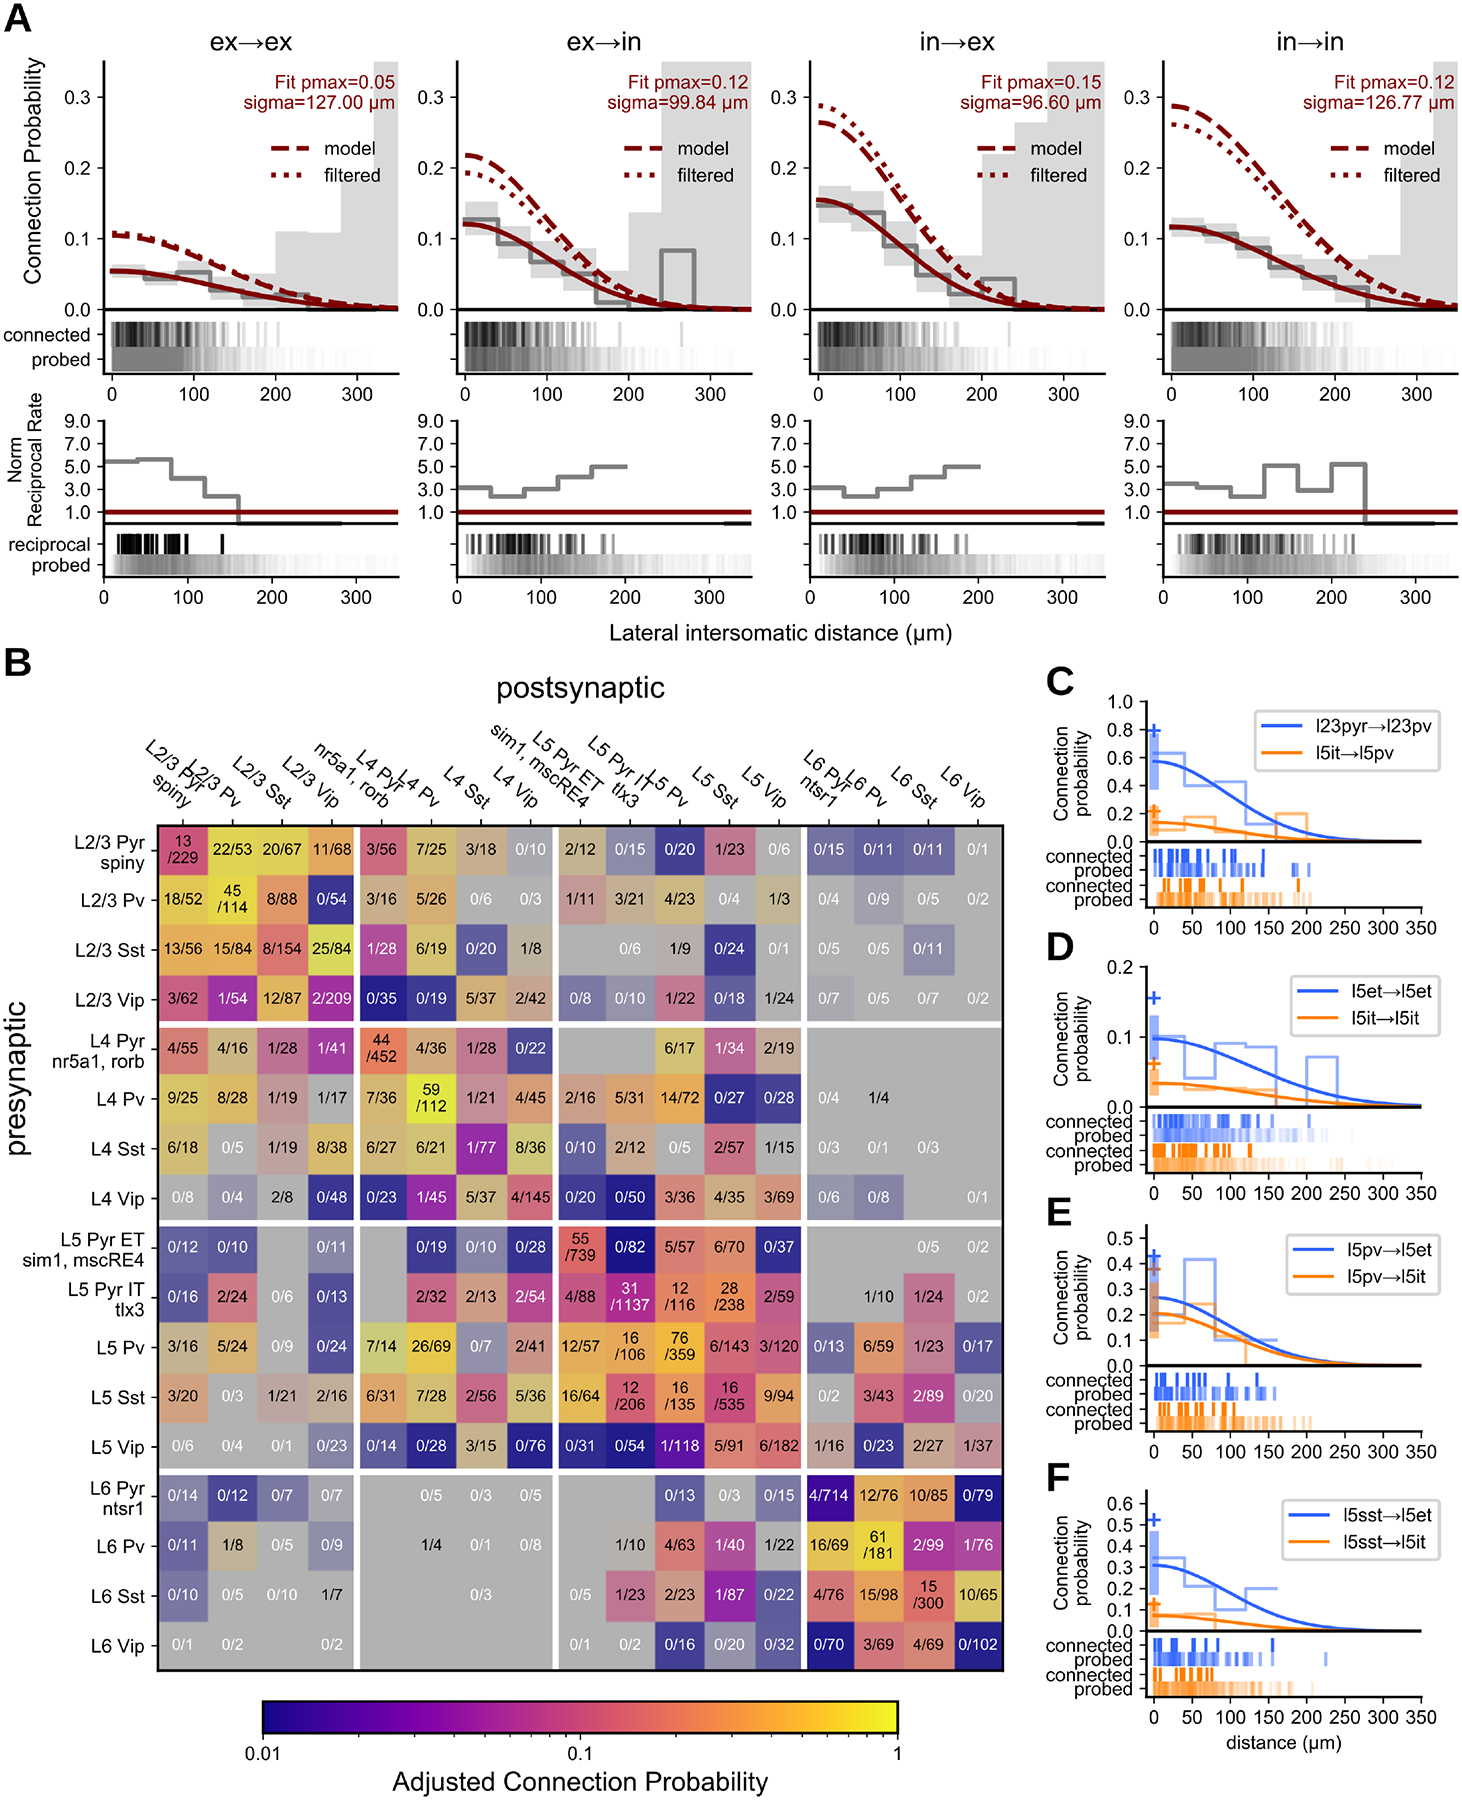
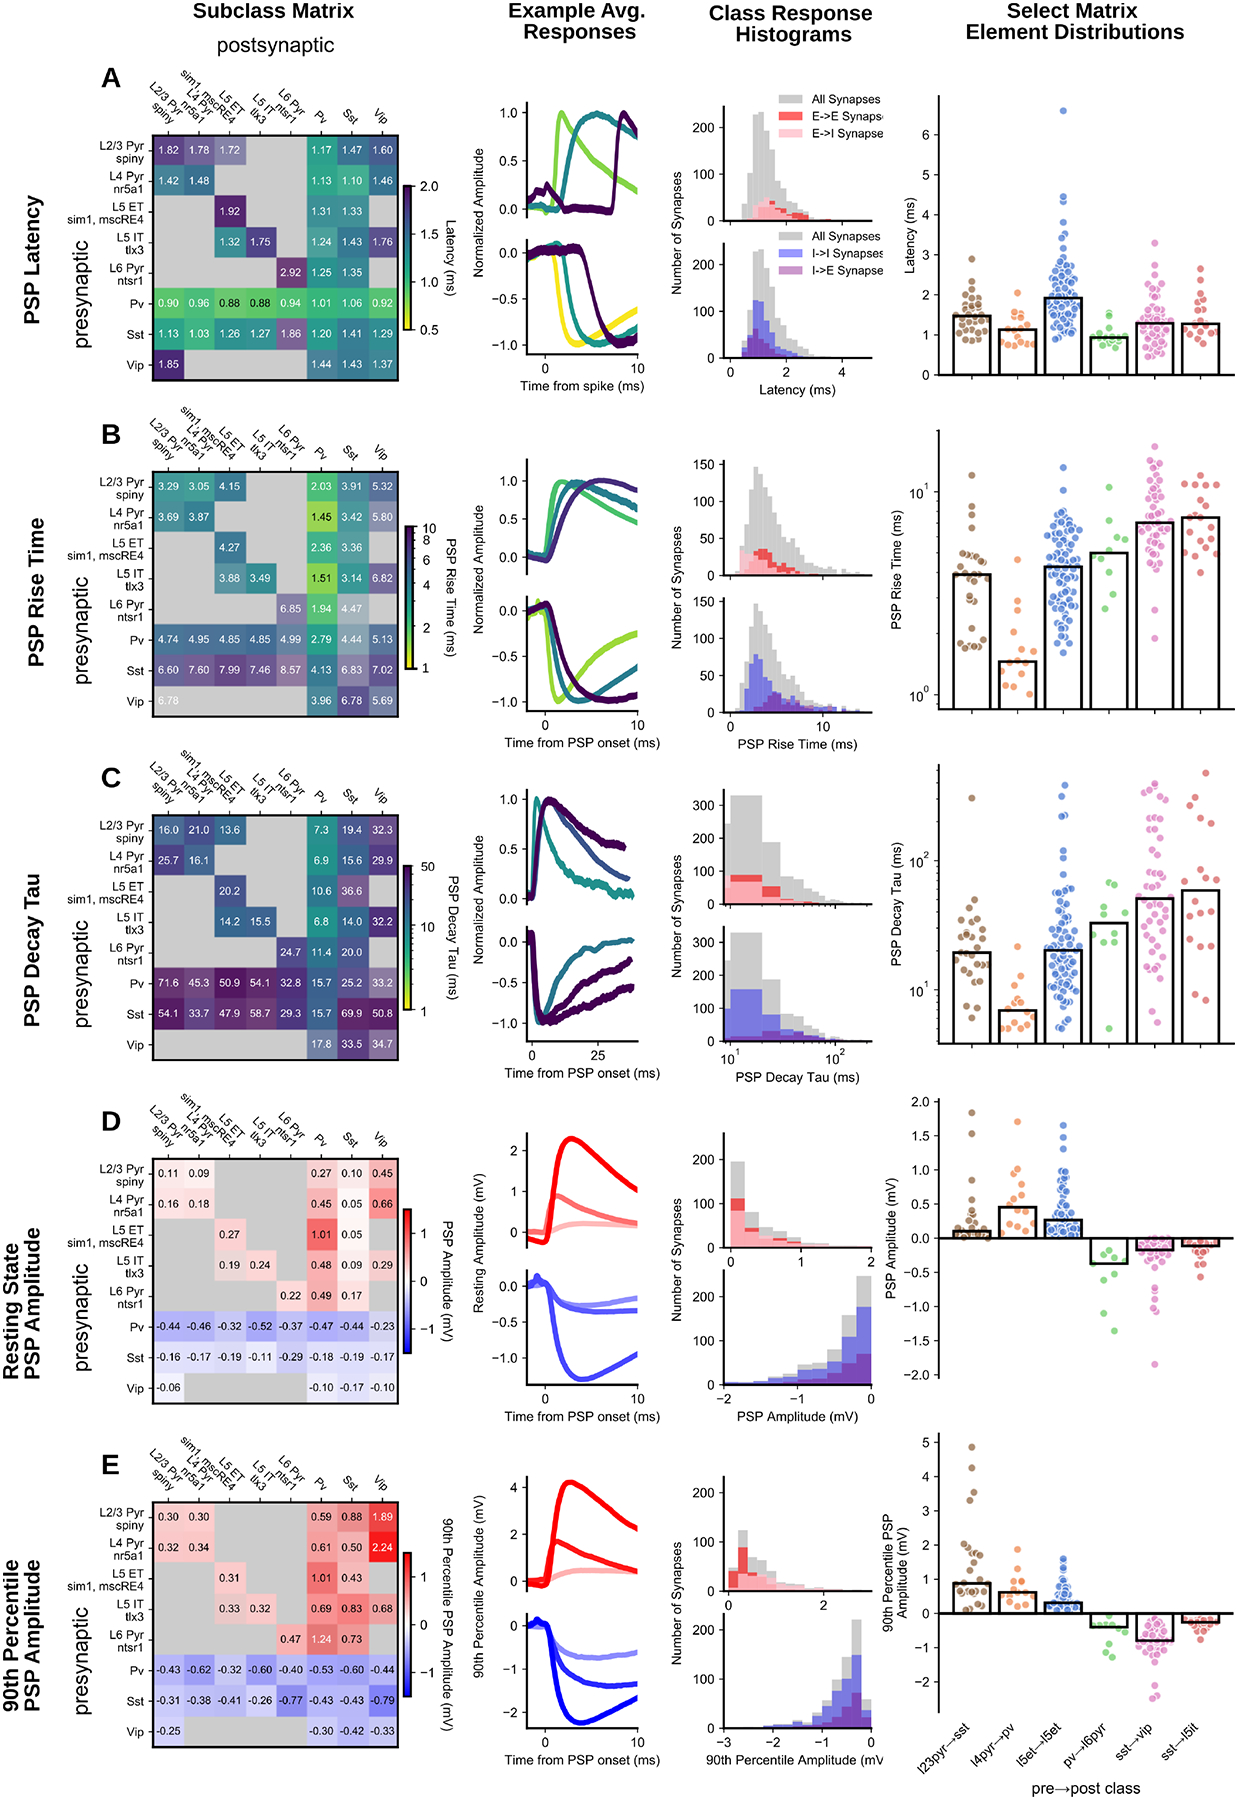
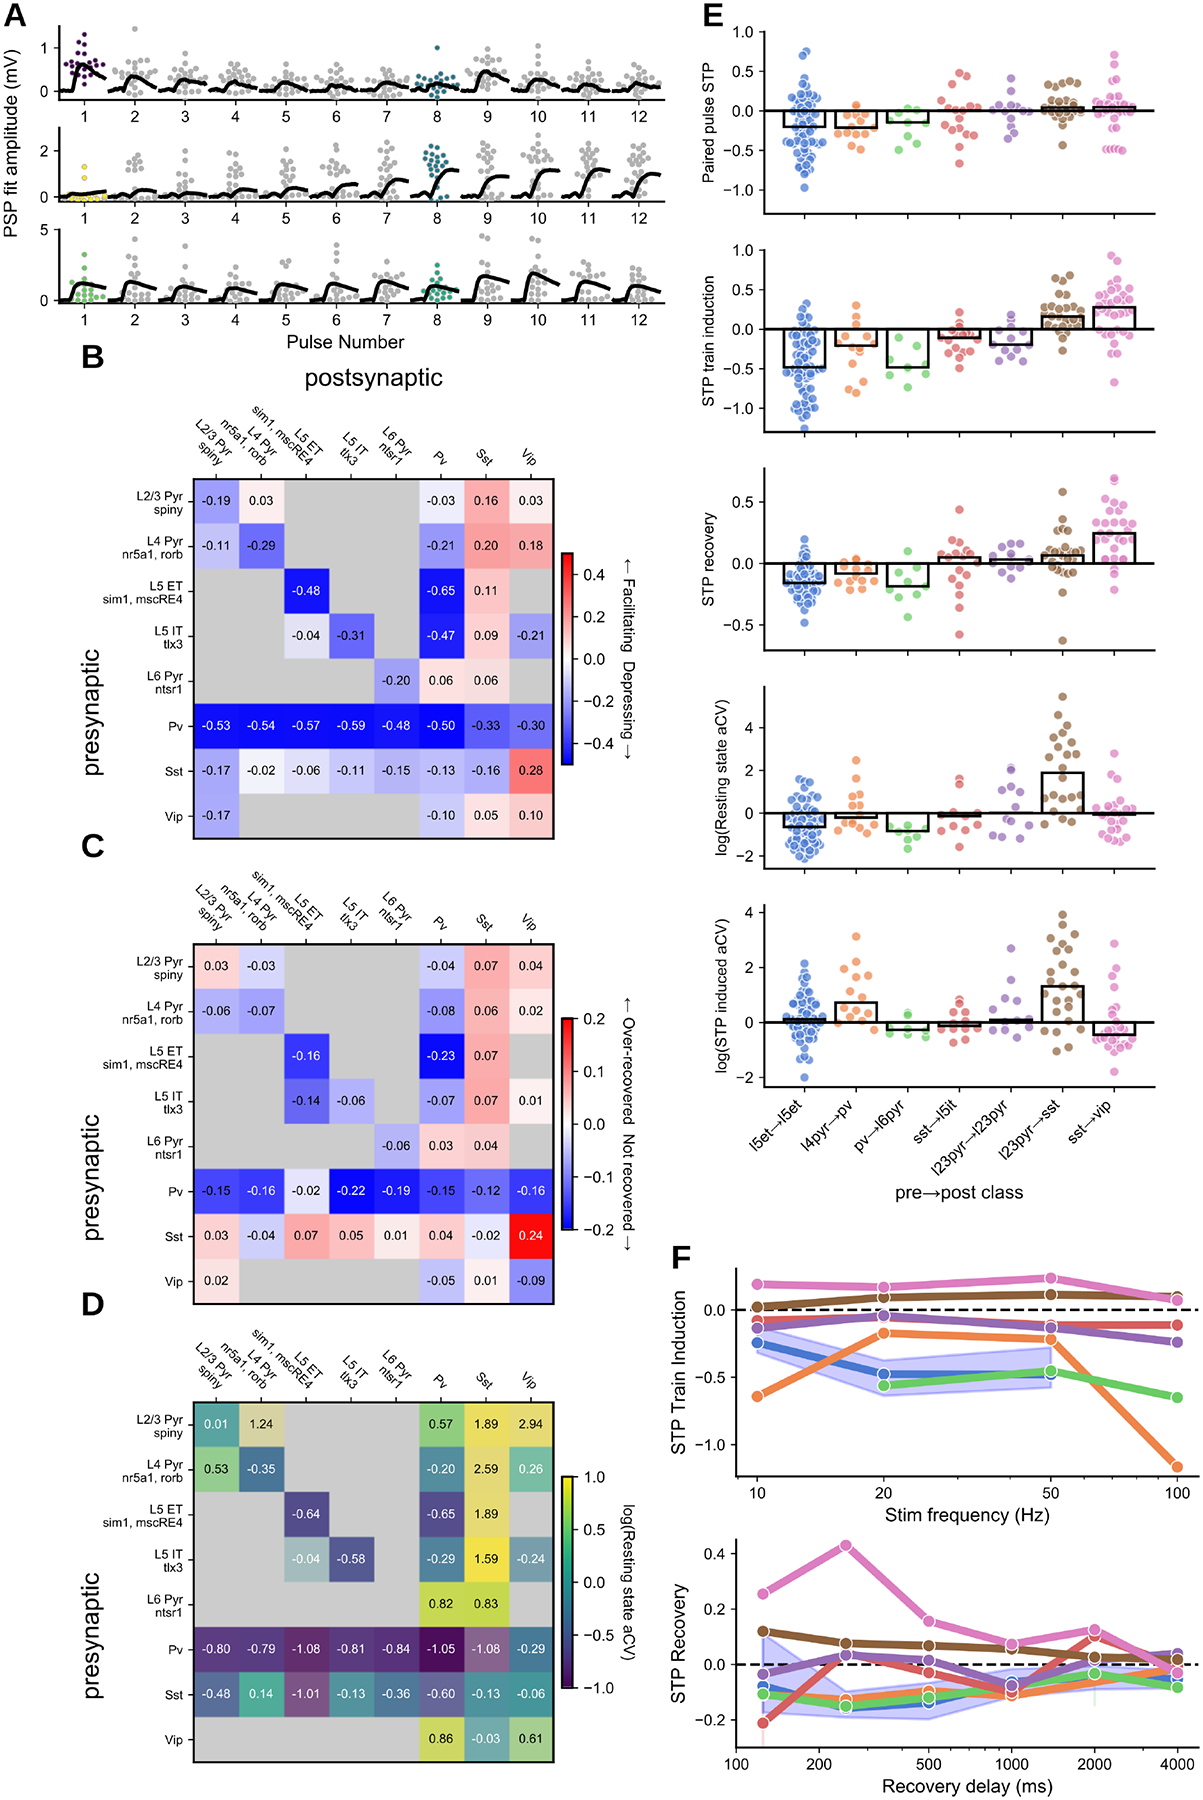
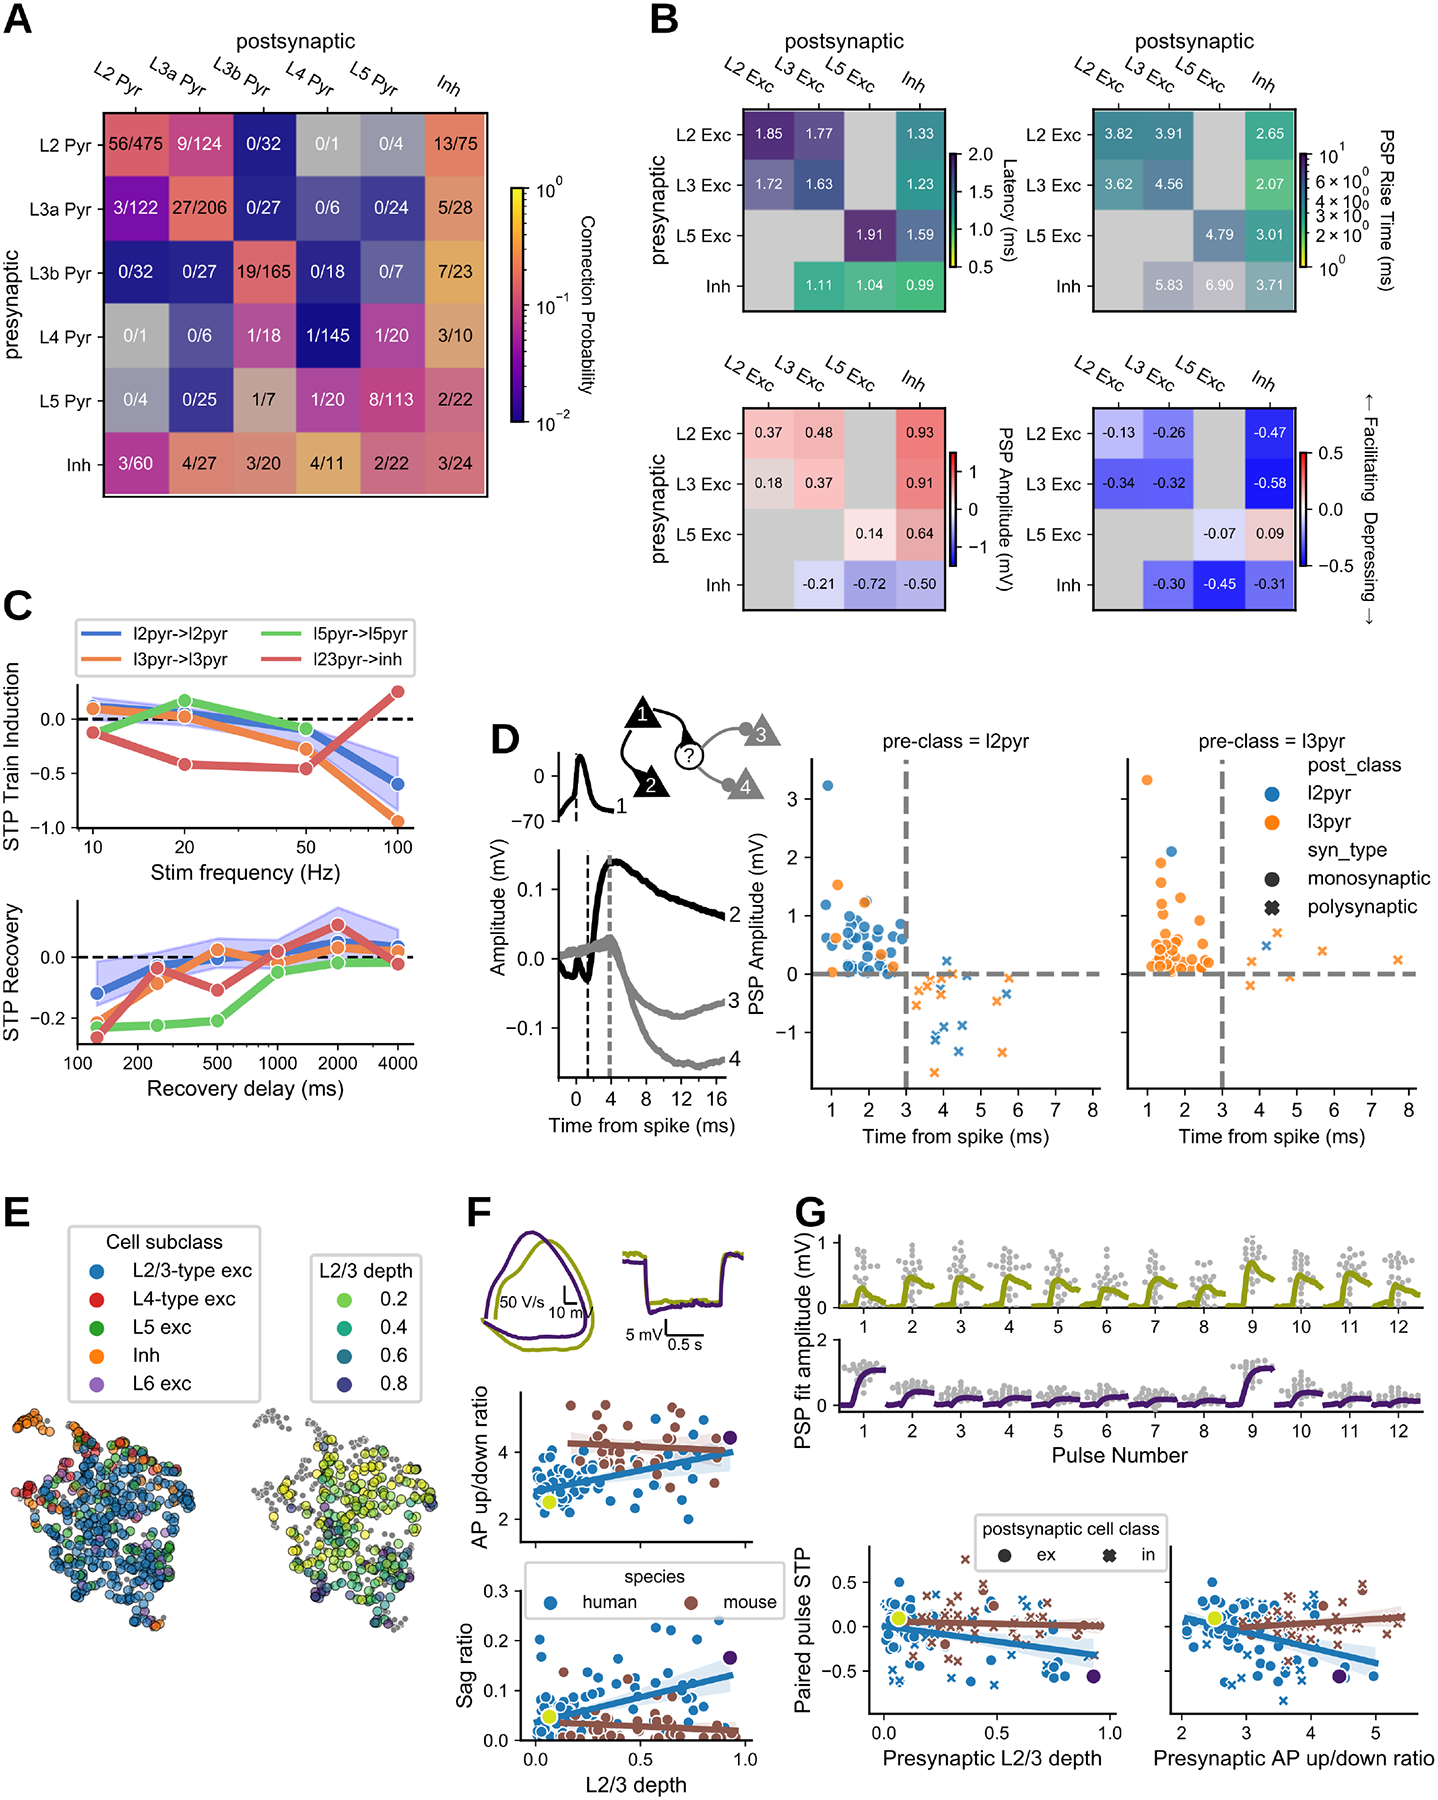
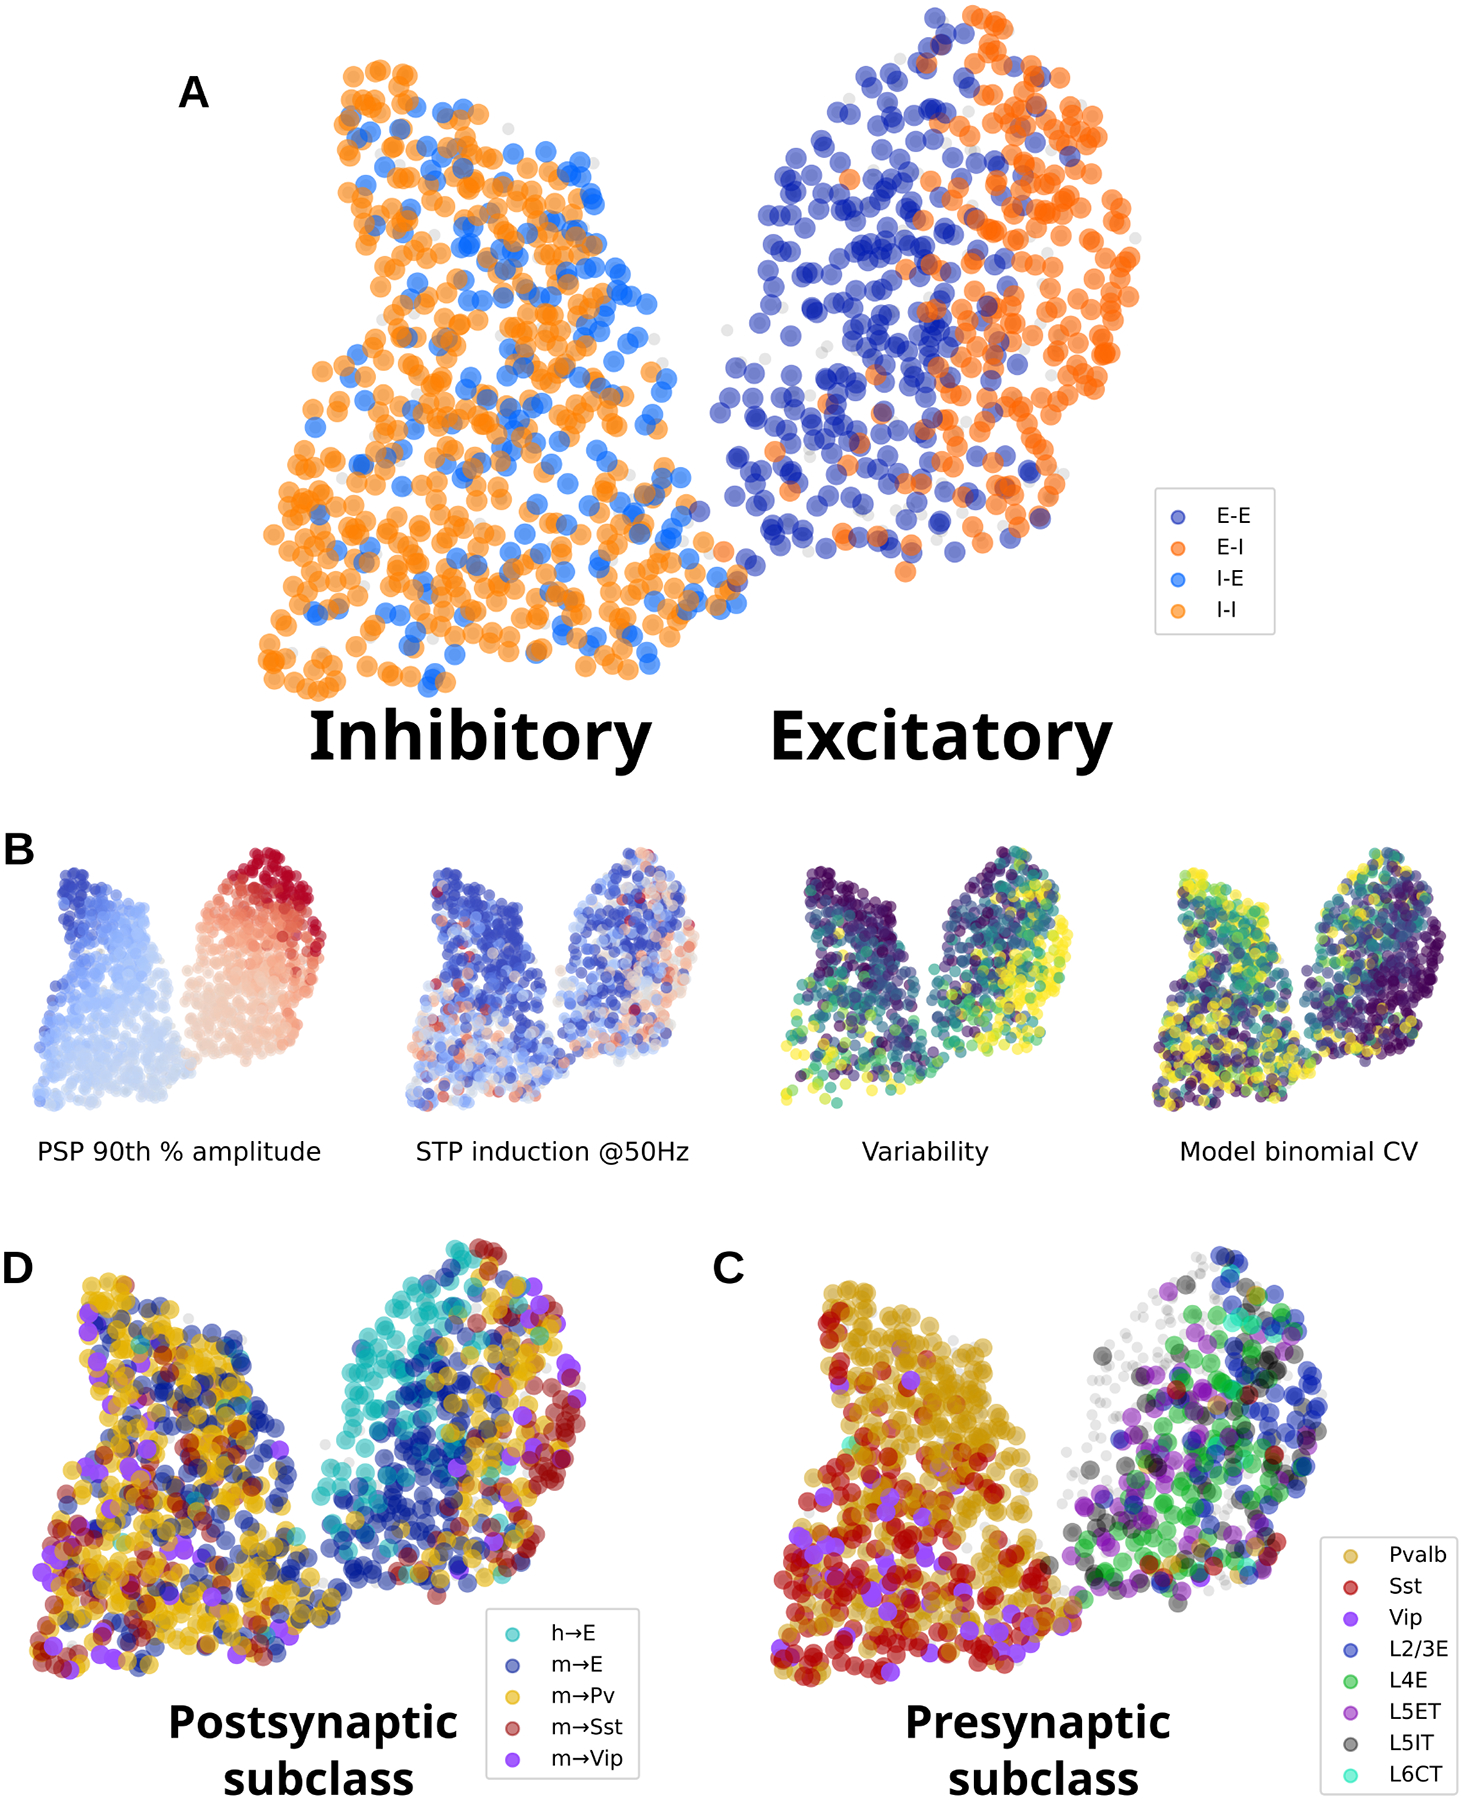
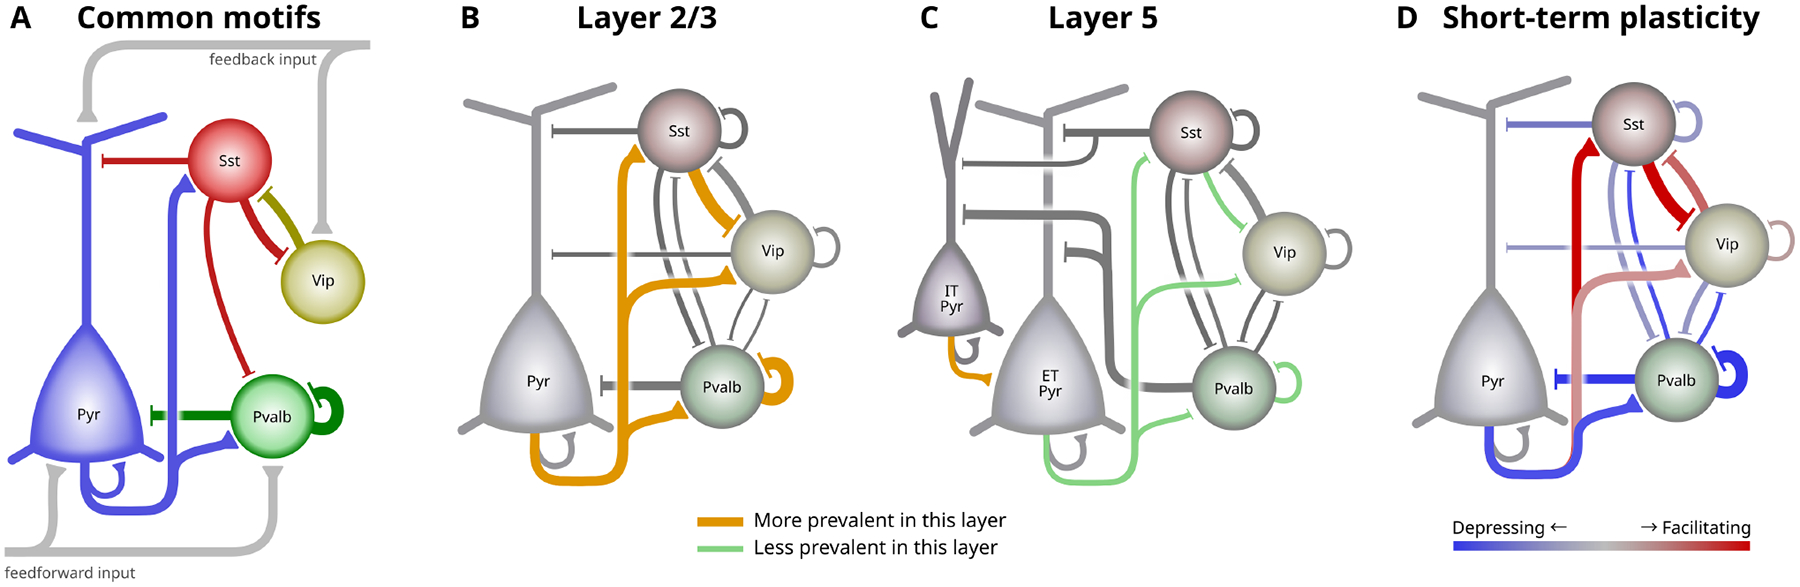
We present a unique, extensive, and open synaptic physiology analysis platform and dataset. Through its application, we reveal principles that relate cell type to synaptic properties and intralaminar circuit organization in the mouse and human cortex. The dynamics of excitatory synapses align with the postsynaptic cell subclass, whereas inhibitory synapse dynamics partly align with presynaptic cell subclass but with considerable overlap. Synaptic properties are heterogeneous in most subclass-to-subclass connections. The two main axes of heterogeneity are strength and variability. Cell subclasses divide along the variability axis, whereas the strength axis accounts for substantial heterogeneity within the subclass. In the human cortex, excitatory-to-excitatory synaptic dynamics are distinct from those in the mouse cortex and vary with depth across layers 2 and 3.


Conflict of interest statement

Competing interests: Authors declare that they have no competing interests.

Figures

Fig. 1.
Fig. 1.. Synaptic Physiology Pipeline:
A. Pipeline throughput summary. Large circles: data collection statistics (mouse primary visual cortex;left, human;right). Age distribution for each species (center). Distributions of recorded cells (bottom, outer circles). Experiment count with 2 through 8 simultaneously recorded cells (bottom, inner circles) B. i.Multipatch Experiment: Stimuli sets used to probe connectivity and dynamics (top). Fluorescent image (right) shows recorded cells with connectivity diagram overlaid. Example electrophysiology recordings of cells 1, 3, and 5 during the 50 Hz stimulus (orange box). ii.Pair Processing: For each recorded pair presynaptic-spike aligned postsynaptic responses (black traces) were overlaid and averaged (colored trace corresponding to the same connection in Multipatch Experiment panel) in both voltage clamp (top row) and current clamp (bottom row). From this a connection could be identified. iii Connection Analysis: When a connection was identified the average (colored) was fit (black) and metrics such as amplitude and rise time (orange lines) were extracted from the fit. Short term plasticity (STP) was quantified as a ratio from fits of individual PSPs. C. i Intrinsic Ephys: Long pulse steps were applied to quantify intrinsic cell properties, and electrical connections (Figure S4). Hyperpolarizing steps (left) delivered to an example cell probed the subthreshold I-V relationship to quantify metrics such as input resistance while depolarizing suprathreshold sweeps (right) were used to measure spiking and firing rate properties. ii Morphology: Cells were filled with biocytin during recording and stained. 20x images of the full slice stained with DAPI allowed identification of the cortical layers and 63x z-stack images were used to assess morphological properties such as dendritic type and axon length. Images and cells here are the same as in (B).
Fig. 2.
Fig. 2.. Mouse Connectivity:
A. Cells were divided into two main classes, excitatory and inhibitory, and pairs classified into the four combinations of those two classes. Top row: Connection probability as a function of intersomatic distance fit with a Gaussian (red line) and output parameters pmax and sigma (σ) describe the max connection probability and width of the Gaussian. Connection probability as a function of intersomatic distance adjusted for presynaptic axon length, depth of the pair from the slice surface, and detection power of connections using a unified model (dashed red line) or via filtering of the data (dotted red line) (see Results/Methods). Grey line and area are 40 μm binned average connection probability and 95% confidence interval. Raster below shows distance distribution of connections probed (bottom) and found (top). Bottom row: Normalized rate of reciprocal connections. Probed pairs are unordered and the number of reciprocal connections counted was normalized to the expected value of connection probability squared for a randomly connected network (solid red line). B. Connection probability matrix for mouse. Connection probability is estimated using a unified model accounting for all corrections as determined from A (dashed red line, “model”). The shading of each element indicates the 95% CI of the data with higher contrast indicating smaller CI and lower contrast (toward grey) indicating larger CI. The number of connections found out of the number of connections probed are printed in each element. C-E. Gaussian fit of connection probability vs intersomatic distance (with CI at pmax, shaded region) for two contrasting elements with connections found and connections probed raster below. Cross symbol denotes pmax with all adjustments.
Fig 3.
Fig 3.. Synaptic strength and kinetics:
(left to right) E-I subclass matrix; excitatory and inhibitory minimum, median, and maximum average traces (light to dark colors); histograms for the major connection classes (E→E, E→I, I→I, I→E); summary scatter plots for a subset of matrix elements for each metric PSP latency (A), PSP rise time (B), PSP decay tau (C), PSP resting state amplitude (D), and PSP 90th percentile amplitude (E). In all matrices, inhibitory cells are merged across layers. All matrices are colorized by the median (text in each element) with the saturation scaled by the standard error. Two or more pairs were required to fill in an element.
Fig 4.
Fig 4.. Synaptic dynamics:
A. Depressing, facilitating, and pseudo-linear excitatory connections (top to bottom) in 50 Hz train; grey/colored dots: individual PSP amplitudes; black traces: average PSP per pulse. Scatter points for pulse 1 (resting state aCV) and pulse 8 (STP induced aCV) are colored according to the color scale in D. B. Short-term plasticity matrix. C. Recovery (at 250ms) matrix. D. Resting state variance (adjusted coefficient of variation) matrix. All matrices are colorized by the median (text in each element) with the saturation scaled by the standard error. E. Summary plots for paired pulse ratio, STP induction ratio (avg 1st pulse amp : avg of 6th-8th pulse amp) normalized by the 90th percentile, Resting state variance, induced state variance (top to bottom). Each dot corresponds to the average response from one connection. F. Train induced STP (top) at four different frequencies (10, 20, 50, 100 Hz) for each of the elements in E (colors maintained). Each dot is the grand average of all connections in the element. For L5 ET→L5 ET the blue shading highlights the 95% confidence interval as an example. Lower plot shows recovery from STP at six different delays (125, 250, 500, 1000, 2000, 4000 ms) in a similar manner to the plot above.
Fig 5.
Fig 5.. Human:
A. Connection probability measured from human cortical tissue. Inhibitory cells are identified by morphology as aspiny or sparsely spiny cells, grouped across layer. B. Kinetics, strength, and dynamics matrices are organized by layer for excitatory cells, with inhibitory cells grouped across layer. Each element is colorized by the median (text in each element) with the saturation scaled to the standard error. Two or more pairs were required to fill in an element. Latency, rise tau, and resting state amplitude are quantified from fits of the average PSP response. C.Train induced STP (top) across frequencies for a subset of connection types. Each dot is the median of all connections in the element, with shading for the 95% CI (bootstrapped) shown for a single example connection type. Recovery from STP at different delays (lower plot). D. Example polysynaptic circuit from one experiment in which cell 1 forms a short latency (~2ms) monosynaptic excitatory connection to cell 2 and delayed (~4 ms) polysynaptic inhibitory connections to cells 3 and 4 (all cells confirmed morphologically spiny). Dashed lines indicate (from left to right) time of presynaptic spike and PSP onset. Polysynaptic connections from L2/3 pyramidal cells inferred by response latency > 3 ms vs PSP amplitude. E. Structure of intrinsic electrophysiology feature space. UMAP projection colored by cell subclass (left) and by depth of L2/3-type excitatory cells (right). F. Variation in L2/3 intrinsic properties is strongly correlated with depth in human but not mouse. Example traces show superficial and deep human cells (top, colors as in D): phase plane representation of the first spike in a depolarizing step response (left), sag in response to hyperpolarization (right). Bottom: regression of corresponding electrophysiology features vs. depth by species, with bootstrapped 95% CI. G. STP of L2/3 excitatory connections is structured by depth in human and not mouse. Top: PSP responses to spike trains for example cells from E. The larger response to the first spike is quantified by paired pulse STP, plotted below in relation to presynaptic depth (left) and AP up/down ratio (right) (postsynaptic relationships shown in Fig. S5E).
Fig 6.
Fig 6.. Dimensionality reduction on connection properties:
Relationships among connection properties and cell types revealed by dimensionality reduction. A. All connections colored by postsynaptic E/I cell class. The UMAP output generates two clusters: inhibitory (left) and excitatory (right). B. Four connection properties represented in reduced space, showing 90th percentile PSP amplitude (red=excitatory, blue=inhibitory); STP induced by 50 Hz trains (red=facilitating, blue=depressing), resting state aCV during 50 Hz trains (purple=low variability, yellow=high variability), and the binomial CV derived from model parameters (release probability * number of release sites; purple=high CV, yellow=low CV). C. Human and mouse connections colored by postsynaptic subclass. D. Mouse connections colored by presynaptic subclass.
Fig 7.
Fig 7.. Intralaminar circuit diagram:
The cortical intralayer circuit differs across layer and with activity. A. Some commonly described elements of the intralaminar cortical circuit. Pvalb cells strongly inhibit pyramidal and other Pvalb cells, Sst cells provide broad inhibition, and Vip cells inhibit Sst cells to form a disinhibitory feedback pathway. B-C. Circuit diagrams showing connections between major subclasses in mouse L2/3 (B) and L5 (C). The width of connecting lines roughly represents connection probability and PSP amplitude. Connections that are prominent in each layer compared to the other are highlighted in orange, whereas green lines indicate connections that are less prevalent in that layer. For simplicity, connections between IT pyramidal and inhibitory in L5 (C) are omitted. D. Two complementary circuits that activate at different times. Red connections are facilitating and will be stronger during sustained activity. Blue connections are depressing and are strongest during quiescent periods.

Similar articles

Cited by

References

    1. Thomson AM, Bannister AP, Interlaminar Connections in the Neocortex. Cereb Cortex. 13, 5–14 (2003). - PubMed
    1. Markram H, Toledo-Rodriguez M, Wang Y, Gupta A, Silberberg G, Wu C, Interneurons of the neocortical inhibitory system. Nat Rev Neurosci. 5, 793–807 (2004). - PubMed
    1. Douglas RJ, Martin KAC, Neuronal circuits of the neocortex. Neuroscience. 27, 419–451 (2004). - PubMed
    1. Pfeffer CK, Xue M, He M, Huang ZJ, Scanziani M, Inhibition of inhibition in visual cortex: the logic of connections between molecularly distinct interneurons. Nature Neuroscience. 16, 1068–1076 (2013). - PMC - PubMed
    1. Harris KD, Shepherd GMG, The neocortical circuit: themes and variations. Nat Neurosci. 18, 170–181 (2015). - PMC - PubMed

Publication types

MeSH terms