. 2022 Feb 25;11(5):802.
doi: 10.3390/cells11050802.

Impaired p53-Mediated DNA Damage Response Contributes to Microcephaly in Nijmegen Breakage Syndrome Patient-Derived Cerebral Organoids

Affiliations

Impaired p53-Mediated DNA Damage Response Contributes to Microcephaly in Nijmegen Breakage Syndrome Patient-Derived Cerebral Organoids

Soraia Martins et al. Cells. .

Abstract

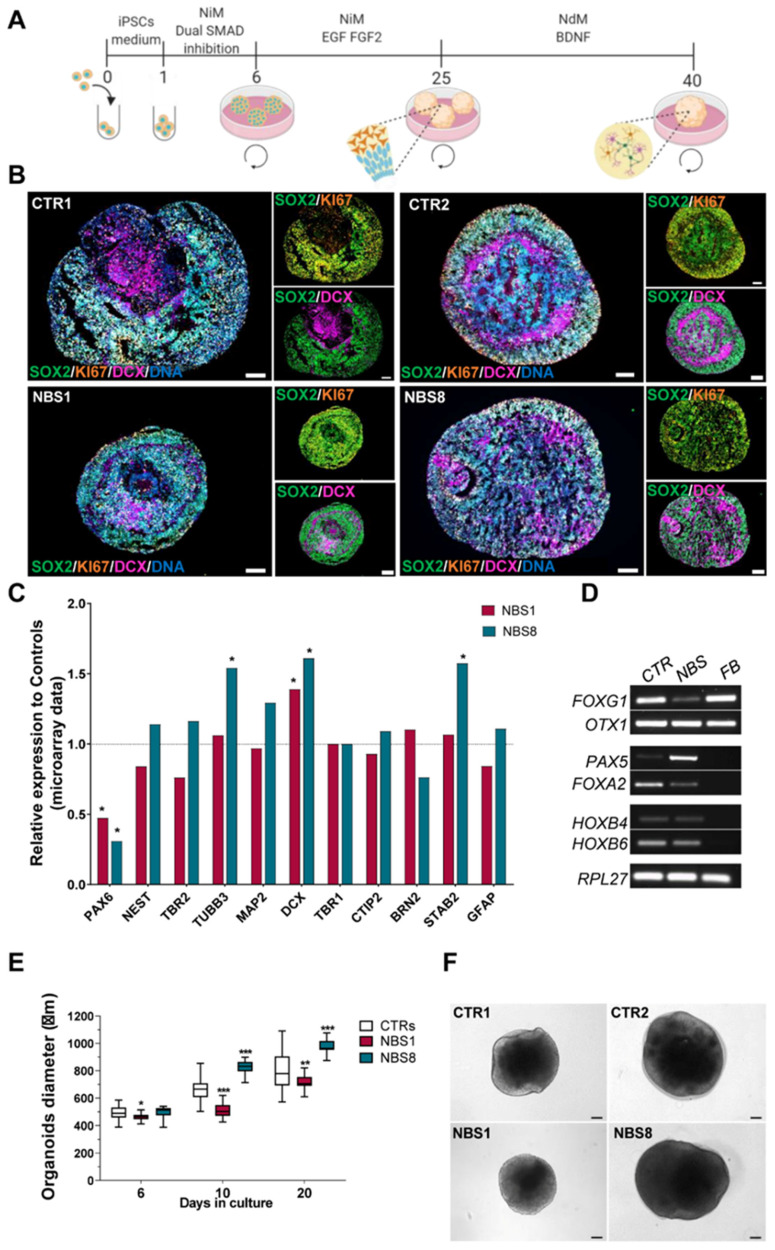
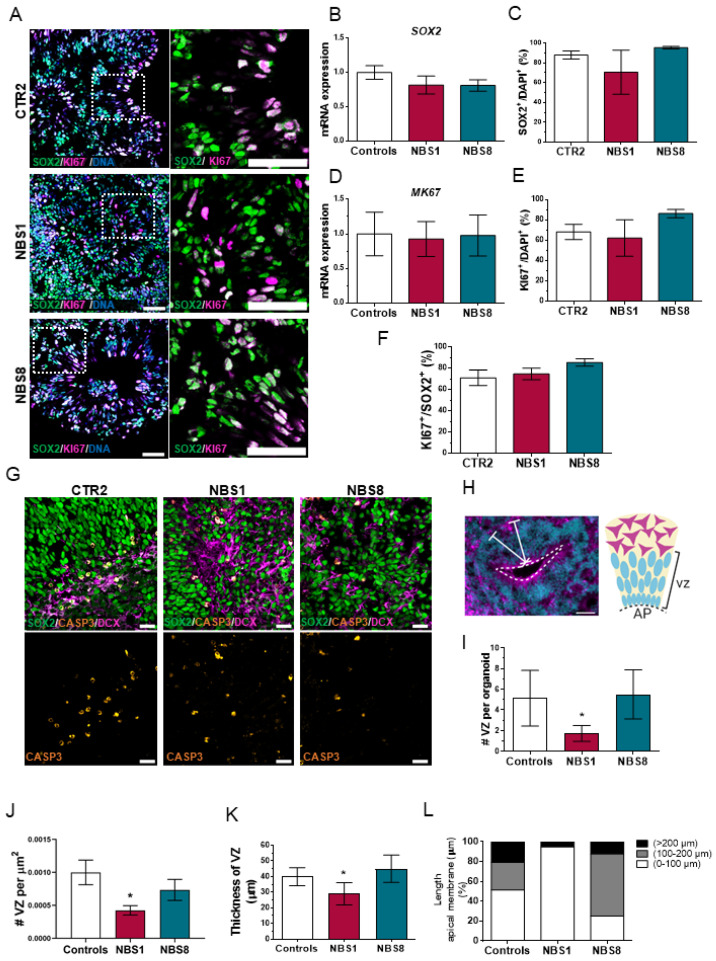
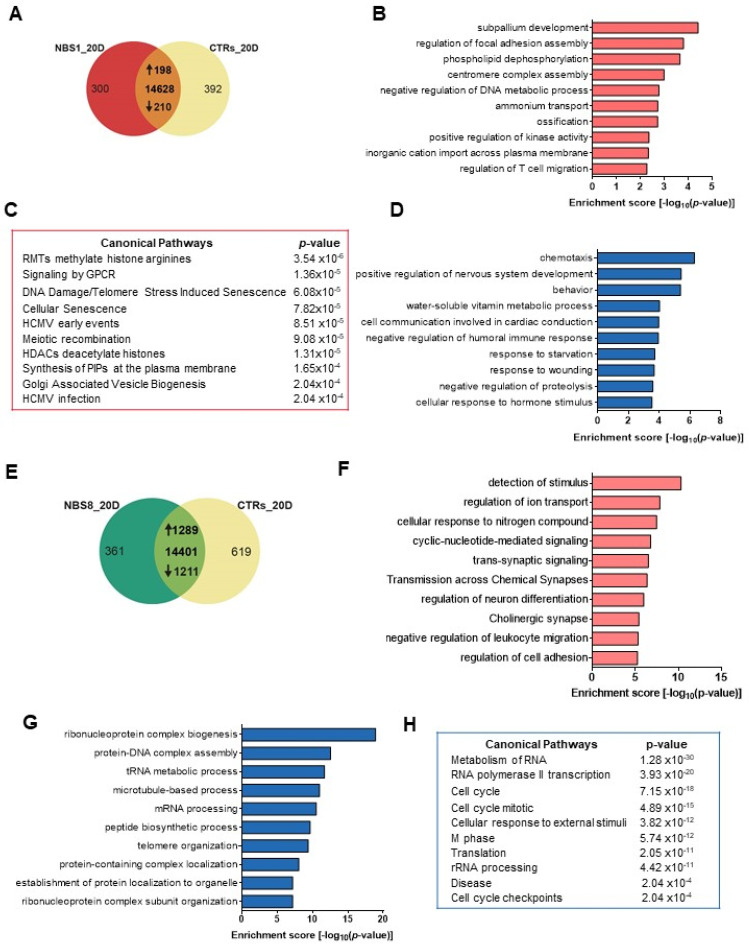
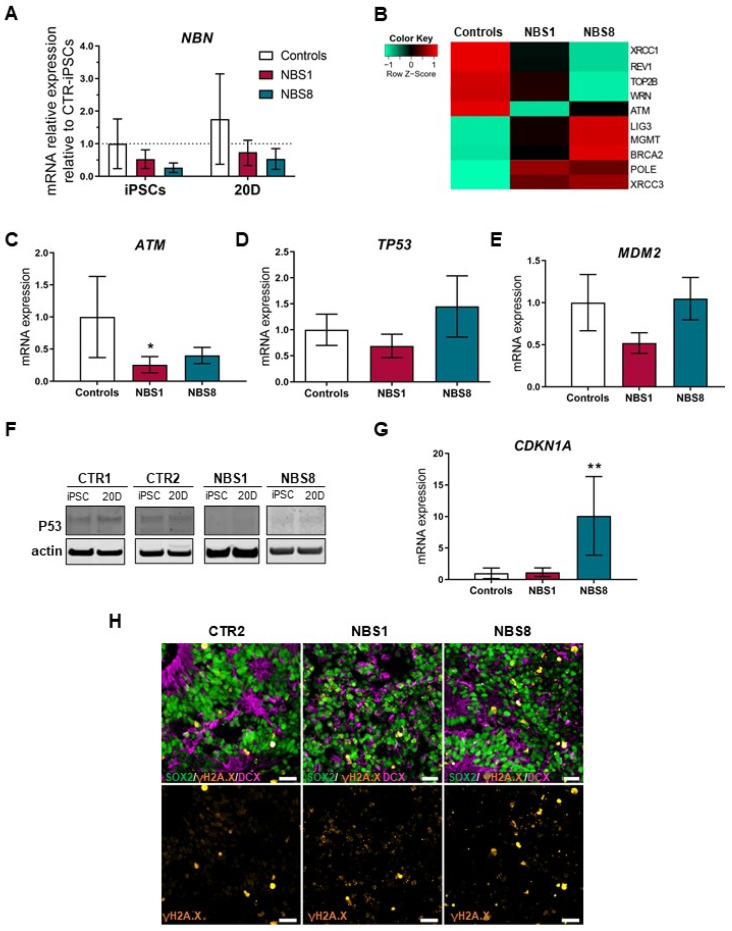
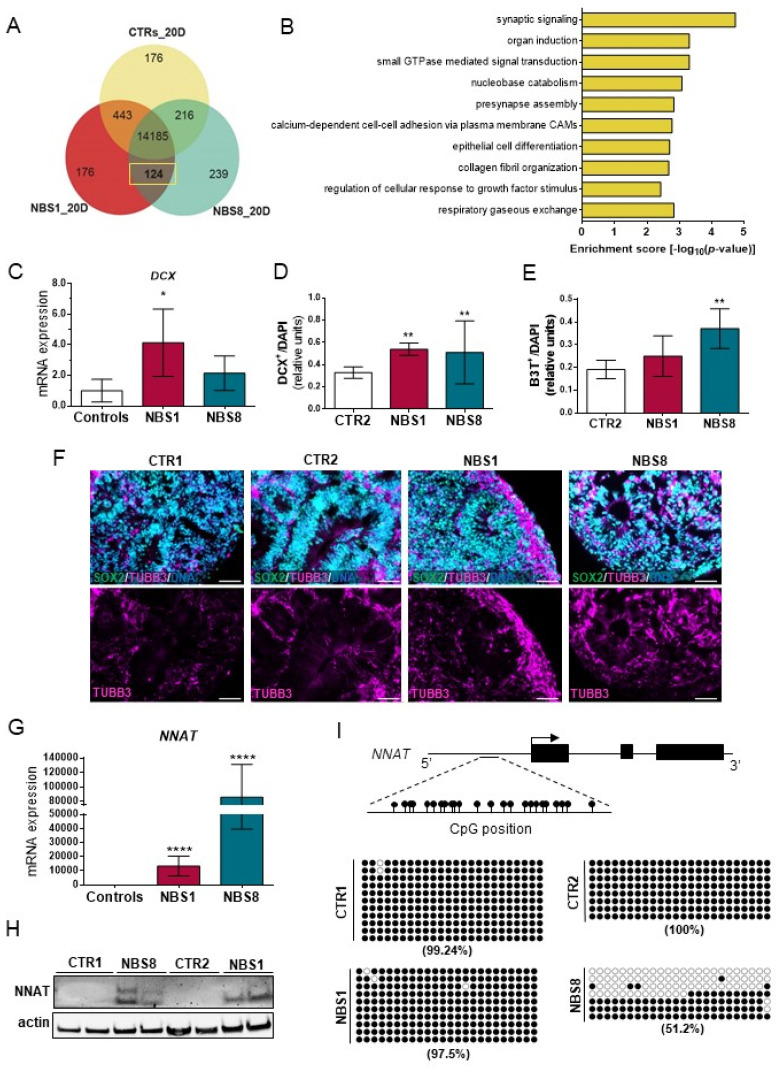
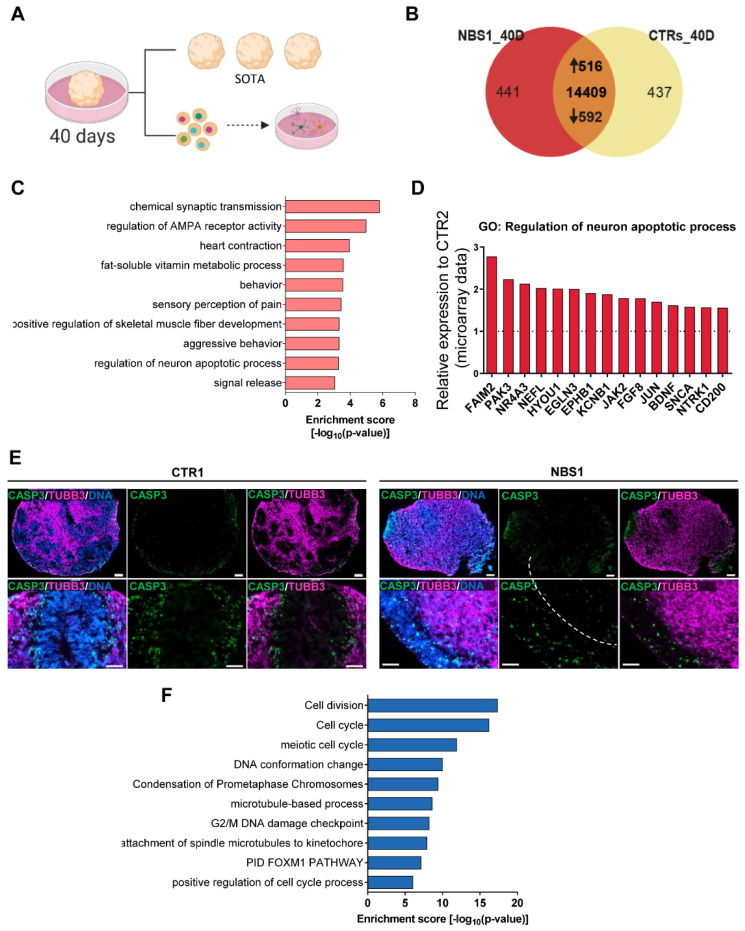
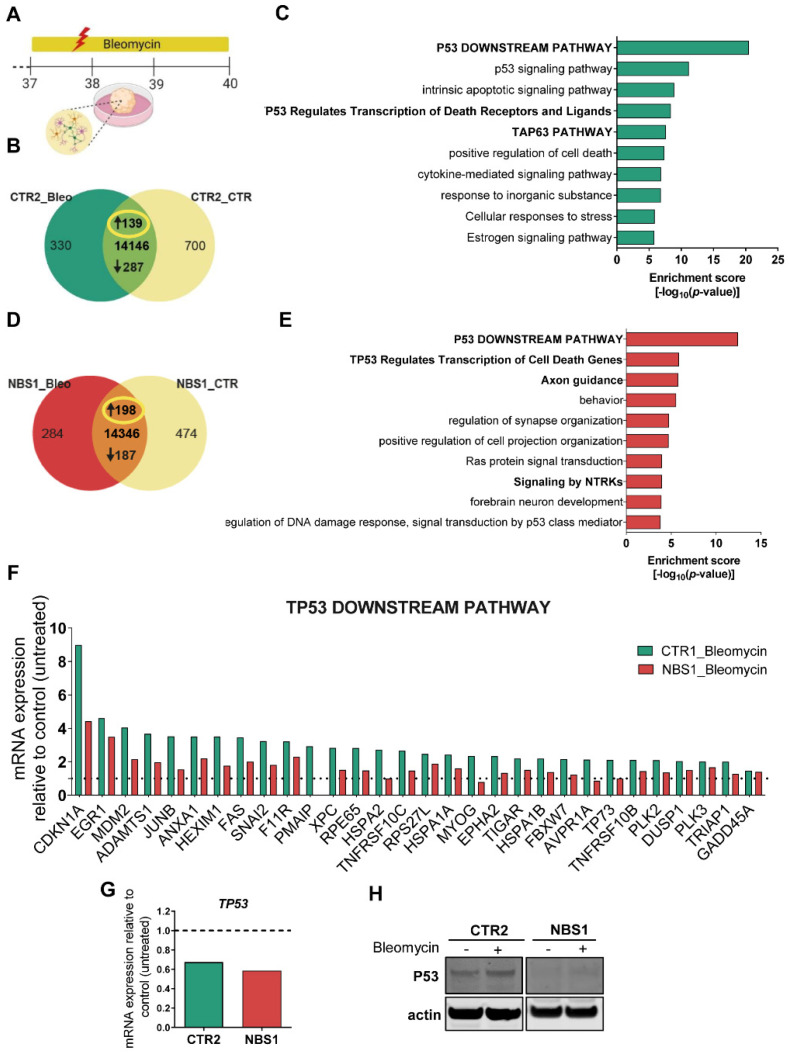
Nijmegen Breakage Syndrome (NBS) is a rare autosomal recessive genetic disorder caused by mutations within nibrin (NBN), a DNA damage repair protein. Hallmarks of NBS include chromosomal instability and clinical manifestations such as growth retardation, immunodeficiency, and progressive microcephaly. We employed induced pluripotent stem cell-derived cerebral organoids from two NBS patients to study the etiology of microcephaly. We show that NBS organoids carrying the homozygous 657del5 NBN mutation are significantly smaller with disrupted cyto-architecture. The organoids exhibit premature differentiation, and Neuronatin (NNAT) over-expression. Furthermore, pathways related to DNA damage response and cell cycle are differentially regulated compared to controls. After exposure to bleomycin, NBS organoids undergo delayed p53-mediated DNA damage response and aberrant trans-synaptic signaling, which ultimately leads to neuronal apoptosis. Our data provide insights into how mutations within NBN alters neurogenesis in NBS patients, thus providing a proof of concept that cerebral organoids are a valuable tool for studying DNA damage-related disorders.

Keywords: NBS; Neuronatin; cerebral organoids; disease modeling; iPSCs; microcephaly; p53.


Conflict of interest statement

The authors declare no conflict of interest.

Figures

Figure 1
Figure 1
Generation and characterization of NBS cerebral organoids. (A) Schematic outline of the main stages of the differentiation protocol to generate the iPSC-derived cerebral organoids. (B) Representative immunocytochemistry images of the distribution of cells expressing SOX2, KI67 and DCX in cerebral organoids at day 20. Scale bars, 100 µm. (C) Relative mRNA expression analysis of progenitor markers (PAX6, NES and TBR2), pan-neuronal makers (TUBB3, MAP2, DCX), early born neurons (TRB1, CTIP2), late-born neurons (BRN2 and STAB2) and the astrocytes marker GFAP in NBS organoids (NBS1 and NBS8) compared to control organoids (CTR1 and CTR2). (D) RT-PCR analysis for brain region specificity at day 20 in control and NBS organoids (forebrain: FOXG and OTX1; midbrain: PAX5 and FOXA2 and hindbrain: HOXB4 and HOXB6). FB, fetal brain control. (E) Comparison of the diameter of control, NBS1 and NBS8 cerebral organoids at day 6, 10 and 20. n = 76 at day 6, n = 61 at day 10 and n = 55 at day 20 for both CTR1 and CTR2; n = 15 at day 6, n = 22 at day 10 and n = 18 at day 20 for NBS1 and n = 36 at day 6, n = 35 at day 10 and n = 33 at day 20 for NBS8 cerebral organoids from two independent differentiations. The diameter was significantly smaller in NBS1 organoids. Significance in comparison to control (CTR1 and CTR2) was calculated with one-way ANOVA followed by Dunnett’s multiple comparison test; * p < 0.05, ** p < 0.01, *** p < 0.001. (F) Representative bright-field images of control and NBS cerebral organoids at day 20. NBS1 organoids visually lack neuroepithelial structures. Scale bars, 100 µm.
Figure 2
Figure 2
Analysis of proliferation of the NPCs and VZs cytoarchitecture at day 20. (A) Representative confocal pictures of immunostainings for SOX2 and KI67 in CTR2, NBS1 and NBS8 organoids. Scale bars, 50 µm. (B) qRT—PCR analysis of SOX2 mRNA expression in NBS1 and NBS8 organoids relative to control organoids. (C) Quantification of the SOX2-positive cells in CTR2 and NBS1 and NBS8 organoids. (D) qRT—PCR analysis of KI57 mRNA expression in NBS1 and NBS8 organoids relative to control organoids (CTR1 and CTR2). (E) Quantification of the KI67-positive cells in CTR2 and NBS1 and NBS8 organoids. (F) Quantification of the KI67-positive cells within the SOX2-positive cells in CTR2, NBS1 and NBS8 organoids. (G) Representative confocal pictures of immunostainings for SOX2, cleaved-CASP3 and DCX in CTR2, NBS1 and NBS8 organoids. Cleaved-CASP3 colocalized with the DCX positive cells. Scale bars, 50 µm. (H) Schematic illustration of a ventricular zone (VZ). (I,J) Quantification of the number of the VZs (I) per organoid and (J) per area (µm2) in control (CTR1 and CTR2) and NBS1 and NBS8 organoids. (K) Quantification of the thickness of the VZs in µm in control (CTR1 and CTR2) and NBS1 and NBS8 organoids. (L) Quantification of the length of the apical membrane per VZ in control, NBS1 and NBS8 organoids; 3 organoids from three independent differentiations were analyzed. (B,D) Results are mean ± 95% confidence interval derived from three independent differentiations. (CF,I,J) Results are mean ± SD derived from three organoids from three independent differentiations. Significance in comparison to control was calculated with one-way ANOVA followed by Dunnett´s multiple comparison test. * p < 0.05.
Figure 3
Figure 3
Global transcriptome functional analysis of control and NBS organoids at day 20. (A) Venn diagram showing genes expressed only in NBS1 organoids (300), in control organoids (392) and common to both (12,828) (detection p value < 0.05). (B,C) Enrichment clustered GOs (B) and canonical pathways enrichment analysis (D) of the of the significantly up-regulated 198 genes in NBS1 organoids compared to control organoids (Top 10 ranked). (D) Canonical pathways enrichment analysis of the of the significantly down-regulated 210 genes in NBS1 organoids compared to control organoids (Top 10 ranked). (E) Venn diagram showing genes expressed only in NBS8 organoids (361), in control organoids (619) and common to both organoids (14,401; detection p value < 0.05). (F) Bar chart of the enriched clustered GOs (Top 10 ranked) of the significantly up-regulated 1289 genes in NBS8 organoids compared to control organoids. (G,H) Enrichment clustered GOs (G) and canonical pathways enrichment analysis (H) of the of the significantly down-regulated 1211 genes in NBS8 organoids compared to control organoids (Top 10 ranked).
Figure 4
Figure 4
DNA damage response analysis in NBS organoids. (A) qRT-PCR analysis of the C-Terminal fragment of NBN in NBS1- and NBS8- iPSCs and 20D organoids compared to control iPSCs (CTR1 and CTR2) and 20D control (CTR1 and CTR2) organoids. (B) Heatmap showing differential gene expression analysis of selected DNA damage repair-related genes expressed in control and NBS organoids at day 20. (C,D) qRT-PCR analysis of ATM (C) and TP53 (D) mRNA expression in NBS1 and NBS8 organoids relative to control organoids (CTR1 and CTR2). (F) Immunoblotting for total p53 in CTR1, CTR2 and NBS1 and NBS8 iPSCs and 20 days cerebral organoids. (E,G) qRT-PCR analysis of MDM2 (E) and CDKN1A (G) mRNA expression in NBS1 and NBS8 organoids relative to control organoids (CTR1 and CTR2). (H) Representative confocal pictures of immunostainings for SOX2, phosphorylated histone H2A.X and DCX in CTR2-, NBS1- and NBS8 organoids. NBS organoids display an increase in γH2A.X nuclear foci formation. Scale bars, 50 µm. (A,CE,G) Results are mean ± 95% confidence interval derived from three independent differentiations. Significance in comparison to control was calculated with one-way ANOVA followed by Dunnett´s multiple comparison test. * p < 0.05, ** p < 0.01.
Figure 5
Figure 5
Neurodifferentiation propensity of NBS organoids. (A) Venn diagram showing the exclusively expressed genes in NBS1 and NBS8 organoids (124) compared with in control organoids (detection p value < 0.05). (B) Bar chart of the enriched clustered GOs (Top 10 ranked) of the exclusively expressed genes (124) NBS1 and NBS8 organoids compared to control organoids. (C) qRT-PCR analysis of DCX mRNA expression in NBS1 and NBS8 organoids relative to control organoids (CTR1 and CTR2). (D,E) Quantification of the DCX- (D) and βIII-Tubulin+ (E) positive cells in 20 days CTR2, NBS1 and NBS8 organoids. Results are mean ± SD from three organoids from three independent differentiations. ** p < 0.01. (F) Representative pictures of immunostainings of SOX2 and βIII-Tubulin+ in CTR1 CTR2, NBS1, and NBS8 organoids showing an increase in βIII-Tubulin+ cells. (G) qRT-PCR analysis of NNAT mRNA expression in NBS1 and NBS8 organoids relative to control organoids (CTR1 and CTR2). (H) Immunoblotting for NNAT in CTR1 and NBS8 organoids at day 20 and CTR2 and NBS1 organoids at day 40. (C,G) Results are mean ± 95% confidence interval from three independent differentiations. Significance in comparison to control was calculated with one-way ANOVA followed by Dunnett´s multiple comparison test. * p < 0.05, **** p < 0.0001. (I) Bisulfite sequencing of a CpG island within the promotor region of NNAT. The % methylated CpG dinucleotides in CTR1, CTR2, NBS1 and NBS8 organoids at day 20 is shown. Filled circles denote methylated CpG dinucleotides. White circles denote unmethylated CpGs.
Figure 6
Figure 6
NBS organoids profile at day 40. (A) Schematic depicting the analysis of the NBS and control organoids at day 40. SOT-analysis was performed. Additionally, cerebral organoids were dissociated into single cells for FACS analysis and re-plating in 2D. SOT: single organoid transcriptome. (B) Venn diagram showing genes expressed only in NBS1 organoids (441), in control organoids (437) and common to both at day 40 (14,409; detection p value < 0.05). (C) Bar chart of the enriched clustered GOs and Pathways (Top 10 ranked) of the up-regulated genes (1516) in NBS1- organoids compared to control organoids at day 40. (D) mRNA expression of genes part of the GO: Regulation of neuron apoptotic process in NBS1- compared to CTR2 organoids at day 40. Gene expression extracted from the SOT-analysis. (E) Representative pictures of immunostainings of cleaved-CASP3 and βIII-Tubulin in CTR1 and NBS1 organoids showing increased apoptosis in NBS1 organoids. (F) Bar chart of the enriched clustered GOs (Top 10 ranked) of the down-regulated genes (592) in NBS1- organoids compared to control organoids at day 40.
Figure 7
Figure 7
Effects of bleomycin in NBS organoids at day 40. (A) Schematic depicting the strategy to induce DNA damage with Bleomycin treatment during 72 h from day 37 to day 40 of CTR2- and NBS1 organoids. (B) Venn diagram showing genes expressed only in CTR2_Bleomycin organoids (330), in CTR2_control organoids (700) and common to both (144,146; detection p value < 0.05). (C) Bar chart of the enriched clustered GOs and Pathways (Top 10 ranked) of the up-regulated genes (139) in CTR2_Bleomycin organoids compared to CTR2_control organoids (D) Venn diagram showing genes expressed only in NBS1_Bleomycin organoids (284), in NBS1_control organoids (474) and common to both (414,346; detection p value < 0.05). (E) Bar chart of the enriched clustered GOs and Pathways (Top 10 ranked) of the up-regulated genes (198) in NBS1_Bleomycin organoids compared to NBS1_control organoids. (F) mRNA expression of the genes part of the up-regulated TP53 downstream pathway in CTR2_Bleomycin organoids and NBS1_Bleomycin organoids compared to CTR2_control organoids and NBS1_control organoids, respectively. All genes were significantly up-regulated in CTR2 after bleomycin treatment. (G) mRNA expression of TP53 in CTR2_Bleomycin organoids and NBS1_Bleomycin organoids compared to CTR2_control organoids and NBS1_control organoids. (H) Western blot analyses of total P53 in CTR2 and NBS1 organoids after bleomycin treatment.

Similar articles

Cited by

References

    1. Barzilai A., Biton S., Shiloh Y. The role of the DNA damage response in neuronal development, organization and maintenance. DNA Repair. 2008;7:1010–1027. doi: 10.1016/j.dnarep.2008.03.005. - DOI - PubMed
    1. Halliwell B. Oxidative stress and neurodegeneration: Where are we now? J. Neurochem. 2006;97:1634–1658. doi: 10.1111/j.1471-4159.2006.03907.x. - DOI - PubMed
    1. Chrzanowska K.H., Gregorek H., Dembowska-Bagińska B., Kalina M.A., Digweed M. Nijmegen breakage syndrome (NBS) Orphanet J. Rare Dis. 2012;7:13. doi: 10.1186/1750-1172-7-13. - DOI - PMC - PubMed
    1. Varon R., Demuth I., Chrzanowska K.H. Nijmegen Breakage Syndrome. University of Washington; Seattle, WA, USA: 1993. - PubMed
    1. Digweed M., Sperling K. Nijmegen breakage syndrome: Clinical manifestation of defective response to DNA double-strand breaks. DNA Repair. 2004;3:1207–1217. doi: 10.1016/j.dnarep.2004.03.004. - DOI - PubMed

Publication types

MeSH terms

Substances