. 2022 Mar 9;10(1):31.
doi: 10.1186/s40478-022-01332-9.

Aβ oligomers trigger necroptosis-mediated neurodegeneration via microglia activation in Alzheimer's disease

Affiliations

Aβ oligomers trigger necroptosis-mediated neurodegeneration via microglia activation in Alzheimer's disease

Natalia Salvadores et al. Acta Neuropathol Commun. .

Abstract

Alzheimer's disease (AD) is a major adult-onset neurodegenerative condition with no available treatment. Compelling reports point amyloid-β (Aβ) as the main etiologic agent that triggers AD. Although there is extensive evidence of detrimental crosstalk between Aβ and microglia that contributes to neuroinflammation in AD, the exact mechanism leading to neuron death remains unknown. Using postmortem human AD brain tissue, we show that Aβ pathology is associated with the necroptosis effector pMLKL. Moreover, we found that the burden of Aβ oligomers (Aβo) correlates with the expression of key markers of necroptosis activation. Additionally, inhibition of necroptosis by pharmacological or genetic means, reduce neurodegeneration and memory impairment triggered by Aβo in mice. Since microglial activation is emerging as a central driver for AD pathogenesis, we then tested the contribution of microglia to the mechanism of Aβo-mediated necroptosis activation in neurons. Using an in vitro model, we show that conditioned medium from Aβo-stimulated microglia elicited necroptosis in neurons through activation of TNF-α signaling, triggering extensive neurodegeneration. Notably, necroptosis inhibition provided significant neuronal protection. Together, these findings suggest that Aβo-mediated microglia stimulation in AD contributes to necroptosis activation in neurons and neurodegeneration. As necroptosis is a druggable degenerative mechanism, our findings might have important therapeutic implications to prevent the progression of AD.

Keywords: Alzheimer’s disease; Amyloid-β oligomers; Microglia; Necroptosis; Neurodegeneration; Neuroprotection.


Conflict of interest statement

The authors report no competing interests in relation to this manuscript.

Figures

Fig. 1
Fig. 1
Aβ deposits associate with pMLKL in AD brains. A Representative pictures of the localization of pMLKL in relation to the thioflavin S-positive Aβ deposits in hippocampal brain areas of AD (n = 12), MCI, (n = 3), and CTRL (n = 4) patients (scale bar, CTRL1 25 μm; CTRL2 25 μm; MCI1 50 μm; MCI2 25 μm; AD1 100 μm; and AD2 25 μm). B Representative micrographs of the localization of pMLKL in relation to the Amylo-Glo-positive Aβ deposits in hippocampal brain areas of AD (n = 3) patients (scale bar, 100 μm). C Representative images of hippocampal areas of human AD brains (n = 3), stained with the Amylo-Glo Aβ marker (blue), and co-labeled with the indicated antibodies (scale bar, 25 μm). D, E Colocalization analyses between MAP2 (green) and pMLKL (red, left panel), and between Iba1 (green) and pMLKL (red, right panel) in hippocampal areas of human AD brains (n = 3) was done by determining the Manders coefficient (scale bar, 100 μm). Data are presented as mean ± S.E.M. Data in E were analyzed by Student’s t-test. **p < 0.01
Fig. 2
Fig. 2
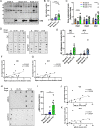
Activation of RIPK1 and MLKL correlate with soluble Aβ oligomer burden in AD brains. A Western blot analysis of total protein extracts from hippocampal samples using a mix of 6E10 and 82E1 antibodies was performed to determine the Aβ content. B The specific band was quantified by densitometric analysis, and represented in the graphs. C The graph represents the expression levels of Ripk1, Ripk3, and Mlkl in human brain samples from patients at different AD stages (Braak stage II (n = 10), III-IV (n = 9), V-VI (n = 10)). D Dot blots of soluble proteins extracted from postmortem brains of individuals with Braak II (n = 4), Braak III-IV (n = 5), and Braak V-VI (n = 8), probed with the indicated antibodies. E Blots were quantified by densitometric analysis and expressed relative to GAPDH protein, represented in the graph. F, G Association analyses of oligomeric Aβ load and mRNA levels were done by linear regression. H Dot blots of protein extracts from postmortem brains of individuals with Braak II (n = 4), Braak III-IV (n = 5), and Braak V-VI (n = 8), probed with the indicated antibodies. I Blots were quantified by densitometric analysis and expressed relative to GAPDH protein, represented in the graph. J, K Association analyses of oligomeric Aβ load and pMLKL levels were done by linear regression. Data are presented as mean ± S.E.M. Data in B, C, E, and I were analyzed by Kruskal–Wallis test followed by Dunn post-hoc test. Data in F, G, J and K were analyzed by linear regression using Spearman rho-test. *p < 0.05; **p < 0.01; ***p < 0.001; ****p < 0.0001
Fig. 3
Fig. 3
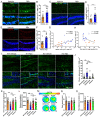
MLKL ablation ameliorates neurodegeneration and memory loss induced by Aβo in mice. A, B Representative micrographs and quantitative analysis of brain sections from wild-type mice subjected to intracerebroventricular infusion of Aβo or vehicle at 18 days post-injection, immunostained with an Iba1 specific antibody (scale bar, 150 μm). C, D Representative images and quantitative analysis of brain sections immunolabeled with an anti-non-phosphorylated neurofilament antibody at 18 days post Aβo injection (scale bar, 150 μm). E, F Representative images and quantitative analysis of brain sections immunolabeled with an anti-pMLKL antibody at 18 days post Aβo injection (scale bar, 150 μm). Association analyses of (G) pMLKL and Fluoro-Jade C stained area and H pMLKL stained area and cognitive performance, were done by linear regression. I, J Representative micrographs and quantitative measurement of brain sections from mice, treated as indicated in the images at 18 days post Vehicle or Aβo injection, stained with Fluoro-Jade C (scale bar, 150 μm). n = 13 per group, 4 sections per brain, one image of the hippocampus per section was analyzed. K, L, N, O The graphs represent quantitative analyzes of the indicated parameters, obtained from the MWM test. M The heat map shows a graphic representation of the time that mice, treated as indicated in the image, spent in the target quadrant (TQ) during the MWM test. Data are presented as mean ± S.E.M. The data in B, D, and F were analyzed by Student’s t-test. Data in G and H were analyzed by linear regression using Pearson correlation. Data in J-L, N, and O were analyzed by one-way ANOVA followed by Bonferroni post-test. *p < 0.05; **p < 0.01; ***p < 0.001
Fig. 4
Fig. 4
RIPK3 inhibition reduces neurodegeneration and memory loss induced by Aβo in mice. A, B Representative images and quantitative analysis of brain sections from wild-type mice at 18 days post-injection, treated as indicated in the images and immunolabeled with an anti-pMLKL antibody (scale bar, 150 μm). C, D Representative micrographs and quantitative measurement of brain sections from wild-type mice at 18 days post-injection, treated as indicated in the images, and stained with Fluoro-Jade C (scale bar, 150 μm). n = 10 per group, 4 sections per brain, one image of the hippocampus per section was analyzed. E, F, H, I Graphs represent quantitative analyzes of the indicated parameters, obtained from the MWM test. G The heat map shows a graphic representation of the time that mice, treated as indicated in the image, spent in the target quadrant (TQ) during the MWM test. J Association analysis of Fluoro-Jade C stained area and cognitive performance was done by linear regression. Data are presented as mean ± S.E.M. Data in B, D-F, H, and I were analyzed by one-way ANOVA followed by Bonferroni post-test. Data in J were analyzed by linear regression using Pearson correlation. *p < 0.05; **p < 0.01; ***p < 0.001; ****p < 0.0001
Fig. 5
Fig. 5
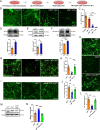
Neurodegeneration induced by conditioned medium from Aβo-stimulated microglia occurs via necroptosis activation. A Schematic representation of the preparation of the conditioned medium. B, C Representative images and quantitative analysis from neurons treated for 72 h with culture medium collected from a culture dish where Aβo were previously immobilized using nitrocellulose (control), neurons treated with conditioned medium from untreated microglia (CMctrl), and neurons treated with 10% and 50% conditioned medium from Aβo-stimulated microglia (CM); immunostaining was performed with anti-acetylated tubulin antibody (scale bar, 50 μm). Western blot analyses of protein extracts from neurons treated for 6 h with CM were performed to determine the expression levels of RIPK3 (D) and pMLKL (E). Specific bands were quantified by densitometric analysis and expressed relative to HSP90 protein, represented in the graphs. F Protein extracts from neurons treated for 6 h with CM were immunoprecipitated with an antibody against RIPK1 and probed for pMLKL. The graph represents the densitometric analysis of the western blots. G, H Representative micrographs and quantitative measurements of neurons treated for 72 h with CMctrl, CM and with Nec-1 s (30 μM) prior to the addition of CM, immunolabeled with anti-acetylated tubulin antibody (scale bar, 200 μm). I,J Representative images and quantitative analysis of neurons treated for 72 h with CMctrl, CM and with GSK’872 (1 μM) prior to the addition of CM, immunolabeled with anti-acetylated tubulin antibody (scale bar, 200 μm). K, L Representative images and quantitative analysis of neurons treated with CMctrl, CM, and with CM that was previously mixed with Infliximab (0.01 μg/μl, Infliximab/CM), immunostained with anti-acetylated tubulin antibody (scale bar, 200 μm). M, N Western blot analysis of protein extracts from neurons treated for 6 h under the indicated conditions was performed to determine the expression levels of pMLKL. Bands were quantified by densitometric analysis and expressed relative to HSP90 protein, represented in the graph. Each experiment was performed at least three independent times, with three replicates per condition each time. Data are presented as mean ± S.E.M. Data in C, H, J, L, and N were analyzed by one-way ANOVA followed by Bonferroni post-test. Data in DF were analyzed by Student’s t-test. *p < 0.05; **p < 0.01; ***p < 0.001, ****p < 0.0001

Similar articles

Cited by

References

    1. Alzheimer’s Association, 2020 Alzheimer’s disease facts and figures. Alzheimer’s Dementia16, 391–460 (2020).
    1. Selkoe DJ, Hardy J. The amyloid hypothesis of Alzheimer’s disease at 25 years. EMBO Mol Med. 2016;8:595–608. - PMC - PubMed
    1. Cline EN, Bicca MA, Viola KL, Klein WL. The amyloid-β oligomer hypothesis: Beginning of the third decade. J Alzheimer’s Dis. 2018;64:S567–S610. - PMC - PubMed
    1. Brody DL, Jiang H, Wildburger N, Esparza TJ. Non-canonical soluble amyloid-beta aggregates and plaque buffering: controversies and future directions for target discovery in Alzheimer’s disease. Alzheimer’s Res Therapy. 2017;9:1–13. - PMC - PubMed
    1. Esparza TJ, et al. Amyloid-beta oligomerization in Alzheimer dementia versus high-pathology controls. Ann Neurol. 2013;73:104–119. - PMC - PubMed

Publication types

Substances