Prediction of Short-Term Breast Cancer Risk with Fusion of CC- and MLO-Based Risk Models in Four-View Mammograms
- PMID: 35262841
- PMCID: PMC9485387
- DOI: 10.1007/s10278-019-00266-4
Prediction of Short-Term Breast Cancer Risk with Fusion of CC- and MLO-Based Risk Models in Four-View Mammograms
Abstract
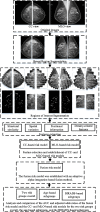
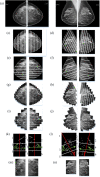
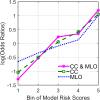
This study performed and assessed a novel program to improve the accuracy of short-term breast cancer risk prediction by using information from craniocaudal (CC) and mediolateral-oblique (MLO) views of two breasts. An age-matched dataset of 556 patients with at least two sequential full-field digital mammography examinations was applied. In the second examination, 278 cases were diagnosed and pathologically verified as cancer, and 278 were negative, while all cases in the first examination were negative (not recalled). Two generalized linear-model-based risk prediction models were established with global- and local-based bilateral asymmetry features for CC and MLO views first. Then, a new fusion risk model was developed by fusing prediction results of the CC- and MLO-based risk models with an adaptive alpha-integration-based fusion method. The AUC of the fusion risk model was 0.72 ± 0.02, which was significantly higher than the AUC of CC- or MLO-based risk model (P < 0.05). The maximum odds ratio for CC- and MLO-based risk models were 8.09 and 5.25, respectively, and increased to 11.99 for the fusion risk model. For subgroups of patients aged 37-49 years, 50-65 years, and 66-87 years, the AUCs of 0.73, 0.71, and 0.75 for the fusion risk model were higher than AUC for CC- and MLO-based risk models. For the BIRADS 2 and 3 subgroups, the AUC values were 0.72 and 0.71 respectively for the fusion risk model which were higher than the AUC for the CC- and MLO-based risk models. This study demonstrated that the fusion risk model we established could effectively derive and integrate supplementary and useful information extracted from both CC and MLO view images and adaptively fuse them to increase the predictive power of the short-term breast cancer risk assessment model.
Keywords: Bilateral asymmetry; Computer-aided detection; Four-view mammography; Fusion risk model; Short-term breast cancer risk.
© 2019. The Author(s) under exclusive licence to Society for Imaging Informatics in Medicine.
Figures


Similar articles
-
Assessment of a Four-View Mammographic Image Feature Based Fusion Model to Predict Near-Term Breast Cancer Risk.Ann Biomed Eng. 2015 Oct;43(10):2416-28. doi: 10.1007/s10439-015-1316-5. Epub 2015 Apr 8. Ann Biomed Eng. 2015. PMID: 25851469 Free PMC article.
-
Deep learning modeling using normal mammograms for predicting breast cancer risk.Med Phys. 2020 Jan;47(1):110-118. doi: 10.1002/mp.13886. Epub 2019 Nov 19. Med Phys. 2020. PMID: 31667873 Free PMC article.
-
Fusion of k-Gabor features from medio-lateral-oblique and craniocaudal view mammograms for improved breast cancer diagnosis.J Cancer Res Ther. 2018 Jul-Sep;14(5):1036-1041. doi: 10.4103/jcrt.JCRT_1352_16. J Cancer Res Ther. 2018. PMID: 30197344
-
Strategies to Increase Cancer Detection: Review of True-Positive and False-Negative Results at Digital Breast Tomosynthesis Screening.Radiographics. 2016 Nov-Dec;36(7):1954-1965. doi: 10.1148/rg.2016160049. Epub 2016 Oct 7. Radiographics. 2016. PMID: 27715711 Free PMC article. Review.
-
A review of mammographic image quality in Papua New Guinea.J Med Radiat Sci. 2022 Mar;69(1):24-29. doi: 10.1002/jmrs.538. Epub 2021 Aug 21. J Med Radiat Sci. 2022. PMID: 34418330 Free PMC article. Review.
References
Publication types
MeSH terms
Grants and funding
- 2017YFC0109402/the National Key R&D Program
- R01 CA197150/CA/NCI NIH HHS/United States
- R01CA197150/the National Cancer Institute, National Institutes of Health, USA
- 2013CB329502/National Basic Research Program (973 program) of China
- LZ15F01001/the grant from Natural Science Foundation of Zhejiang Province of China
LinkOut - more resources
Full Text Sources
Medical

