. 2022 Mar 8;12(1):3737.
doi: 10.1038/s41598-022-07706-2.

Low dose DMSO treatment induces oligomerization and accelerates aggregation of α-synuclein

Affiliations

Low dose DMSO treatment induces oligomerization and accelerates aggregation of α-synuclein

Lasse Reimer et al. Sci Rep. .

Abstract

Dimethyl sulfoxide (DMSO) is a highly utilized small molecule that serves many purposes in scientific research. DMSO offers unique polar, aprotic and amphiphilic features, which makes it an ideal solvent for a wide variety of both polar and nonpolar molecules. Furthermore, DMSO is often used as a cryoprotectant in cell-based research. However, recent reports suggest that DMSO, even at low concentration, might interfere with important cellular processes, and cause macromolecular changes to proteins where a shift from α-helical to β-sheet structure can be observed. To investigate how DMSO might influence current research, we assessed biochemical and cellular impacts of DMSO treatment on the structure of the aggregation-prone protein α-synuclein, which plays a central role in the etiology of Parkinson's disease, and other brain-related disorders, collectively termed the synucleinopathies. Here, we found that addition of DMSO increased the particle-size of α-synuclein, and accelerated the formation of seeding-potent fibrils in a dose-dependent manner. These fibrils made in the presence of DMSO were indistinguishable from fibrils made in pure PBS, when assessed by proteolytic digestion, cytotoxic profile and their ability to seed cellular aggregation of α-synuclein. Moreover, as evident through binding to the MJFR-14-6-4-2 antibody, which preferentially recognizes aggregated forms of α-synuclein, and a bimolecular fluorescence complementation assay, cells exposed to DMSO experienced increased aggregation of α-synuclein. However, no observable α-synuclein abnormalities nor differences in neuronal survival were detected after oral DMSO-treatment in either C57BL/6- or α-synuclein transgenic F28 mice. In summary, we demonstrate that low concentrations of DMSO makes α-synuclein susceptible to undergo aggregation both in vitro and in cells. This may affect experimental outcomes when studying α-synuclein in the presence of DMSO, and should call for careful consideration when such experiments are planned.


Conflict of interest statement

The authors declare no competing interests.

Figures

Figure 1
Figure 1
DMSO increases α-syn particle-size, aggregation-dependent antibody recognition and stimulates fibrillation (A and B) Dynamic light scattering analysis of α-syn (0.5 mg/mL, 35 µM) and carbonic anhydrase (0.5 mg/mL, 17 µM) incubated for 1 h with increasing concentrations of DMSO (0%, 2%, 5% and 10%). The figure demonstrates a mass% distribution based on the scattering intensity, with log scaled hydrodynamic radius depicted on the X-axis. Representative figure of three independent replicates (n = 3). (C) Dot blot of 100 ng of α-syn protein. Prior to loading, recombinant α-syn was incubated for 30 min at room temperature (RT) under non-agitating conditions in a concentration of 10 µg/mL (0.69 µM) in PBS alone or in combination with indicated concentrations of DMSO. α-syn was visualized using total α-syn (SYN-1) or MJFR-14–6-4–2 antibodies. (D) Quantification of MJFR-14–6-4–2/SYN-1 α-syn signal ratio normalized to 0% DMSO (n = 3, *p < 0.05, ***p < 0.001, one-way ANOVA followed by Dunnett’s multiple comparison test). (E) Lyophilized recombinant α-syn was re-suspended in sterile PBS alone (0% DMSO) or in combination with increasing amounts of DMSO (1%, 5% or 10%). A sample with 10% DMSO alone was included as negative control. The samples were incubated at 37 °C and 1050 rpm in a final α-syn concentration of 0.5 mg/mL (35 µM). ThT measurements were performed on 10 µl samples added to 100 μl of 40 μM ThT (final concentration) and signal measured (excitation at 450 nm and emission at 486 nm). Values were normalized to day 0 measurements for each sample and fitted as a sigmoidal growth curve. Representative figure of three independent replicates (n = 3). (F) Sedimentation assay of samples depicted in E) after 7 days of incubation. Equal volumes of each sample (0%, 1%, 5% and 10% DMSO) were pelleted by 25.000×g centrifugation for 30 min at 20 °C. The pellets were re-suspended and resolved on SDS-PAGE and stained using Coommassie Brilliant Blue. Depicted supernatant and pellet gel stainings were developed on two individual SDS-PAGE gels (n = 3). (G) Lyophilized recombinant β-syn was re-suspended in sterile PBS alone (0% DMSO) or in combination with 10% DMSO. The samples were incubated at 37 °C and 1050 rpm in a final β-syn concentration of 0.5 mg/mL (35 µM). ThT measurements were performed on 10 µl samples (excitation at 450 nm and emission at 486 nm), and normalized to day 0 measurements. Representative figure of three independent replicates (n = 3).
Figure 2
Figure 2
DMSO stimulated fibrils resemble naïve α-syn fibrils and maintain seeding capabilities (A) Representative image of TEM shows structure of wt α-syn PFFs or α-syn DMSO PFFs made in the presence of 2% DMSO. Scalebar = 200 nm. Representative images of three replicates (n = 3). (B) Digest samples of 25.000×g pelleted wt α-syn- and α-syn DMSO PFFs. Samples were digested with depicted concentrations of Proteinase K (PK). Digested samples were resolved on SDS-PAGE and stained at RT, using Coommassie Brilliant Blue. Representative gel of three independent replicates (n = 3). (C) Viability of α-syn-expressing SHSY5Y ASYN cells was measured by MTT assay 8 days post seeding. On day 2 the cells were left untreated (control) or treated with PBS (+ PBS), α-syn PFFs (28 μg/mL/2 μM) or 2% DMSO α-syn PFFs (28 μg/mL/2 μM) which was removed on day 4. Bars represent relative viability normalized to control. Three biological replicates with 10 measurements in each experiment (n = 3, ****p < 0.0001, one-way ANOVA followed by Tukey’s multiple comparison test) (D) Human a-syn expressing OLN-AS7 cells were exposed to PBS (Control) or 14 μg/mL (1 μM) sonicated S129A α-syn PFFs prepared in PBS alone (S129A α-syn PFFs) or in the presence of 2% DMSO (2% DMSO S129A α-syn PFFs). After 24 h of PFF treatment, the cells were washed to remove excess PFF and subsequently incubated for another 24 h before being fixed and visualized using DAPI (blue), α-tubulin (purple), total α-syn (red) or anti-phospho-S129 α-syn (green). Scale bar = 20 µm. Representative images of three biological replicates with 10 measurements in each experiment. (E) Quantification of area of anti-phospho-S129 α-syn signal relative to number of DAPI stained nuclei. Data are shown as mean of three independent experiments (n = 3, ****p < 0.0001, one-way ANOVA followed by Tukey’s multiple comparison test).
Figure 3
Figure 3
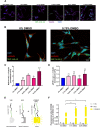
DMSO treatment induces α-syn multimerization in cells (A) SH-SY5Y ASYN cells were treated with dox to suppress α-syn expression (- α-syn) or relieved from dox treatment to induce α-syn overexpression. Cells relieved from dox were treated with increasing amounts of DMSO (0%, 0.1%, 0.25%, 0.5% or 0.75%) for 7 days prior to fixation, and visualized using DAPI (blue), MJFR-14–6-4–2 (green) or α-tubulin (purple). To stop mitosis, the SH-SY5Y ASYN cells were treated with retinoic acid (10 μM final concentration) during the experiment. Scalebar = 20 µm. (B) High magnification image of α-syn expressing SH-SY5Y ASYN cells treated with 0%- (left) or 0.75% (right) of DMSO for 7 days prior to fixation, and visualization using DAPI (blue), MJFR-14–6-4–2 (green) and α-tubulin (red). Scalebar = 20 µm. (C) Quantification of area of MJFR-14–6-4–2 signal from individual coverslips relative to area of α-Tubulin signal in α-syn expressing cells treated with increasing amounts of DMSO (0%, 0.1%, 0.25%, 0.5% or 0.75%) for 7 days (n = 4, with ~ 10 images for each condition in each experiment, *p < 0.05, **p < 0.01, ****p < 0.0001, one-way ANOVA followed by Dunnett’s multiple comparison test). (D) Quantification of area of anti-phospho-S129 α-syn signal from individual coverslips relative to area of α-Tubulin in α-syn expressing cells treated with increasing amounts of DMSO (0%, 0.1%, 0.25%, 0.5% or 0.75%) for 7 days (n = 3 with ~ 8 images for each condition in each experiment, one-way ANOVA followed by Dunnett’s multiple comparison test). (E) Explanatory figure of principle behind bimolecular fluorescence complementation (BiFC) assay using the fluorescent venus YFP construct. Upon correct dimerization of α-syn within the two fluorescent complementation pairs, V1S and SV2 will bring, the N- and C-terminus fluorescent fragments of Venus YFP within proximity, thereby allowing emission of its yellow fluorescent signal. (F) Quantification of YFP signal (excitation at 513 nm and emission at 528 nm) from Venus-α-syn oligomerization in non-treated and 0.1%- and 0.25% DMSO treated HEK-293 cells (20 h. treatment). Signal was normalized to non-treated V1S/SV2-expressing cells. (n = 3 with 10 measurements in each experiment, **p < 0.01, one-way ANOVA followed by Dunnett’s multiple comparison test).
Figure 4
Figure 4
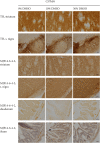
Oral treatment with DMSO does not induce α-syn aggregation in vivo. Free floating 30 um sections of brain tissue from striatum or substantia nigra or paraffin embedded sections of duodenum and ileum from wt C57BL/6 mice.Twelwe wt C57bl/6 mice were divided into three groups with four in each and treated daily with water (0% DMSO), 10% DMSO (1 g/kg bodyweight) or 30% DMSO (3 g/kg bodyweight) for 14 days prior to sacrifizing and tissue collection. Striatum or substantia nigra sections from all animals were stained with an anti-tyrosine hydroxylase antibody and with the MJFR-14–6-4–2 antibody (n = 4 for each condition). The duodenum and ileum samples from all animals were stained with the MJFR14-6–4-2 antibody. n = 4–6 sections per segment (s2, s5, s8) were analyzed for the intestinal samples and one series of brain sections spanning the entirety of the brain from OB to beginning of cerebellum (30 µm sections, 10 series = 300 um distance between the sections for each series) for each animal. Scalebar = 20 µm for striatum, duedenum and ilium and 50 µm for substantia nigra.

Similar articles

Cited by

References

    1. Lashuel HA, Overk CR, Oueslati A, Masliah E. The many faces of alpha-synuclein: From structure and toxicity to therapeutic target. Nat. Rev. Neurosci. 2013;14(1):38–48. - PMC - PubMed
    1. Rocha EM, De Miranda B, Sanders LH. Alpha-synuclein: Pathology, mitochondrial dysfunction and neuroinflammation in Parkinson’s disease. Neurobiol. Dis. 2018;109:249–257. - PubMed
    1. Bartels T, Choi JG, Selkoe DJ. alpha-Synuclein occurs physiologically as a helically folded tetramer that resists aggregation. Nature. 2011;477(7362):107–110. - PMC - PubMed
    1. Dettmer U, Newman AJ, Luth ES, Bartels T, Selkoe D. In vivo cross-linking reveals principally oligomeric forms of alpha-synuclein and beta-synuclein in neurons and non-neural cells. J. Biol. Chem. 2013;288(9):6371–6385. - PMC - PubMed
    1. George JM. The synucleins. Genome Biol. 2001;3(1):3002. - PMC - PubMed

Publication types