. 2022 Mar 8:11:e73150.
doi: 10.7554/eLife.73150.

Confined migration promotes cancer metastasis through resistance to anoikis and increased invasiveness

Affiliations

Confined migration promotes cancer metastasis through resistance to anoikis and increased invasiveness

Deborah Fanfone et al. Elife. .

Abstract

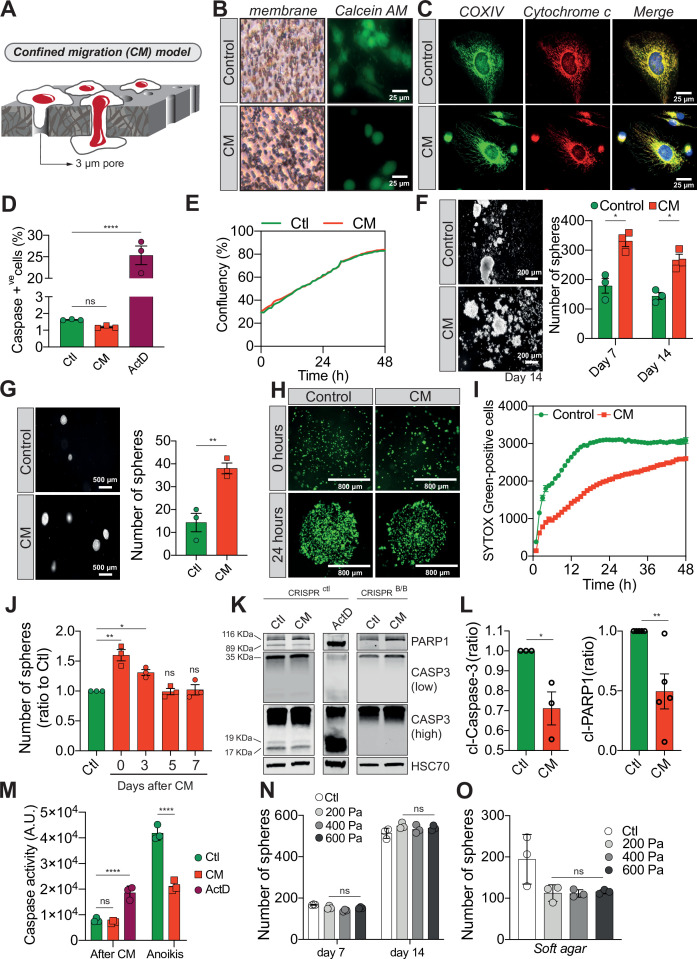
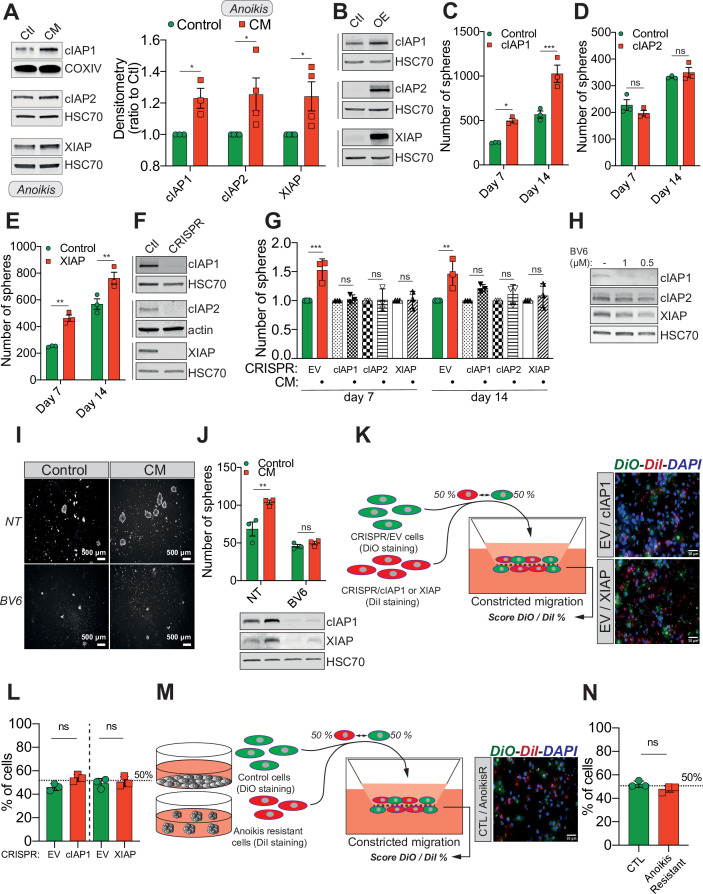
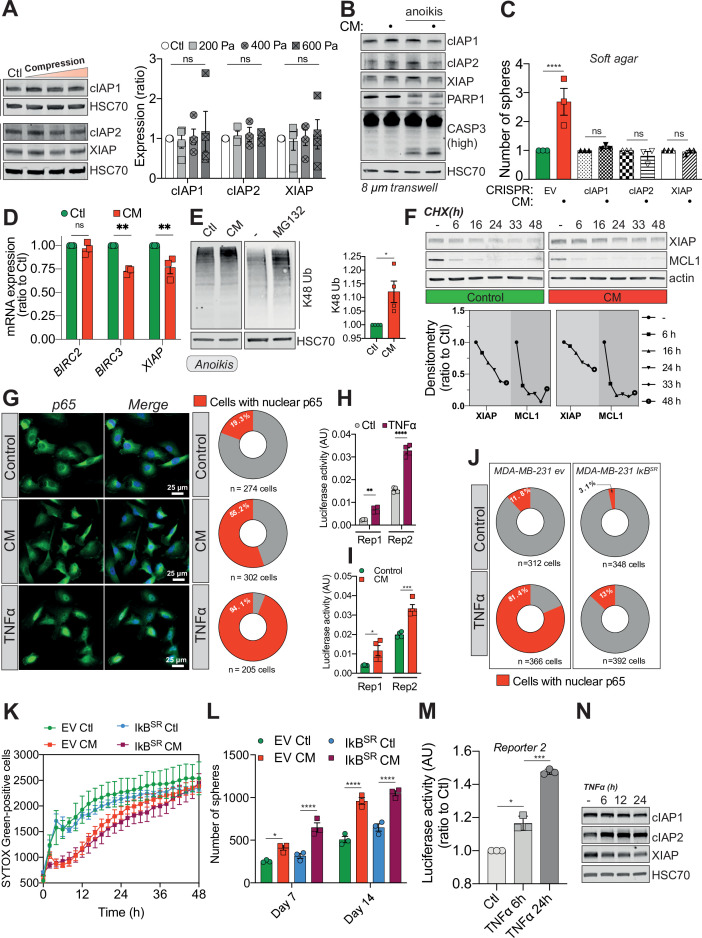
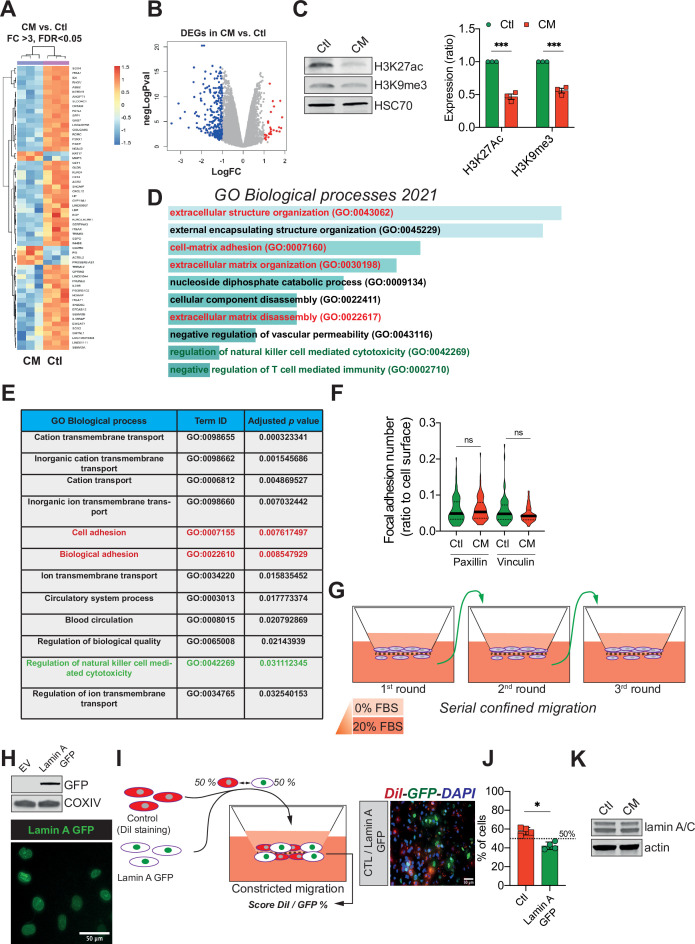
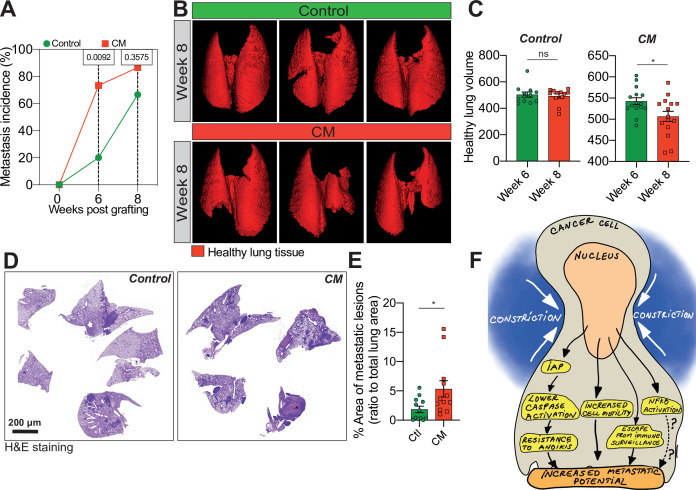
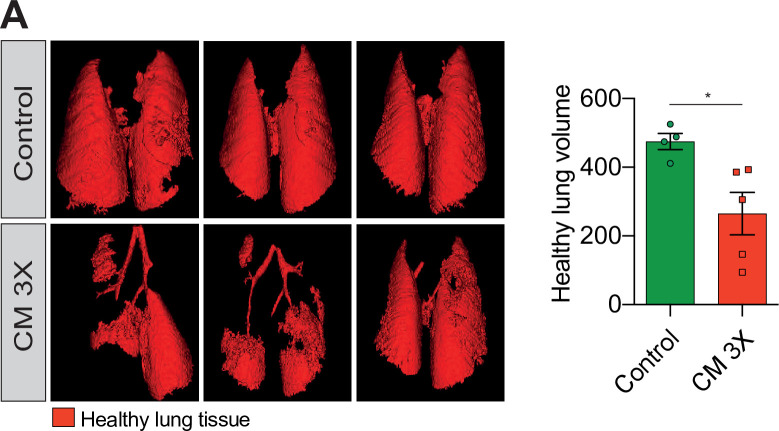
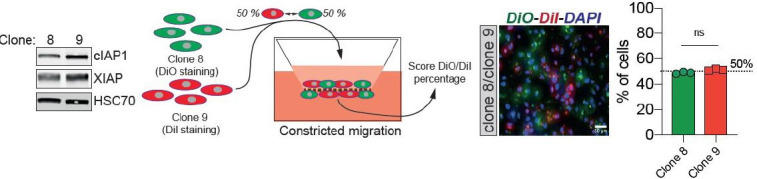
Mechanical stress is known to fuel several hallmarks of cancer, ranging from genome instability to uncontrolled proliferation or invasion. Cancer cells are constantly challenged by mechanical stresses not only in the primary tumour but also during metastasis. However, this latter has seldom been studied with regards to mechanobiology, in particular resistance to anoikis, a cell death programme triggered by loss of cell adhesion. Here, we show in vitro that migrating breast cancer cells develop resistance to anoikis following their passage through microporous membranes mimicking confined migration (CM), a mechanical constriction that cancer cells encounter during metastasis. This CM-induced resistance was mediated by Inhibitory of Apoptosis Proteins, and sensitivity to anoikis could be restored after their inhibition using second mitochondria-derived activator of caspase (SMAC) mimetics. Anoikis-resistant mechanically stressed cancer cells displayed enhanced cell motility and evasion from natural killer cell-mediated immune surveillance, as well as a marked advantage to form lung metastatic lesions in mice. Our findings reveal that CM increases the metastatic potential of breast cancer cells.

Keywords: IAP; anoikis; cancer biology; caspases; cell biology; confinement; human; mechanobiology; metastasis; mouse.


Conflict of interest statement

DF, ZW, JM, KB, DN, KW, AH, FV, FB, CJ, HH, ST, AH, GI No competing interests declared

Figures

Figure 1.
Figure 1.. Confined migration (CM) confers breast cancer cells with resistance to anoikis.
(A) Schematic illustration of the 3-µm transwell-based CM model. (B) MDA-MB-231 control cells or cells recovered from CM were stained with the Calcein AM viability dye and imaged by epifluorescence microscopy. (C) Representative immunofluorescence images of control and CM-challenged MDA-MB-231 cells stained for COX IV and cytochrome c. (D) Flow cytometry-based quantitative analysis of cells activating the VC3AI caspase reporter (n = 3, one-way analysis of variance [ANOVA] statistical test). (E) IncuCyte ZOOM live-cell imaging-based analysis of cell proliferation (n = 3, a representative experiment is shown). (F) Representative images of clonogenic structures from control and confined MDA-MB-231 cells grown in anoikis-promoting, ultra-low attachment conditions (left panel). Corresponding quantification of resistance to anoikis after 7 and 14 days of culture (right panel, n = 3, two-way ANOVA statistical test). (G) Control and CM-challenged MDA-MB-231 cells were grown in soft agar to test their anchorage-independent growth. Left panel depicts representative images, while the right panel is the quantification of clonogenic structures after 1 month (n = 3, t-test). (H) Control and CM-challenged MDA-MB-231 cells were imaged for 48 hr in an IncuCyte ZOOM imager in anoikis-promoting, ultra-low attachment conditions, and stained with SYTOX Green (n = 3, a representative experiment is shown). (I) IncuCyte-based SYTOX Green staining quantification of cell survival in control and CM MDA-MB-231 cells in anoikis-promoting conditions (n = 3, a representative experiment is shown). (J) Quantitative analysis of clonogenic structures illustrating the duration of resistance to anoikis between control and CM MDA-MB-231 cells up to 7 days post-CM (n = 3, one-way ANOVA statistical test). (K) Western blot analysis of PARP-1 cleavage and caspase-3 processing following CM and anoikis growth in control and in CRISPR/Cas9-mediated BAX/BAK DKO MDA-MB-231 cells. Actinomycin D treatment (1 µM for 12 hr) is used as a positive control for induction of apoptosis. (L) Densitometry analysis of PARP-1 and caspase-3 cleavage (ratio of CM cells to control) in anoikis conditions in MDA-MB-231 cells (n = 3–4, t-test). (M) The effect of CM on effector caspase activation was assessed using a fluorometric assay. Caspase activation was tested either immediately after CM, or in cells that were subsequently grown 24 hr in anoikis conditions (n = 3, two-way ANOVA statistical test). (N) Quantification of clonogenic structures formed by control or compressed MDA-MB-231 cells (subjected to 200, 400, or 600 Pa of compression for 16 hr) after 7 and 14 days of culture in anoikis conditions (n = 3, two-way ANOVA statistical test). (O) Quantification of clonogenic structures formed in soft agar by compressed MDA-MB-231 cells (n = 3, one-way ANOVA statistical test). (Statistical significance: ns - P > 0.05; * - P ≤ 0.05; ** - P ≤ 0.01; *** - P ≤ 0.001; **** - P ≤ 0.0001).
Figure 1—figure supplement 1.
Figure 1—figure supplement 1.. Confined migration (CM) confers breast cancer cells with resistance to anoikis.
(A) Representative epifluorescence and phase images of VC3AI caspase reporter-expressing control and BAX/BAK double-KO MDA-MB-231 cells validating the bimolecular fluorescence complementation (BiFC) caspase reporter. Treatment with Actinomycin D was used as a positive control to induce caspase activation. (B) Western blot analysis of BAX and BAK protein expression, validating their KO through CRISPR/Cas9 in VC3AI-expressing MDA-MB-231 cells. The expression of the caspase reporter VC3AI is determined through anti-GFP immunoblotting. (C) Flow cytometry-based cell cycle profiles for PI-stained control, CM, and Actinomycin D-treated MDA-MB-231 cells. (D) Flow cytometry-based subG1 quantification (n = 3, one-way analysis of variance [ANOVA] statistical test). (E) Assessment of MDA-MB-231 cell cycle profile using PI staining and flow cytometry analysis (n = 3, two-way ANOVA statistical test). (F) Flow cytometry analysis of mitochondrial membrane potential (tetramethylrhodamine ethyl ester perchlorate [TMRE] staining). Carbonyl cyanide 3-chlorophenylhydrazone (CCCP) treatment at 12.5 µM was used as a positive control for disrupting the mitochondrial membrane potential (n = 3, one-way ANOVA statistical test). (G) Quantification of total ATP content in control and constricted MDA-MB-231 cells (n = 3, one-way ANOVA statistical test). Flow cytometry-based quantification as mean fluorescence intensity (MFI) for mitochondrial reactive oxygen species (ROS) (H) and overall cellular ROS (I). Cells treated with 500 µM H2O2 were used as a control for the production of ROS (n = 3, one-way ANOVA statistical test). (J) Representative pictures of control and CM Hs578T cells cultured in ultra-low attachment condition and forming clonogenic structures (left panel). The corresponding quantitative analysis of the number of clonogenic structures after 7 and 14 days of culture is shown in the right panel (n = 3, two-way ANOVA statistical test). (K) Schematic diagram of the compression device, allowing the compression of breast cancer cells MDA-MB-231 with a constant force. Cells are plated on a transwell membrane, allowing gas and passage of nutrients. An agarose cushion is placed on top of the cell monolayer (control cells were compressed only by the agarose disk) and a custom printed cup is then added on top and filled with the corresponding weight in lead, resulting in various pressures. (L) Representative images of MDA-MB-231 nuclei (stained with Hoechst) during 600 Pa compression (left panel) and the corresponding quantification of nuclear area showing a significant increase under compression (right panel, n = 3, t-test). (M, N) Quantitative comparison of the number of clonogenic structures for MDA-MB-231 passing through transwells with 8 µm in diameter pores in ultra-low attachment conditions (M, n = 3, two-way ANOVA statistical test) or in soft agar (N, n = 3, t-test). (O) The effect of MDA-MB-231 cells migrating through transwells with 8 µm in diameter pores on caspase-3/7 activation as assessed by a fluorometric assay. This was either tested immediately after the transwell assay or in cells that were subsequently grown 24 hr in anoikis conditions (n = 3, two-way ANOVA statistical test). (P) Western blot analysis of BCL-xL, BCL2, and MCL1 expression in control and CM MDA-MB-231 cells. (Statistical significance: ns - P > 0.05; * - P ≤ 0.05; ** - P ≤ 0.01; *** - P ≤ 0.001; **** - P ≤ 0.0001).
Figure 2.
Figure 2.. Confined migration (CM)-induced resistance to anoikis relies on Inhibitory of Apoptosis Proteins (IAPs).
(A) Western blot analysis of IAPs protein expression in MDA-MB-231 cells after CM through 3 µm in diameter membranes, with cells grown in ultra-low attachment conditions (left panel) and the corresponding densitometry analysis (right panel) (n = 3–4, two-way analysis of variance [ANOVA] statistical test). (B) Validation of IAPs protein overexpression in MDA-MB-231 cells by Western blot. Quantitative comparison of resistance to anoikis in cIAP1 (C), cIAP2 (D), and XIAP (E) overexpressing MDA-MB-231 cells in steady-state conditions. Clonogenic structures were counted after 7 and 14 days of culture in ultra-low attachment condition (n = 3, two-way ANOVA statistical test). (F) Western blot analysis of protein expression validating the efficacy of CRISPR/Cas9-mediated deletion of IAPs. (G) Quantitative comparison of resistance to anoikis in MDA-MB-231 cells deleted for cIAP1, cIAP2, and XIAP using CRISPR/Cas9 and subjected to CM (n = 3, two-way ANOVA statistical test). (H) Validation by Western blot of IAPs expression inhibition by treating MDA-MB-231 cells with BV6. Two concentrations of BV6 (0.5 and 1 µM) were used for 16 hr of treatment. (I) Representative images of clonogenic structures from MDA-MB-231 control and CM cells cultured in low attachment conditions and treated with 0.5 µM of BV6. (J) Quantitative comparison of resistance to anoikis in CM MDA-MB-231 cells treated with 0.5 µM of SMAC mimetic BV6. Western blot analysis confirming inhibition of cIAP1 and XIAP expression following BV6 treatment (n = 3, two-way ANOVA statistical test). (K) CRISPR EV (control) and CRISPR cIAP1 or XIAP MDA-MB-231 cells were stained with DiO and DiI, respectively, mixed at a 50:50% ratio and then tested in CM. The cells undergoing CM were then scored for the ratio DiO:DiI and representative fluorescence images are shown. (L) Quantification of the percentage of CRISPR EV versus CRISPR cIAP1 and XIAP cells passing through constrictive pores (n = 3, t-test). (M) Control and anoikis-resistant cells (selected for 7 days in ultra-low attachment culture plates) were stained with DiO and DiI, respectively, mixed at a 50:50% ratio and then tested in CM. The cells undergoing CM were then scored for the ratio DiO:DiI and representative fluorescence images are shown. (N) Quantification of the percentage of control versus anoikis-resistant cells passing through constrictive pores (n = 3, t-test). (Statistical significance: ns - P > 0.05; * - P ≤ 0.05; ** - P ≤ 0.01; *** - P ≤ 0.001; **** - P ≤ 0.0001).
Figure 2—figure supplement 1.
Figure 2—figure supplement 1.. Confined migration (CM)-induced resistance to anoikis relies on Inhibitory of Apoptosis Proteins (IAPs).
(A) Western blot analysis of Inhibitory of Apoptosis Proteins (IAPs) expression in MDA-MB-231 cells compressed 16 hr with 200, 400, or 600 Pa. The right panel represents the corresponding densitometry analysis (n = 3–4, two-way analysis of variance [ANOVA] statistical test). (B) Western blot analysis of IAPs expression, PARP-1 cleavage, and caspase-3 processing in MDA-MB-231 cells after their migration through transwell pores of 8 µm in diameter, with or without culturing cells in anoikis-promoting conditions (in ultra-low attachment culture plates). (C) Quantitative comparison of soft agar clonogenic survival using control or CM MDA-MB-231 cells deleted for individual IAPs using CRISPR/Cas9 (n = 3, one-way ANOVA statistical test). (D) IAPs relative mRNA expression by qRT-PCR in control and CM MDA-MB-231 cells (n = 3, one-way ANOVA statistical test). (E) Western blot analysis of K48 ubiquitination in total protein lysates from control and CM cells (left panel). Treatment with MG132 was used as a positive control for proteasome inhibition. The right panel depicts the corresponding densitometry analysis (n = 4, t-test). (F) Cycloheximide chase assay (50 ng/ml) showing by Western blot XIAP and MCL1 proteosomal degradation (upper panel). Lower panel represents the corresponding densitometry analysis, n = 2. (G) The effect of confined migration on p65 nuclear localization in MDA-MB-231 cells was assessed by immunofluorescence. TNFα treatment (20 ng/ml for 1 hr) was used to induce p65 nuclear translocation. Corresponding quantification of the percentage of cells with nuclear p65 staining is shown in the right panel. (H) Luciferase assay to validate the NF-κB luciferase reporters following stimulation with TNFα (20 ng/ml for 1 hr) (n = 4, two-way ANOVA statistical test). (I) MDA-MB-231 cells transiently expressing two NF-κB luciferase reporters were mechanically stressed by CM and luciferase activity was immediately assessed (n = 3, two-way ANOVA statistical test). (J) Quantification for the percentage of EV versus IkBSR-expressing cells treated or not with TNFα and presenting nuclear p65 staining. (K) Quantification of resistance to anoikis in empty vector or IkBSR-expressing MDA-MB-231 by SYTOX Green incorporation and IncuCyte ZOOM-based live-cell microscopy (n = 3, a representative experiment is shown). (L) Empty vector or IkBSR-expressing MDA-MB-231 control or CM cells were cultured for 7 and 14 days in anoikis-favouring conditions and the surviving clonogenic structures were quantified (n = 3, two-way ANOVA statistical test). (M) Luciferase assay validating NF-κB activation following TNFα treatment (20 ng/ml) for 6 and 24 hr (n = 3, one-way ANOVA statistical test). (N) Western blot analysis of IAPs expression in MDA-MB-231 cells treated as in (M). (Statistical significance: ns - P > 0.05; * - P ≤ 0.05; ** - P ≤ 0.01; *** - P ≤ 0.001; **** - P ≤ 0.0001).
Figure 3.
Figure 3.. Confined migration (CM) confers breast cancer cells with a discrete aggressive behaviour.
(A) Representative immunofluorescence images of MDA-MB-231 cells after CM with phalloidin-stained actin filaments. The right panels are quantification of the number of stress fibres and filopodia. (B) Representative kinetics holotomographic images (phase and cell segmentation) of control and MDA-MB-231 cells subjected to CM obtained by Nanolive imaging (left panel). Corresponding quantitative analysis of cell area variations of control and CM cells during a 60-min time-lapse acquisition is shown in the right panel. (C) Spider plot analysis for single-cell migration assay. Control (117 cells) and CM (110 cells) cells were tracked for 24 hr. Quantitative analysis of single-cell migration velocity (D) and distance travelled (E) between control and CM MDA-MB-231 cells. (F) Schematic representation of the IncuCyte ZOOM imager-based wound-healing assay. (G) Monolayers of MDA-MB-231 control and CM cells were wounded and pictures were taken immediately after wound induction (T0) and 24 hr later. (H) Corresponding quantitative analysis of the migratory potential of control and CM cells through wound area measurement (n = 3, a representative experiment is shown). (I) Schematic representation of invasion assay. After the wound was made, breast cancer MDA-MB-231 cells invaded through a matrigel plug until they closed the wound. (J) Monolayers of MDA-MB-231 control and CM cells were wounded and pictures were taken immediately after wound induction (T0) and 24 hr later. (K) Corresponding quantitative analysis of the invasive potential of control and CM cells through wound area measurement (n = 3, a representative experiment is shown). (L) Representative images of control and MDA-MB-231 cells subjected to serial CM and undergoing chemotaxis through transwell membranes with 8 µm in diameter pores. (M) Chemotaxis quantification relative to (l) (n = 3, one-way analysis of variance [ANOVA] statistical test). (N) Comparative quantitative analysis based on IncuCyte ZOOM imager of the migratory potential between control and MDA-MB-231 cells that have undergone serial CM (for three different clones) (n = 3, a representative experiment is shown). (O) FACS analysis of apoptotic cells among CM tumour cells compared to control cells, co-cultured with natural killer (NK cells at the ratio of 1:20 for NK cells). Results were analysed by assessing the ratio of CFSElow/CFSEhigh with baseline-correction to no NK cell culture condition (n = 3, t-test). (P) FACS analysis of GrzB+ tumour cells among CM and control MDA-MB-231 cells, co-cultured with NK cells at a ratio of 1:20 (n = 3, t-test). (Statistical significance: ns - P > 0.05; * - P ≤ 0.05; ** - P ≤ 0.01; *** - P ≤ 0.001; **** - P ≤ 0.0001).
Figure 3—figure supplement 1.
Figure 3—figure supplement 1.. Confined migration (CM) confers breast cancer cells with a discrete aggressive behaviour.
(A) Unsupervised clustering of the RNA sequencing data in control and confined migration (CM) MDA-MB-231 cells. Orange indicates increased and blue decreased mRNA abundance of selected genes with fold change above 3, 3 replicates/condition. (B) Volcano plot displaying the expression (in log fold change) of each differentially expressed gene. (C) Western blot analysis of H3K27 acetylation and H3K9 tri-methylation in control and CM MDA-MB-231 cells. The right panel is the densitometry analysis (n = 3, one-way analysis of variance ANOVA statistical test). Enrichr- (D) and g:Profiler- (E) based gene ontology (GO) analysis of the genes differentially expressed (above 2 FC, up- and downregulated) in cancer cells subjected to CM. Signatures related to cellular motility are in red while those concerning immune surveillance are in green. (F) Assessment of the number of focal adhesions between control and CM MDA-MB-231 cells based on immunostaining for paxillin and vinculin (t-test). (G) Schematic representation of the serial CM. Between CM events, cells were amplified and re-challenged until reaching three consecutive CM. (H) Upper panel: Western blotting analysis for GFP showing the expression of lamin A GFP into MDA-MB-231 cells. Lower panel: representative image of lamin A GFP-positive MDA-MB-231 cellular nuclei. (I) Control cells were stained in red with DiI, mixed at a 50:50% ratio with lamin A GFP-expressing MDA-MB-231 and then tested in CM. The cells undergoing CM were then scored for the ratio DiI:GFP and a representative fluorescence image is shown. (J) Quantification of the percentage of control versus lamin A GFP-expressing cells passing through constrictive pores (n = 4, t-test). (K) Western blot analysis for lamin A/C expression in control and CM MDA-MB-231 cells. (Statistical significance: ns - P > 0.05; * - P ≤ 0.05; ** - P ≤ 0.01; *** - P ≤ 0.001; **** - P ≤ 0.0001).
Figure 4.
Figure 4.. Breast cancer cells subjected to confined migration (CM) acquire enhanced metastatic potential.
(A) Analysis of lung metastasis incidence in nude mice engrafted with either control or CM MDA-MB-231 cells (two-tailed Fisher’s exact test). (B) Representative micro-computed tomography (microCT)-based 3D reconstructions (red represents healthy lung volume) of lungs from mice engrafted with either control or MDA-MB-231 cells undergoing CM, 15 mice/condition. (C) Corresponding quantification of remaining healthy lung volume 6 and 8 weeks post-engraftment. (D) Representative H&E staining of lung sections. (E) Quantification of lung metastatic foci (ratio to total lung surface). (F) Model: as a consequence of CM but not compression, cancer cells become resistant to cell death triggered by loss of cell attachment (anoikis), which relies on increased expression of IAPs proteins. NF-κB is also activated by mechanical stress, yet it does not impact resistance to anoikis. In addition, CM cancer cells are more resistant to natural killer (NK)-mediated immune surveillance. Together with a marked motility advantage, this confers an increased metastatic colonization advantage to breast cancer cells having undergone CM. (Statistical significance: ns - P > 0.05; * - P ≤ 0.05; ** - P ≤ 0.01; *** - P ≤ 0.001; **** - P ≤ 0.0001).
Figure 4—figure supplement 1.
Figure 4—figure supplement 1.. Breast cancer cells subjected to confined migration (CM) acquire enhanced metastatic potential.
(A) Analysis of lung metastasis incidence in nude mice engrafted with either control or MDA-MB-231 cells undergoing three consecutive rounds of confined migration (CM; left panel). Right panel presents the corresponding quantification of remaining healthy lung volume in engrafted mice, 4–5 mice/condition.
Author response image 1.

Similar articles

Cited by

References

    1. Acerbi I, Cassereau L, Dean I, Shi Q, Au A, Park C, Chen YY, Liphardt J, Hwang ES, Weaver VM. Human breast cancer invasion and aggression correlates with ECM stiffening and immune cell infiltration. Integrative Biology. 2015;7:1120–1134. doi: 10.1039/c5ib00040h. - DOI - PMC - PubMed
    1. Barrow AD, Edeling MA, Trifonov V, Luo J, Goyal P, Bohl B, Bando JK, Kim AH, Walker J, Andahazy M, Bugatti M, Melocchi L, Vermi W, Fremont DH, Cox S, Cella M, Schmedt C, Colonna M. Natural killer cells control tumor growth by sensing a growth factor. Cell. 2018;172:534–548. doi: 10.1016/j.cell.2017.11.037. - DOI - PMC - PubMed
    1. Berezovskaya O, Schimmer AD, Glinskii AB, Pinilla C, Hoffman RM, Reed JC, Glinsky GV. Increased expression of apoptosis inhibitor protein XIAP contributes to anoikis resistance of circulating human prostate cancer metastasis precursor cells. Cancer Research. 2005;65:2378–2386. doi: 10.1158/0008-5472.CAN-04-2649. - DOI - PubMed
    1. Butcher DT, Alliston T, Weaver VM. A tense situation: forcing tumour progression. Nature Reviews. Cancer. 2009;9:108–122. doi: 10.1038/nrc2544. - DOI - PMC - PubMed
    1. Cailleau R, Young R, Olivé M, Reeves WJ. Breast tumor cell lines from pleural effusions. Journal of the National Cancer Institute. 1974;53:661–674. doi: 10.1093/jnci/53.3.661. - DOI - PMC - PubMed

Publication types

Associated data

Grants and funding

The funders had no role in study design, data collection, and interpretation, or the decision to submit the work for publication.