

Dysregulation of the miR-30c/DLL4 axis by circHIPK3 is essential for KSHV lytic replication
- PMID: 35239998
- PMCID: PMC9066072
- DOI: 10.15252/embr.202154117
Dysregulation of the miR-30c/DLL4 axis by circHIPK3 is essential for KSHV lytic replication
Abstract
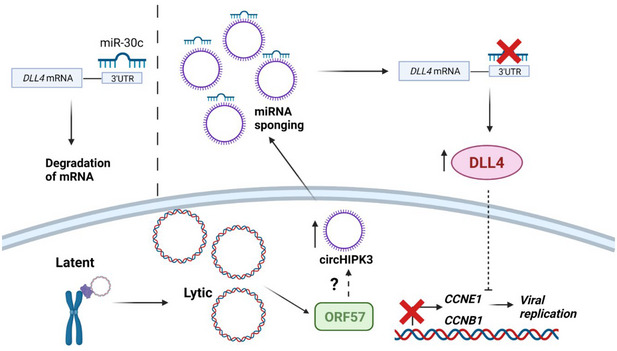
Non-coding RNA (ncRNA) regulatory networks are emerging as critical regulators of gene expression. These intricate networks of ncRNA:ncRNA interactions modulate multiple cellular pathways and impact the development and progression of multiple diseases. Herpesviruses, including Kaposi's sarcoma-associated herpesvirus, are adept at utilising ncRNAs, encoding their own as well as dysregulating host ncRNAs to modulate virus gene expression and the host response to infection. Research has mainly focused on unidirectional ncRNA-mediated regulation of target protein-coding transcripts; however, we identify a novel host ncRNA regulatory network essential for KSHV lytic replication in B cells. KSHV-mediated upregulation of the host cell circRNA, circHIPK3, is a key component of this network, functioning as a competing endogenous RNA of miR-30c, leading to increased levels of the miR-30c target, DLL4. Dysregulation of this network highlights a novel mechanism of cell cycle control during KSHV lytic replication in B cells. Importantly, disruption at any point within this novel ncRNA regulatory network has a detrimental effect on KSHV lytic replication, highlighting the essential nature of this network and potential for therapeutic intervention.
Keywords: Kaposi's sarcoma (KS)-associated herpesvirus; circRNAs; ncRNAs; regulatory network.
© 2022 The Authors. Published under the terms of the CC BY 4.0 license.
Figures
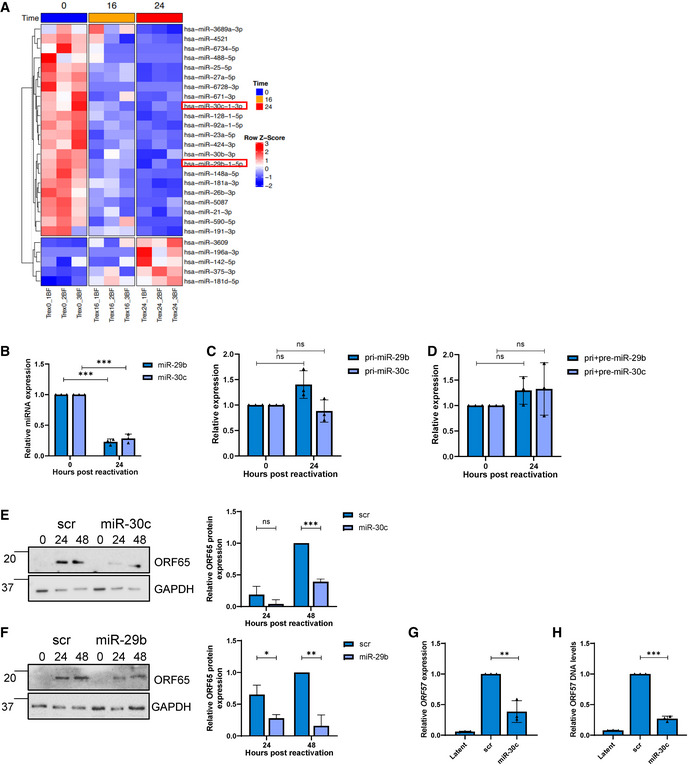
- A
Heat map of differentially expressed miRNAs during KSHV replication at 0, 16 and 24 h identified through miR‐Seq. miR‐29b and miR‐30c are highlighted in red, with T test analysis.
- B
qPCR analysis of miR‐29b and miR‐30c levels in cells at 0 and 24 h post‐lytic induction. SNORD68 was used as a housekeeper (n = 3).
- C, D
qPCR analysis of TREx 0 and 24 post‐induction (n = 3) using GAPDH as a housekeeper, and analysis is of levels of pri‐miR‐29b/pri‐miR‐30c (C) and pri+pre‐miR‐29b/pri+pre‐miR‐30c (D).
- E
Representative western blot of scr or miR‐30c transfected TREx cells analysed for ORF65 expression with GAPDH as a loading control. Densitometry analysis performed on n = 3.
- F
Representative western blot of scr or miR‐29b transfected TREx cells analysed for ORF65 expression with GAPDH as a loading control. Densitometry analysis performed on n = 3.
- G
qPCR analysis of ORF57 DNA levels for viral load at 72 h post induction, with scr and miR‐30c transfected TREx cells with uninduced cells as a control and GAPDH as a housekeeper (n = 3).
- H
qPCR analysis of ORF57 in HEK‐293T cells for reinfection assay.
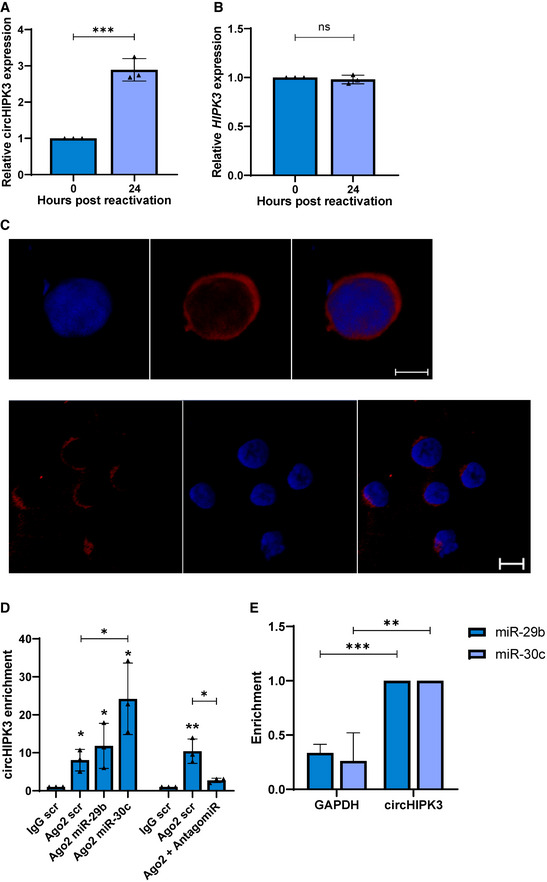
- A, B
qPCR analysis of TREx 0 and 24 post‐induction (n = 3) using GAPDH as a housekeeper, analysis is of levels of circHIPK3 (A) and HIPK3 (B).
- C
FISH analysis of TREx cells reactivated for 16 h with probes against circHIPK3 (red). DAPI was used as nuclei stain (blue), scale bars represent 5 μm on upper panel and 10 μm on lower panel. The lower panel shows a wider field of view.
- D
qPCR analysis of Ago2 RIPs in TREx cells transfected with scr, miR‐29b or miR‐30c showing circHIPK3 enrichment over GAPDH, with each repeat normalised to an IgG scr RIP (n = 3).
- E
qPCR analysis of Streptavidin RIPs of circHIPK3 or GAPDH enrichment in HEK‐293T cells transfected with either biotinylated miR‐29b or miR‐30c over scr (n = 4).
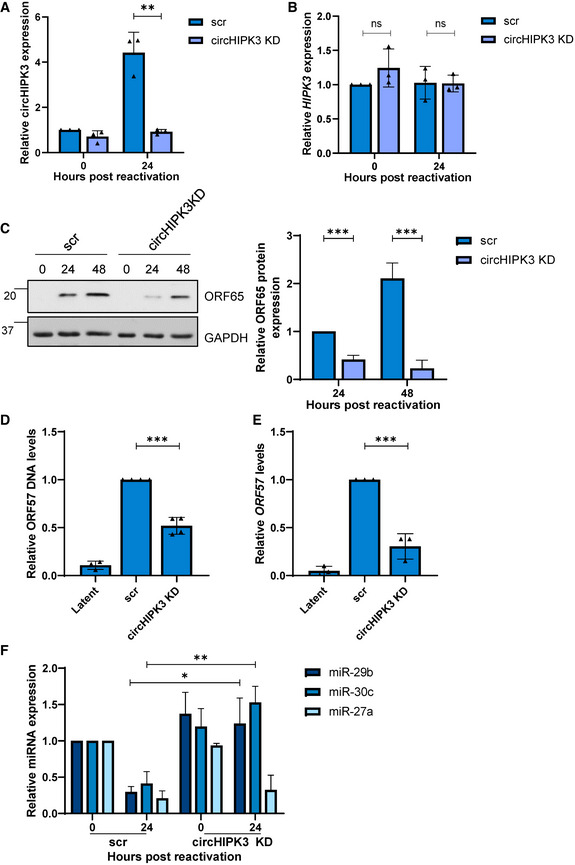
qPCR analysis of circHIPK3 levels in scr and circHIPK3 KD stably expressing TREx cells. GAPDH was used as a housekeeper (n = 3).
qPCR analysis of HIPK3 levels in scr and circHIPK3 KD stably expressing TREx cells. GAPDH was used as a housekeeper (n = 3).
Representative western blot of ORF65 levels in scr and circHIPK3 KD cell lines with GAPDH as a loading control. Densitometry analysis of n = 3 western blots.
qPCR analysis of ORF57 DNA levels for viral load at 72 h post‐induction, with scr and circHIPK3 KD TREx cells with uninduced cells as a control and GAPDH as a housekeeper (n = 3).
qPCR analysis of ORF57 in HEK‐293T cells for reinfection assay (n = 3).
qPCR analysis of levels of miR‐29b, miR‐30c and miR‐27a in scr and circHIPK3 KD cells 0 and 24 h post‐induction. SNORD68 was used as a housekeeper (n = 3).
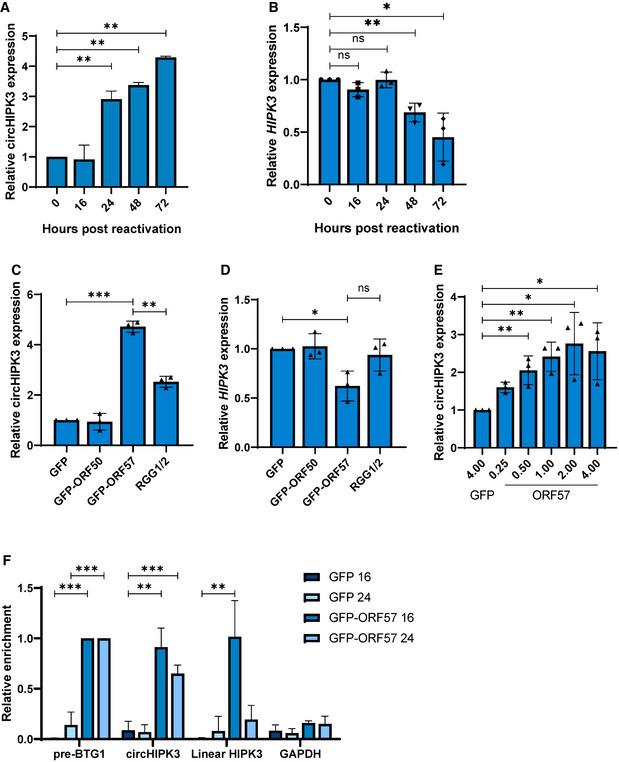
qPCR analysis of circHIPK3 levels at time points in TREx post‐induction with GAPDH as a housekeeper (n = 3).
qPCR analysis of HIPK3 levels at time points in TREx post‐induction with GAPDH as a housekeeper (n = 3).
qPCR analysis of circHIPK3 expression in HEK‐293Ts transfected with GFP, ORF50‐GFP, ORF57‐GFP or ORF‐57‐GFP RGG1/2 with GAPDH as a housekeeper (n = 3).
qPCR analysis of HIPK3 expression in HEK‐293Ts transfected with GFP, ORF50‐GFP, ORF57‐GFP or ORF‐57‐GFP RGG1/2 with GAPDH as a housekeeper (n = 3).
qPCR analysis of circHIPK3 expression in HEK‐293Ts transfected with 4 µg GFP, or 0.25–4 µg ORF57‐GFP, GAPDH was used as a housekeeper (n = 3).
qPCR analysis GFP RIPs in GFP or ORF57‐GFP transfected HEK‐293Ts at 16 and 24 h post‐transfection, respectively, n = 3 for each time course.
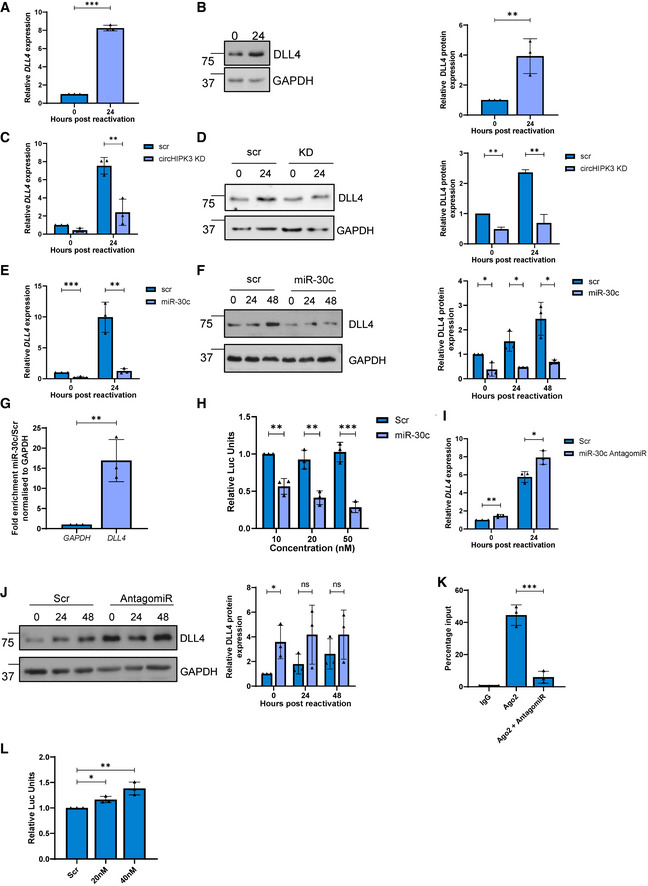
qPCR analysis of DLL4 levels in TREx cells 0 and 24 h post‐induction. GAPDH was used as a housekeeper (n = 3).
Representative western blot of DLL4 expression in TREx cells 0 and 24 h post‐induction. GAPDH was used a loading control (n = 3).
qPCR of DLL4 levels in scr and circHIPK3 KD stable TREx cells at 0 and 24 h post‐induction with GAPDH as a housekeeper (n = 3).
Representative western blot of DLL4 levels in scr and circHIPK3 stable TREx cells at 0 and 24 h post‐induction with GAPDH as a loading control. Densitometry analysis of n = 3.
qPCR analysis of DLL4 levels in TREx cells that have been transfected with either scr or miR‐30c 24 h pre‐induction, analysis performed 0 and 24 h post‐induction. GAPDH was used as a housekeeper (n = 3).
Representative western blot of DLL4 levels in scr‐ or miR‐30c‐transfected TREx cells at 0, 24 and 48 h post induction with GAPDH as a loading control. Densitometry analysis of n = 3
Fold enrichment of GAPDH and DLL4 in biotinylated miR‐30c RIPs over Scr transfected into HEK‐293Ts (n = 3)
Luciferase reporter assay from HEK‐293Ts co‐transfected with DLL4 3’UTR reporter plasmid and either scr or miR‐30c. Data presented are relative to an internal firefly control (n = 3).
qPCR analysis of DLL4 levels in TREx cells that have transfected with either scr or a miR‐30c antagomiR 24 h pre‐induction, with analysis performed at 0 and 24 h post‐induction. GAPDH was used as a housekeeper (n = 3).
Representative western blot of DLL4 levels in scr or miR‐30c antagomiR‐transfected TREx cells at 0, 24 and 48 h post‐induction with GAPDH as a loading control. Densitometry analysis of n = 3.
qPCR analysis of DLL4 expression in Ago2 RIPs as a percentage of input. TREx cells were transfected with either a scrambled control or a miR‐30c antagomiR (n = 3).
Luciferase reporter assay from HEK‐293Ts co‐transfected with DLL4 3’UTR reporter plasmid and either scr or miR‐30c antagomiR. Data presented are relative to an internal firefly control (n = 3).
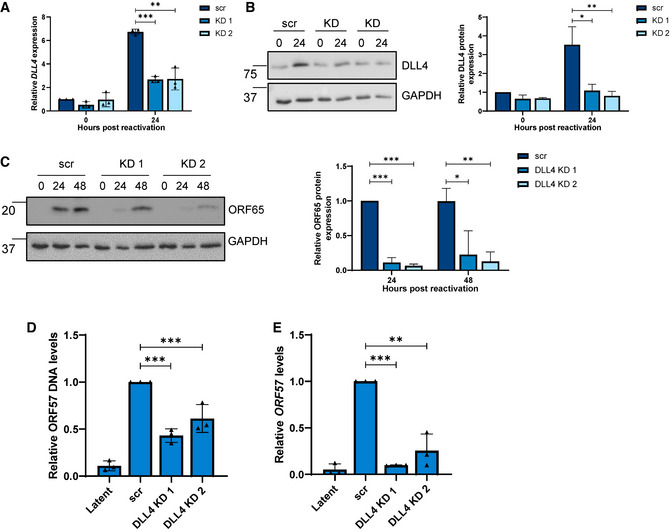
qPCR of DLL4 expression in stable expression scr and two DLL4 KD TREx cell lines at 0 and 24 h post‐induction. GAPDH was used as a housekeeper (n = 3).
Representative western blot of DLL4 levels in scr and DLL4 KD TREx cells with GAPDH as a loading control, densitometry analysis is n = 3.
Representative western blot of ORF65 levels at 0, 24 and 48 h post‐induction in scr and DLL4 KD TREx cells, GAPDH was used as a loading control and densitometry analysis performed on n = 3.
qPCR analysis of ORF57 DNA levels for viral load at 72 h post‐induction, with scr and DLL4 KD cells with uninduced cells as a control and GAPDH as a housekeeper (n = 3).
qPCR analysis of ORF57 in HEK‐293T cells for reinfection assay (n = 3).
- A, B
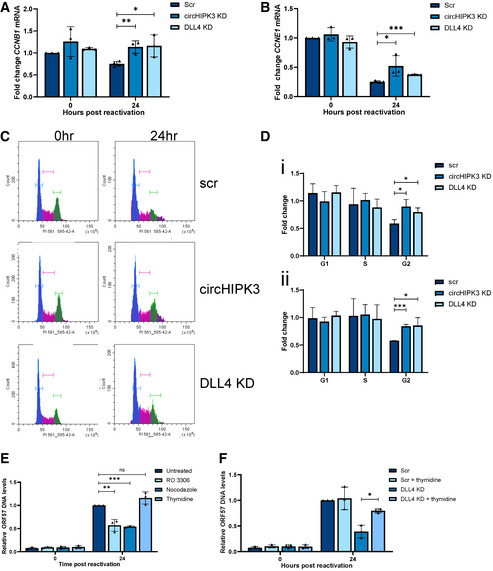
qPCR of CCNB1 and CCNE1 levels in scr, circHIPK3 KD and DLL4 KD cells at 0 and 24 h post‐induction (n = 3).
- C, D
Representative plot of cell cycle distribution at 48 h post‐induction in scr, circHIPK3 and DLL4 KD cells, with G1 phase (blue), S phase (pink) and G2/M phase (green) highlighted. (D) Analysis of fold change in number of cells in G1, S and G2/M phases of the cell cycle from 0 to 24 h post‐induction (n = 4) (i) or 0 to 48 h post‐induction (n = 3) (ii). Cells used were scr, circHIPK3 KD or DLL4 KD stable TREx cells and cycle analysis was performed using propidium iodide and flow cytometry (n = 3).
- E
qPCR for ORF57 DNA levels in TREx cells at 48 h post‐lytic induction with treatment of RO 3306, nocodazole or thymidine (n = 3).
- F
qPCR for ORF57 DNA levels at 48 h post‐lytic induction with treatment of RO 3306, nocodazole or thymidine in scr or DLL4 KD cell lines (n = 3).
Similar articles
-
Discovery of Kaposi's sarcoma herpesvirus-encoded circular RNAs and a human antiviral circular RNA.Proc Natl Acad Sci U S A. 2018 Dec 11;115(50):12805-12810. doi: 10.1073/pnas.1816183115. Epub 2018 Nov 19. Proc Natl Acad Sci U S A. 2018. PMID: 30455306 Free PMC article.
-
HIV-1 Vpr Inhibits Kaposi's Sarcoma-Associated Herpesvirus Lytic Replication by Inducing MicroRNA miR-942-5p and Activating NF-κB Signaling.J Virol. 2016 Sep 12;90(19):8739-53. doi: 10.1128/JVI.00797-16. Print 2016 Oct 1. J Virol. 2016. PMID: 27440900 Free PMC article.
-
vFLIP-regulated competing endogenous RNA (ceRNA) networks targeting lytic induction for KSHV-associated malignancies.J Med Virol. 2022 Jun;94(6):2766-2775. doi: 10.1002/jmv.27654. Epub 2022 Feb 24. J Med Virol. 2022. PMID: 35149992
-
[Replication Machinery of Kaposi's Sarcoma-associated Herpesvirus and Drug Discovery Research].Yakugaku Zasshi. 2019;139(1):69-73. doi: 10.1248/yakushi.18-00164-2. Yakugaku Zasshi. 2019. PMID: 30606932 Review. Japanese.
-
Regulation of herpesvirus lifecycle by viral microRNAs.Virulence. 2010 Sep-Oct;1(5):433-5. doi: 10.4161/viru.1.5.12966. Virulence. 2010. PMID: 21170300 Free PMC article. Review.
Cited by
-
Imaging and quantification of human and viral circular RNAs.Nucleic Acids Res. 2024 Aug 27;52(15):e70. doi: 10.1093/nar/gkae583. Nucleic Acids Res. 2024. PMID: 39051561 Free PMC article.
-
KSHV promotes oncogenic FOS to inhibit nuclease AEN and transactivate RGS2 for AKT phosphorylation.bioRxiv [Preprint]. 2024 Jan 28:2024.01.27.577582. doi: 10.1101/2024.01.27.577582. bioRxiv. 2024. Update in: mBio. 2025 Jan 8;16(1):e0317224. doi: 10.1128/mbio.03172-24. PMID: 38410462 Free PMC article. Updated. Preprint.
-
m6A Regulates the Stability of Cellular Transcripts Required for Efficient KSHV Lytic Replication.Viruses. 2023 Jun 16;15(6):1381. doi: 10.3390/v15061381. Viruses. 2023. PMID: 37376680 Free PMC article.
-
Kaposi's sarcoma-associated herpesvirus induces specialised ribosomes to efficiently translate viral lytic mRNAs.Nat Commun. 2023 Jan 18;14(1):300. doi: 10.1038/s41467-023-35914-5. Nat Commun. 2023. PMID: 36653366 Free PMC article.
-
Interferon induced circRNAs escape herpesvirus host shutoff and suppress lytic infection.EMBO Rep. 2024 Mar;25(3):1541-1569. doi: 10.1038/s44319-023-00051-z. Epub 2024 Jan 23. EMBO Rep. 2024. PMID: 38263330 Free PMC article.
References
-
- Akhter R (2018) Circular RNA and Alzheimer's disease. Adv Exp Med Biol 1087: 239–243 - PubMed
-
- Arnaiz E, Sole C, Manterola L, Iparraguirre L, Otaegui D, Lawrie CH (2018) CircRNAs and cancer: biomarkers and master regulators. Semin Cancer Biol 58: 90–99 - PubMed
-
- Ashwal‐Fluss R, Meyer M, Pamudurti NR, Ivanov A, Bartok O, Hanan M, Evantal N, Memczak S, Rajewsky N, Kadener S (2014) circRNA biogenesis competes with pre‐mRNA splicing. Mol Cell 56: 55–66 - PubMed
Publication types
MeSH terms
Substances
Associated data
- Actions
LinkOut - more resources
Full Text Sources
Molecular Biology Databases
Research Materials
