. 2022 Feb 14:10:788472.
doi: 10.3389/fcell.2022.788472. eCollection 2022.

Sterol Metabolism Differentially Contributes to Maintenance and Exit of Quiescence

Affiliations

Sterol Metabolism Differentially Contributes to Maintenance and Exit of Quiescence

Carlotta Peselj et al. Front Cell Dev Biol. .

Abstract

Nutrient starvation initiates cell cycle exit and entry into quiescence, a reversible, non-proliferative state characterized by stress tolerance, longevity and large-scale remodeling of subcellular structures. Depending on the nature of the depleted nutrient, yeast cells are assumed to enter heterogeneous quiescent states with unique but mostly unexplored characteristics. Here, we show that storage and consumption of neutral lipids in lipid droplets (LDs) differentially impacts the regulation of quiescence driven by glucose or phosphate starvation. Upon prolonged glucose exhaustion, LDs were degraded in the vacuole via Atg1-dependent lipophagy. In contrast, yeast cells entering quiescence due to phosphate exhaustion massively over-accumulated LDs that clustered at the vacuolar surface but were not engulfed via lipophagy. Excessive LD biogenesis required contact formation between the endoplasmic reticulum and the vacuole at nucleus-vacuole junctions and was accompanied by a shift of the cellular lipid profile from membrane towards storage lipids, driven by a transcriptional upregulation of enzymes generating neutral lipids, in particular sterol esters. Importantly, sterol ester biogenesis was critical for long-term survival of phosphate-exhausted cells and supported rapid quiescence exit upon nutrient replenishment, but was dispensable for survival and regrowth of glucose-exhausted cells. Instead, these cells relied on de novo synthesis of sterols and fatty acids for quiescence exit and regrowth. Phosphate-exhausted cells efficiently mobilized storage lipids to support several rounds of cell division even in presence of inhibitors of fatty acid and sterol biosynthesis. In sum, our results show that neutral lipid biosynthesis and mobilization to support quiescence maintenance and exit is tailored to the respective nutrient scarcity.

Keywords: NVJ; lipid droplets; lipophagy; membrane contact sites; quiescence; sterol ester; sterols; yeast.


Conflict of interest statement

The authors declare that the research was conducted in the absence of any commercial or financial relationships that could be construed as a potential conflict of interest.

Figures
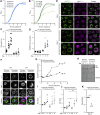
FIGURE 1
FIGURE 1
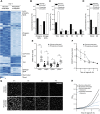
Gradual phosphate exhaustion drives LD biogenesis (A,B) Growth kinetics of wild type (WT; BY4742 unless stated otherwise) cells grown in media containing indicated glucose (A) or phosphate (B) concentrations. OD600 was recorded every 2 h; n = 8 (C) Cell death determined by flow cytometric quantification of propidium iodide staining of WT cells grown into phosphate or glucose exhaustion. Mean ± SEM; n = 10 (D) Flow cytometric quantification of neutral lipid content via BODIPY-staining of WT cells grown into phosphate or glucose exhaustion. BODIPY mean fluorescence intensity was normalized to respective cell size, and data is shown as fold of glucose-exhausted cells at day 1. Mean ± SEM; n = 10 (E) Confocal micrographs of WT cells stained with BODIPY to asses LD localization and harboring endogenously mCherry-tagged Vph1 to visualize vacuoles, subjected to glucose or phosphate exhaustion for indicated time. Scale bar: 2 μm (F) Confocal micrographs of WT (BY4741) cells endogenously expressing Vph1mCherry and a soluble ER reporter (preKar2-GFPHDEL) to visualize vacuoles and ER, respectively. Cells were subjected to monodansylpentane (MDH) staining to visualize LDs after 10 and 24 h of growth into glucose or phosphate exhaustion. Micrographs of glucose-exhausted and phosphate-exhausted cells were processed differently to avoid oversaturation of the signals. Scale bar: 2 μm (G) Flow cytometric quantification of LD biogenesis during growth of WT cells into glucose or phosphate exhaustion. Cells were stained with BODIPY at indicated time points and values were normalized to respective cell size. Data is shown as fold of glucose-exhausted cells upon inoculation. Mean ± SEM; n = 6–12 (H) Thin-layer chromatography to assess neutral lipid content in lipid extracts from WT cells grown into glucose or phosphate exhaustion for indicated time (I, J) Densitometric quantification of TAG (I) and SE (J) content using thin-layer chromatography as shown in (H). Values were normalized to TAG or SE content after 12 h (0.5 days) of growth. Mean ± SEM; n = 3 (K) Densitometric quantification of free sterols in lipid extracts from cells subjected to glucose or phosphate exhaustion for 2 days using thin-layer chromatography as shown in (H). Values were normalized to glucose-exhausted cells. Mean ± SEM; n = 3. For more details in respect to statistical analyses, please see Supplementary Table S4.
FIGURE 2
FIGURE 2
Phosphate exhaustion boosts the synthesis and availability of neutral lipids to support regrowth when nutrients are replenished (A) Heatmap of all significantly altered lipid species comparing total cellular lipid extracts of WT (BY4741) cells subjected to glucose or phosphate exhaustion for 3 days; n = 4 (B-D) Lipidomic quantification of total phospholipids and storage lipids (B), high abundant lipid classes (TAG triacylglycerol; DAG diacylglycerol; PA phosphatidic acid; PC phosphatidylcholine; PE phosphatidylethanolamine; PI phosphatidylinositol) (C) and sterols and sterol esters (SE) in lipid extracts of cells described in (A), depicted as mol% of sample. Mean ± SEM; n = 4. Corresponding levels of low abundant lipid classes are shown in Supplementary Figure S2 (E) qRT-PCR-based quantification of mRNA levels of ARE1, ARE2, DGA1 and LRO1 in WT (BY4742) cells at day 1 of glucose or phosphate exhaustion. Comparative CT method (ΔΔCT method) was used to calculate the relative gene expression using TAF10 as housekeeping gene, and values are depicted as fold of glucose-exhausted cells; n = 8–12 (F) Flow cytometric quantification of LD consumption upon nutrient replenishment after prolonged glucose or phosphate exhaustion. After 3 days of nutrient exhaustion, cells were re-inoculated in unrestricted, fresh standard medium and LD content was quantified using BODIPY at indicated time points. Values were normalized to respective cell size and data is shown as fold of glucose-exhausted cells at 0 h, corresponding to 3 days of nutrient exhaustion. Mean ± SEM; n = 8 (G) Confocal micrographs to visualize LD consumption during regrowth. After 3 days of nutrient exhaustion, cells were stained with BODIPY and immobilized on agar slides with unrestricted, fresh standard medium and were visualized at indicated time points. Scale bar: 5 μm (H) Regrowth of cells after prolonged glucose or phosphate exhaustion. After 3 days of nutrient exhaustion, cells were re-inoculated in unrestricted, fresh standard medium and OD600 was monitored every 2 h. Where indicated, cells were treated with 1 µM cerulenin at the time point of re-inoculation to inhibit fatty acids biosynthesis; n = 4. For more details in respect to statistical analyses, please see Supplementary Table S4.
FIGURE 3
FIGURE 3
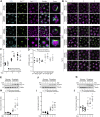
Phosphate exhaustion results in rapid NVJ expansion and increased abundance of NVJ tether proteins (A) Confocal micrographs of WT (BY4741 unless stated otherwise) cells endogenously expressing Vph1mCherry and Nvj1GFP and stained with monodansylpentane (MDH) to visualize LDs at day 1 and 3 of glucose or phosphate exhaustion. Scale bar: 5 μm (B) Confocal micrographs of WT cells harboring endogenously GFP-tagged Nvj1, Vac8 or Tsc13 and simultaneously expressing Vph1mCherry to visualize vacuoles at indicated days in glucose or phosphate exhaustion. Scale bar: 5 μm (C) Automated quantification of Nvj1GFP area in cells shown in (B); Mean ± SEM; n = 8, with at least 150 cells per replicate and time point (D) RT-qPCR-based quantification of mRNA levels of NVJ1, VAC8, TSC13 and MDM1 in WT (BY4742) cells at day 1 of glucose or phosphate exhaustion. Comparative CT method (ΔΔCT method) was used to calculate the relative gene expression using TAF10 as housekeeping gene; Mean ± SEM; n = 3 (E-J) Immunoblot analysis (E-G) and corresponding densitometric quantification (H-J) of protein extracts from WT cells subjected to glucose or phosphate exhaustion and endogenously expressing the GFP-tagged NVJ-resident proteins Nvj1GFP (E, H), Vac8GFP (F, I) and Tsc13GFP ,(G, J). Values were normalized to tubulin as loading control and are depicted as fold of respective glucose-exhausted cells at day 1; Mean ± SEM; n = 6 (for Nvj1GFP) or n = 8 (for Vac8GFP and Tsc13GFP). For more details in respect to statistical analyses, please see Supplementary Table S4.
FIGURE 4
FIGURE 4
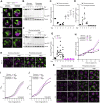
NVJs support LD biogenesis induced by phosphate exhaustion (A) Confocal micrographs of BODIPY-stained WT (BY4741), Δnvj1, and ΔNVJ cells upon glucose or phosphate exhaustion at day 3. Scale bar: 2 μm (B) Flow cytometric quantification of neutral lipid content via BODIPY in WT, Δnvj1, Δmdm1, Δnvj1Δmdm1 and ΔNVJ cells after 3 days of glucose or phosphate exhaustion. BODIPY mean fluorescence intensity was normalized to cell size and data is shown as fold of respective glucose-exhausted cells; Mean ± SEM; n = 8 (C) Survival of WT, Δnvj1, and ΔNVJ cells during chronological aging, determined via flow cytometric quantification of propidium iodide staining at indicated time points after glucose or phosphate exhaustion. n = 4 (D,E) Regrowth of cells described in (C) after 3 days of glucose or phosphate exhaustion. Nutrient-exhausted cells were re-inoculated in unrestricted, fresh standard medium and OD600 was monitored every 2 h. Cells were left untreated (D) or were treated with 1 µM cerulenin at the time point of re-inoculation (E); n = 4. For more details in respect to statistical analyses, please see Supplementary Table S4.
FIGURE 5
FIGURE 5
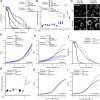
Lipophagy is induced by glucose but not phosphate exhaustion (A) Confocal micrographs of WT (BY4742) cells endogenously expressing Vph1mCherry and Faa4GFP to visualize vacuoles and LDs, respectively, at indicated time points. Scale bar: 2 μm (B) Immunoblot analysis of protein extracts from WT cells endogenously expressing Faa4GFP, subjected to glucose or phosphate exhaustion for indicated time. Blots were probed with antibodies against GFP to detect Faa4GFP and free GFP, and against tubulin as loading control (C,D) Densitometric quantification of immunoblots as depicted in (B). Faa4GFP levels normalized to tubulin and standardized to glucose-exhaustion at day 1 (C) as well as the ratio of free GFP to Faa4GFP, indicating vacuolar turnover (D), are shown. Mean ± SEM; n = 4 (E) Confocal micrographs of WT and Δatg1 cells endogenously expressing Vph1mCherry and stained with BODIPY after 3 days of glucose or phosphate exhaustion. Scale bar: 2 μm (F,G) Immunoblot analysis of protein extracts from WT and Δatg1 cells expressing Faa4GFP subjected to glucose exhaustion for indicated time (F) as well as corresponding densitometric quantification of the ratio of free GFP to Faa4GFP, indicating vacuolar turnover (G). Mean ± SEM; n = 7–8 (H) Flow cytometric quantification of LD biogenesis during growth of WT and Δatg1 cells into glucose or phosphate exhaustion. Cells were stained with BODIPY at indicated time points and values were normalized to respective cell size. Data is shown as fold of glucose-exhausted WT cells upon inoculation. Mean ± SEM; n = 8 (I,J) Regrowth of WT and Δatg1 cells after 3 days of glucose or phosphate exhaustion. Nutrient-exhausted cells were re-inoculated in unrestricted, fresh standard medium and OD600 was monitored every 2 h. Cells were left untreated (I) or were treated with 1 µM cerulenin at the time point of re-inoculation (J); n = 6 (K) Confocal micrographs to visualize LD consumption during regrowth. After 3 days of nutrient exhaustion, WT and Δatg1 cells expressing Vph1mCherry were reinoculated, stained with BODIPY, immobilized on agar slides with unrestricted, fresh standard medium and were visualized at indicated time points. Scale bar: 2 μm. For more details in respect to statistical analyses, please see Supplementary Table S4.
FIGURE 6
FIGURE 6
Sterol ester biogenesis is critical for survival upon phosphate but not glucose exhaustion (A) Survival of WT (BY4742), Δare1Δare2 and Δlro1Δdga1 cells during chronological aging, determined via flow cytometric quantification of propidium iodide staining at indicated time points after glucose or phosphate exhaustion. Mean ± SEM; n = 4 (B) Flow cytometric quantification of neutral lipid content via BODIPY in cells described in (A). BODIPY mean fluorescence intensity was normalized to cell size and data is shown as fold of glucose-exhausted WT cells at day 1; n = 7–8 (C) Confocal micrographs of BODIPY-stained WT and Δare1Δare2 cells upon glucose or phosphate exhaustion at day 3. Scale bar: 2 μm (D) Survival of cells described in (A) after 3 days of glucose or phosphate exhaustion, determined via flow cytometric quantification of propidium iodide staining; Mean ± SEM; n = 4 (E,F) Regrowth of WT and Δare1Δare2 cells after 3 days of glucose or phosphate exhaustion. Nutrient-exhausted cells were re-inoculated in unrestricted, fresh standard medium and OD600 was monitored every 2 h. Cells were left untreated (E) or were treated with 1 µM cerulenin at the time point of re-inoculation (F); n = 8 (G) Regrowth of WT cells after 3 days of glucose or phosphate exhaustion. Nutrient-exhausted cells were re-inoculated in unrestricted, fresh standard medium and OD600 was monitored every 2 h. Where indicated, cells were treated with 100 μg/ml fluconazole at the time point of re-inoculation to inhibit de novo sterol biosynthesis; n = 6. For more details in respect to statistical analyses, please see Supplementary Table S4.
FIGURE 7
FIGURE 7
Sterol ester hydrolysis supports regrowth of phosphate-exhausted cells (A) Survival of WT (BY4742), Δtgl3, Δtgl3Δtgl4 and Δtgl3Δtgl4Δtgl5 cells during chronological aging, determined via flow cytometric quantification of propidium iodide staining at indicated time points after glucose or phosphate exhaustion. Mean ± SEM; n = 6 (B) Flow cytometric quantification of neutral lipid content via BODIPY in cells described in (A). BODIPY mean fluorescence intensity was normalized to cell size and data is shown as fold of glucose-exhausted WT cells at day 1. Mean ± SEM; n = 6 (C) Confocal micrographs of BODIPY-stained WT and Δtgl3Δtgl4 cells upon glucose or phosphate exhaustion at day 3. Scale bar: 2 μm (D,E) Regrowth of cells described in (A) after 3 days of glucose or phosphate exhaustion. Nutrient-exhausted cells were re-inoculated in unrestricted, fresh standard medium and OD600 was monitored every 2 h. Cells were left untreated (D) or were treated with 1 µM cerulenin at the time point of re-inoculation (E); n = 6 (F) Survival of WT and Δtgl1Δyeh1 cells during chronological aging, determined via flow cytometric quantification of propidium iodide staining at indicated time points after glucose or phosphate exhaustion. Mean ± SEM; n = 6 (G) Flow cytometric quantification of neutral lipid content via BODIPY in cells described in (F). BODIPY mean fluorescence intensity was normalized to cell size and data is shown as fold of glucose-exhausted WT cells at day 1. Mean ± SEM; n = 6 (H,I) Regrowth of cells described in (F) after 3 days of glucose or phosphate exhaustion. Nutrient-exhausted cells were re-inoculated in unrestricted, fresh standard medium and OD600 was monitored every 2 h. Cells were left untreated (H) or were treated with 100 μg/ml fluconazole at the time point of re-inoculation (I); n = 6. For more details in respect to statistical analyses, please see Supplementary Table S4.

Similar articles

Cited by

References

    1. Athenstaedt K., Daum G. (2003). YMR313c/TGL3 Encodes a Novel Triacylglycerol Lipase Located in Lipid Particles of Saccharomyces cerevisiae . J. Biol. Chem. 278 (26), 23317–23323. 10.1074/jbc.M302577200 - DOI - PubMed
    1. Athenstaedt K., Daum G. (2005). Tgl4p and Tgl5p, Two Triacylglycerol Lipases of the Yeast Saccharomyces cerevisiae Are Localized to Lipid Particles. J. Biol. Chem. 280 (45), 37301–37309. 10.1074/jbc.M507261200 - DOI - PubMed
    1. Cermelli S., Guo Y., Gross S. P., Welte M. A. (2006). The Lipid-Droplet Proteome Reveals that Droplets Are a Protein-Storage Depot. Curr. Biol. 16 (18), 1783–1795. 10.1016/j.cub.2006.07.062 - DOI - PubMed
    1. Conway M. K., Grunwald D., Heideman W. (2012). Glucose, Nitrogen, and Phosphate Repletion in Saccharomyces cerevisiae: Common Transcriptional Responses to Different Nutrient Signals. G3: Genes|Genomes|Genetics 2 (9), 1003–1017. 10.1534/g3.112.002808 - DOI - PMC - PubMed
    1. Diessl J., Nandy A., Schug C., Habernig L., Büttner S. (2020). Stable and Destabilized GFP Reporters to Monitor Calcineurin Activity in Saccharomyces cerevisiae . Microb. Cel. 7 (4), 106–114. 10.15698/mic2020.04.713 - DOI - PMC - PubMed