. 2022 Mar 2;17(3):e0261530.
doi: 10.1371/journal.pone.0261530. eCollection 2022.

Grxcr1 regulates hair bundle morphogenesis and is required for normal mechanoelectrical transduction in mouse cochlear hair cells

Affiliations

Grxcr1 regulates hair bundle morphogenesis and is required for normal mechanoelectrical transduction in mouse cochlear hair cells

Beatriz Lorente-Cánovas et al. PLoS One. .

Abstract

Tasmanian devil (tde) mice are deaf and exhibit circling behaviour. Sensory hair cells of mutants show disorganised hair bundles with abnormally thin stereocilia. The origin of this mutation is the insertion of a transgene which disrupts expression of the Grxcr1 (glutaredoxin cysteine rich 1) gene. We report here that Grxcr1 exons and transcript sequences are not affected by the transgene insertion in tde homozygous (tde/tde) mice. Furthermore, 5'RACE PCR experiments showed the presence of two different transcripts of the Grxcr1 gene, expressed in both tde/tde and in wild-type controls. However, quantitative analysis of Grxcr1 transcripts revealed a significantly decreased mRNA level in tde/tde mice. The key stereociliary proteins ESPN, MYO7A, EPS8 and PTPRQ were distributed in hair bundles of homozygous tde mutants in a similar pattern compared with control mice. We found that the abnormal morphology of the stereociliary bundle was associated with a reduction in the size and Ca2+-sensitivity of the mechanoelectrical transducer (MET) current. We propose that GRXCR1 is key for the normal growth of the stereociliary bundle prior to the onset of hearing, and in its absence hair cells are unable to mature into fully functional sensory receptors.


Conflict of interest statement

The authors have declared that no competing interests exist.

Figures

Fig 1
Fig 1. Analysis of cochlear hair cells and their stereocilia.
A-F, SEM images of the organ of Corti at 50% distance from the base of the cochlea at P7. The typical arrangement of three rows of outer hair cells (OHC) and one row of inner hair cells (IHC) is observed in +/tde (A, C, D) and tde/tde mice (B, E, F). The stereocilia in mutants (B, E, F) look severely disorganized, abnormally thin with floppy appearance compared to controls (A, C, D). Scale bars: (A, B) 10 μm; (C, D, E, F) 3 μm.
Fig 2
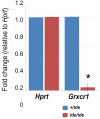
Fig 2. Grxcr1 expression analysis by qRT-PCR in the inner ear.
Quantitative real-time PCR on cDNA generated from total RNA from whole inner ear at P7 (n = 11 tde/tde; n = 5 +/tde). Grxcr1 normalized to Hprt levels was significantly down-regulated in tde/tde mice (red bars) compared to controls (blue bars) (*P<0.001, Wilcoxon rank sum test). Error bars indicate standard deviations.
Fig 3
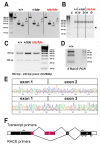
Fig 3. Grxcr1 gene and transcript expression by PCR.
A, PCR amplification of genomic DNA from +/+, +/tde, tde/tde mice with primers specific to each exon of Grxcr1 gene. One single band was amplified for each exon (1–4). Sequencing of all tde genotypes revealed no differences between the genotypes. B, PCR amplification of cDNA derived from the inner ear (e) and brain (b) tissue of +/+, +/tde and tde/tde adult mice, using primers located in Grxcr1 exons 1 and 4, resulted in two bands. No band was detected in the negative control (c). The second weak band was detected in all tde genotypes (asterisk). C, PCR was performed using cDNA from adult inner ears of all tde genotypes. Two bands were amplified in mutants and control mice. D 5’ RACE-PCR was performed using primers within exon 4 to amplify the entire Grxcr1 transcript from the P6 C57BL/6N wild-type inner ear. The gel shows 2 strong bands of different sizes that were sequenced. E, Partial traces and sequence of the larger band (upper panel) and smaller band (lower panel) amplified in B and C showing part of the Grxcr1 transcript sequence which skips exon 2. F, Schematic of the Grxcr1 gene, not to scale. Protein-coding sequences are shown as filled rectangles, and untranslated sequences as empty rectangles. The exons are numbered, and lines connect them in the two splicing patterns observed, with the canonical pattern on top and the novel pattern below. The approximate positions of the transcript primers are shown above, and the RACE primers below. Pink indicates the location of the glutaredoxin domain (amino acids 127–234, from Uniprot, www.uniprot.org, accessed July 2021).
Fig 4
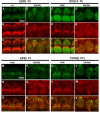
Fig 4. Analysis of hair bundle protein expression by immunofluorescence.
Inner ear tissue from +/tde and tde/tde at P5-P12 were incubated with antibodies for hair bundle proteins ESPN, MYO7A, EPS8 and PTPRQ (in green), rhodamine-phalloidin (in red) and merged images (yellow) obtained by confocal microscopy. Images show inner hair cell (IHC) staining in the middle turn of the cochlear duct. A-F, ESPN is expressed in a punctate manner along the length of stereocilia in controls and tde mutants (P5, +/+ and +/tde n = 3, tde/tde n = 6 mice). G-L, MYO7A is expressed widely within the top of the hair cell of tde mutants in a broadly similar way to heterozygotes (P5, +/tde n = 4, tde/tde n = 3 mice). M-R, EPS8 immunoreactivity is detected at the tips of stereocilia in heterozygous mice and also in the tips of the thinner and more disorganized stereocilia of tde mutants (P7, +/tde n = 5, tde/tde n = 4 mice). S-X, PTPRQ expression is found throughout the length of stereocilia in heterozygous mice and a broadly similar distribution is also observed in tde mutants (P12, +/tde n = 4, tde/tde n = 1 mice). Scale bars: 5 μm.
Fig 5
Fig 5. Mechanoelectrical transducer currents in Tasmanian devil inner hair cells.
A and B, Saturating transducer current recordings from an apical-coil control (A; +/+) and a mutant (B; tde/tde) P7 OHC in response to a sinusoidal force stimulus of 50 Hz to the hair bundles. The fluid jet driver voltage (DV) of ± 40 V is shown in the top panels (negative deflections of the DV are inhibitory). OHC membrane potential was held at −81 mV and depolarized in 20 mV increments from −121 mV (for clarity only responses to −121 mV and +99 mV are shown). The arrows and arrowheads indicate the closure of the transducer channels, i.e. disappearance of the resting current, during inhibitory bundle displacements. Dashed lines indicate the current at the different test potentials. Note that there is no or very little resting transducer current in the tde/tde OHC at either potential. In controls the resting current increases with membrane depolarization. C, Peak-to-peak transducer current-voltage curves were obtained from 4 control and 5 mutant OHCs (P7) in 1.3 mM extracellular Ca2+. The data were fit according Eq 2 (see Methods) with values: control k = 405 ± 25, Vr = 0.1 ± 0.5 mV, Vs = 40 ± 2 mV, and γ = 0.43 ± 0.01; mutant k = 266 ± 23, Vr = -2.1 ± 1.0 mV, Vs = 43 ± 3 mV, and γ = 0.43 ± 0.01. D, Step deflections of the OHC hair bundle (fluid jet driver voltages are shown in the top panel) elicited transducer currents recorded at –81 mV from a control (+/+) and a mutant (tde/tde) OHC. Excitatory bundle deflection (positive DV) elicited inward transducer currents that declined or adapted over time in control and mutant OHCs (black arrows). Inhibitory bundle deflection (negative driver voltage and grey current traces) turned off the resting transducer current (indicated by the dashed lines) in control cells but this was almost negligible in tde/tde cells. The transducer current in both control and mutant OHCs showed evidence of rebound adaptation (grey arrowheads) upon termination of the inhibitory stimulus. E, Saturating transducer currents recorded at a holding potential of −121 mV (fluid jet driver voltage above) from a control (+/+) and a mutant (tde/tde) OHC in the presence of 1.3 mM (black traces) and 0.04 mM (endolymph-like; red traces) extracellular Ca2+. For comparison the baseline current has been zeroed in both cells so the resting transducer current is now the difference between zero (dashed line) and the positive current during negative bundle stimulation (arrows). F and G, Maximal transducer current size at the membrane potential (F) and resting transducer channel Popen (G) at −121 mV in control and tde/tde OHCs in the presence of 1.3 mM and 0.04 mM extracellular Ca2+. Resting Popen was calculated as the ratio between resting and maximal transducer currents. Recordings were made at room temperature.
Fig 6
Fig 6. IHC current and voltage responses in Tasmanian devil mice.
A and B, Spontaneous Ca2+ dependent action potentials recorded from a control (A: black line) and a tde/tde (B: red line) P5 IHC. C and D, Currents from a control and a tde/tde adult P21 IHC, respectively, were elicited by depolarizing voltage steps in 10 mV nominal increments from –154 mV to the various test potentials shown by some of the traces; the holding potential was –64 mV. The insets show the same current recordings on an expanded scale (first 25 ms), note that the rapidly activating IK,f is only present in control cells whereas an inward current (ICa) precedes the activation of the much slower K+ current (IK) in tde/tde IHCs. E and F, Voltage responses induced by depolarizing current injections (the level is indicated to the right of the traces) applied to a control and a tde/tde adult IHC, respectively. Note that the tde/tde IHC showed a large initial spike followed by membrane potential oscillations compared to the graded responses of the control cell. G and H, Membrane currents recorded from an adult control and tde/tde IHC, respectively, in response to a hyperpolarizing and a depolarizing voltage step from the holding potential, before (black/red traces) and during superfusion of 100 μM ACh (blue traces). Current responses were obtained at room temperature while voltage recordings were made at body temperature.
Fig 7
Fig 7. The properties of exocytosis in Tasmanian devil IHCs.
A, ICa and ΔCm responses from adult control and tde/tde IHCs. Recordings were obtained in response to 50 ms voltage steps, in 10 mV increments, from −81 mV. For clarity, only maximal responses are shown. B, Average peak ICa-voltage (left axis) and ΔCm-voltage (right axis) curves from control (P18, n = 4) and tde/tde (P18, n = 4) IHCs. C, Maximal peak ICa (top panel) and ΔCm (bottom panel) values obtained at −11 mV, from control and tde/tde IHCs. D, Synaptic transfer relations obtained by plotting ΔCm against the corresponding ICa between −71 mV and −11 mV (the peak ICa) from panel B, showing that tde/tde IHCs exhibited larger ICa values and a steeper Ca2+ dependence of exocytosis than control cells. Fits are according to eqn.1 (see Methods). The panels on the left show average ΔCm traces from all control and tde/tde IHCs, the membrane potential is indicated next to the traces. Recordings were made at body temperature.
Fig 8
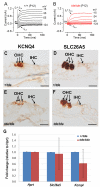
Fig 8. OHC development is affected in Tasmanian devil homozygous mice.
A and B, K+ currents recorded from mature control and tde/tde OHCs, respectively, elicited by depolarizing voltage steps from –124 mV to –15 mV in 10 mV nominal increments from the holding potential of –84 mV. Control cells showed a large negatively activating K+ current characteristic of adult OHCs, IK,n, whereas it was much smaller or almost absent in tde/tde OHCs. Recordings were made at room temperature. C-F, Expression of KCNQ4 and SLC26A5 observed using immunohistochemistry at P12 shows strong labelling in OHCs. G, Quantitative real-time PCR on cDNA generated from Hprt normalized total RNA from whole inner ear at P12 (n = 4 tde/tde; n = 2 +/tde). Kcnq4 and Slc26a5 are both down-regulated in tde/tde mutant mice compared to controls but neither difference is statistically significant (P>0.05, Wilcoxon rank sum test). Technical replicates (3 for each sample) showed minimal variation, but samples were more variable. Error bars represent standard deviations.

Similar articles

Cited by

References

    1. Barr-Gillespie PG Assembly of hair bundles, an amazing problem for cell biology. Mol Biol Cell 2015;26: 2727–2732. doi: 10.1091/mbc.E14-04-0940 - DOI - PMC - PubMed
    1. Tilney LG, Tilney MS, DeRosier DJ Actin filaments, stereocilia, and hair cells: how cells count and measure. Annu Rev Cell Biol 1992;8: 257–274. doi: 10.1146/annurev.cb.08.110192.001353 - DOI - PubMed
    1. DeRosier DJ & Tilney LG. F-actin bundles are derivatives of microvilli: What does this tell us about how bundles might form? J Cell Biol 2000;148, 1–6. - PMC - PubMed
    1. Goodyear RJ, Marcotti W, Kros CJ, Richardson GP Development and properties of stereociliary link types in hair cells of the mouse cochlea. J Comp Neurol 2005;485: 75–85. doi: 10.1002/cne.20513 - DOI - PubMed
    1. Pickles JO, Comis SD, Osborne MP Cross-links between stereocilia in the guinea pig organ of Corti, and their possible relation to sensory transduction. Hear Res 1984;15: 103–112. doi: 10.1016/0378-5955(84)90041-8 - DOI - PubMed