. 2022 Feb 28:11:e74338.
doi: 10.7554/eLife.74338.

Global and context-specific transcriptional consequences of oncogenic Fbw7 mutations

Affiliations

Global and context-specific transcriptional consequences of oncogenic Fbw7 mutations

H Nayanga Thirimanne et al. Elife. .

Abstract

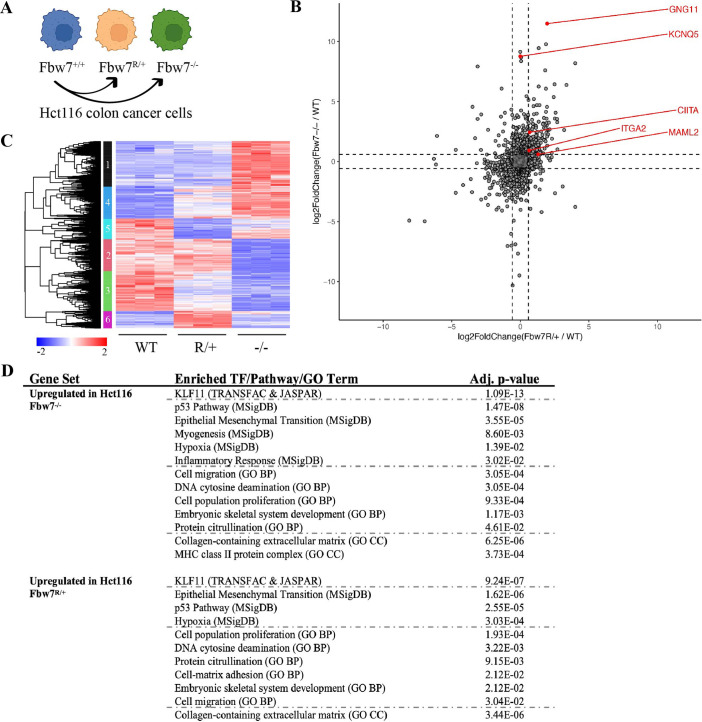
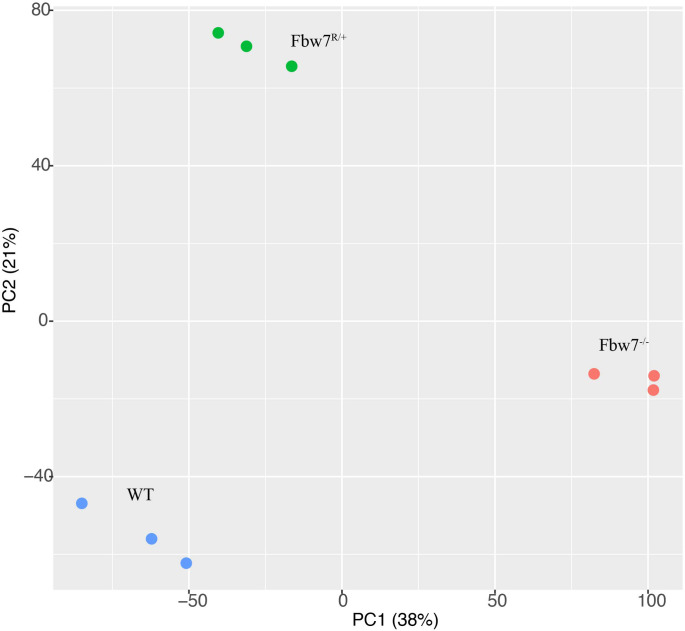
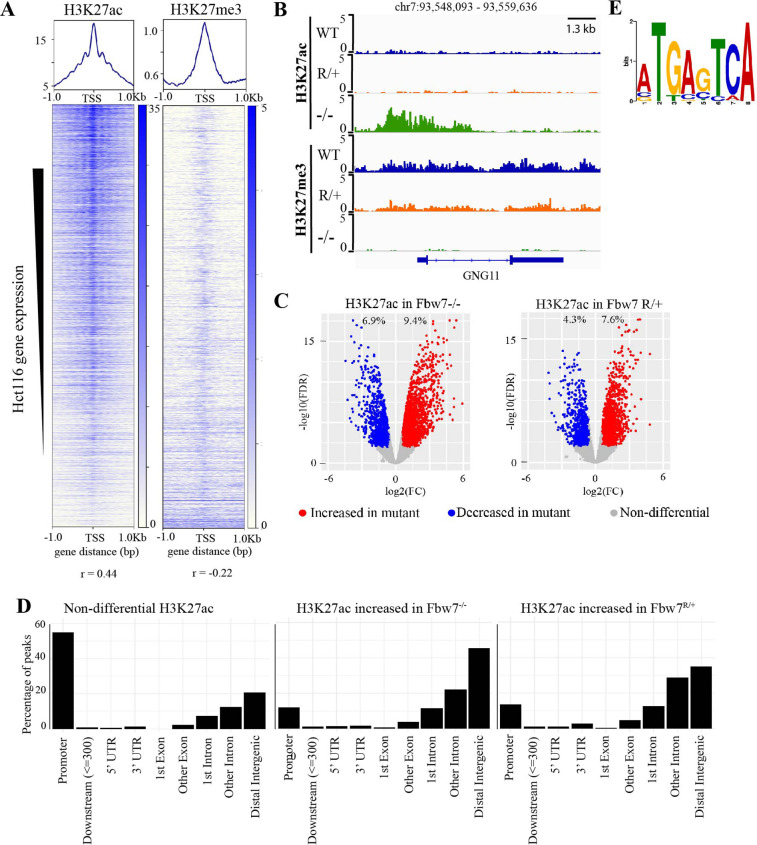
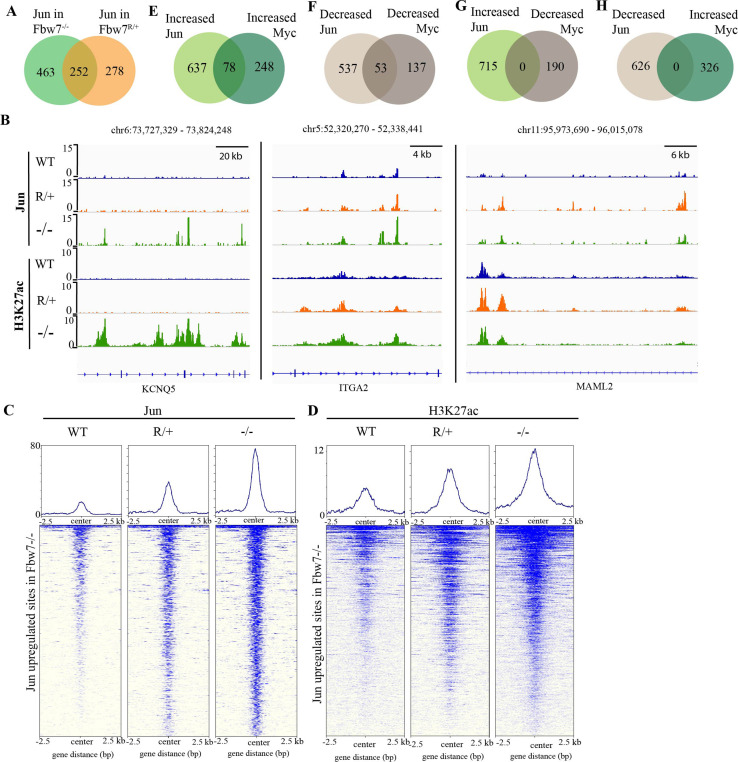
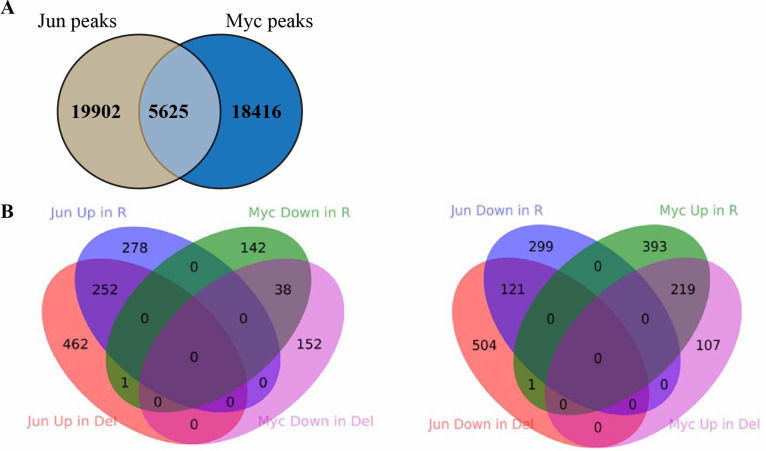
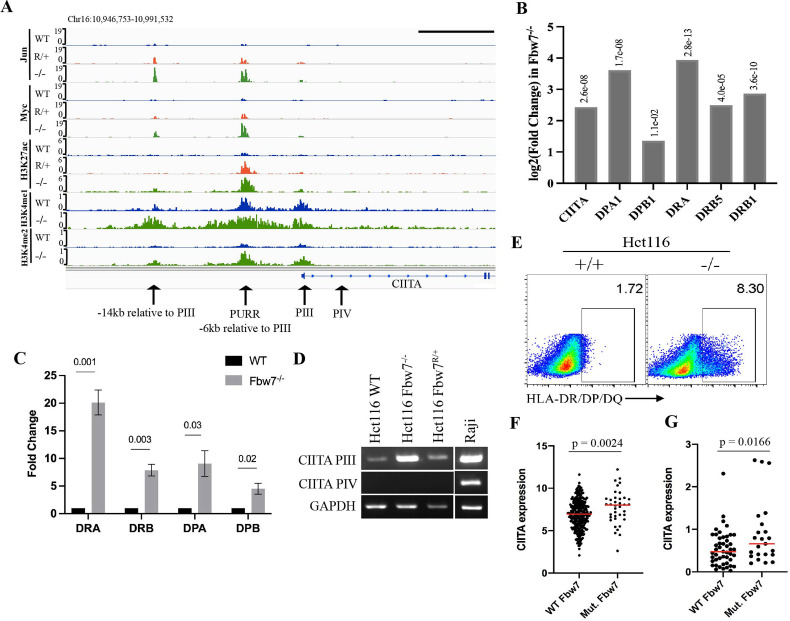
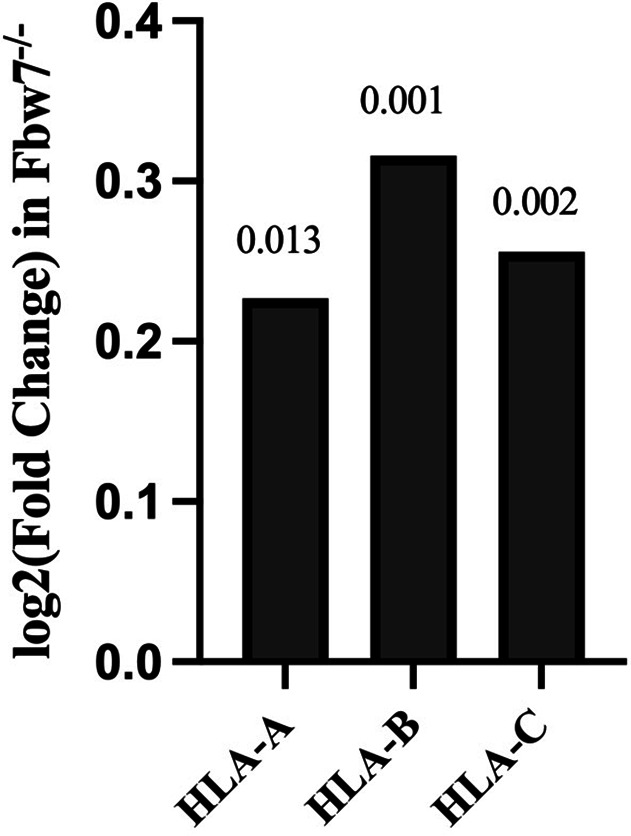
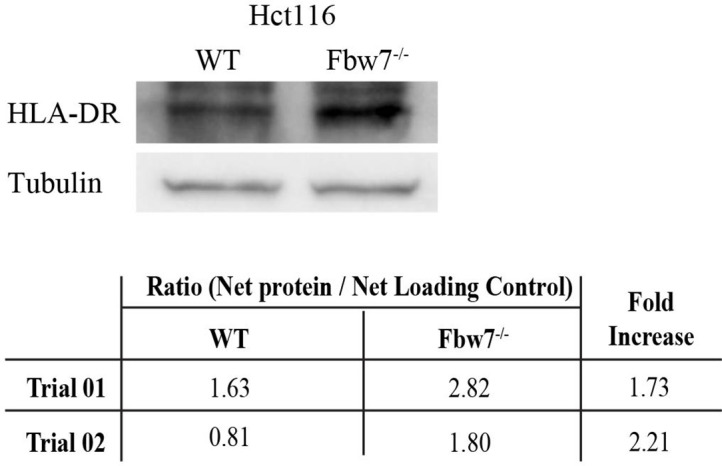
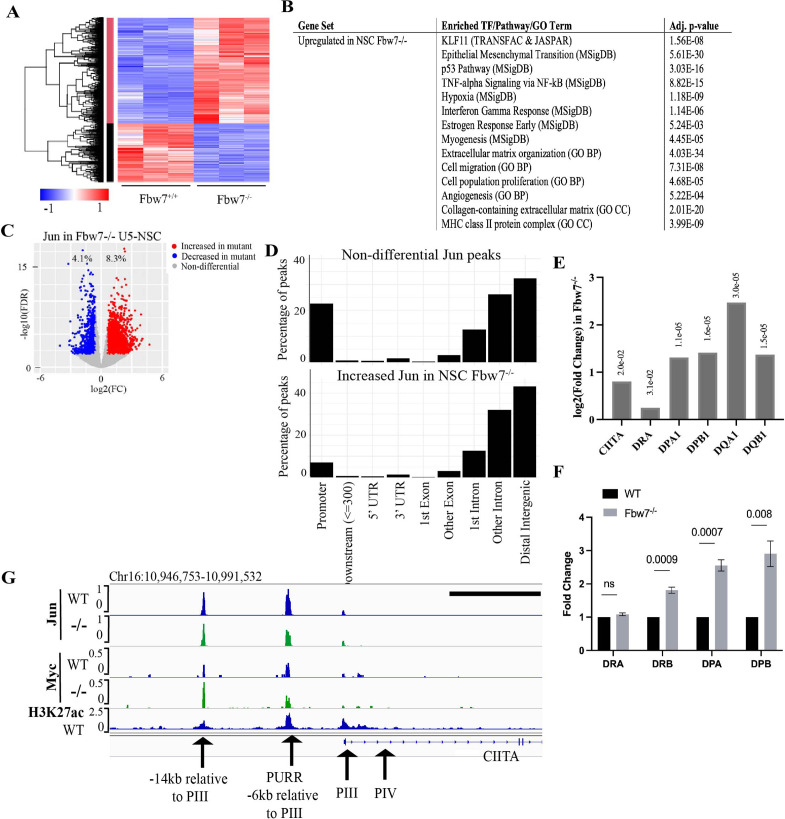
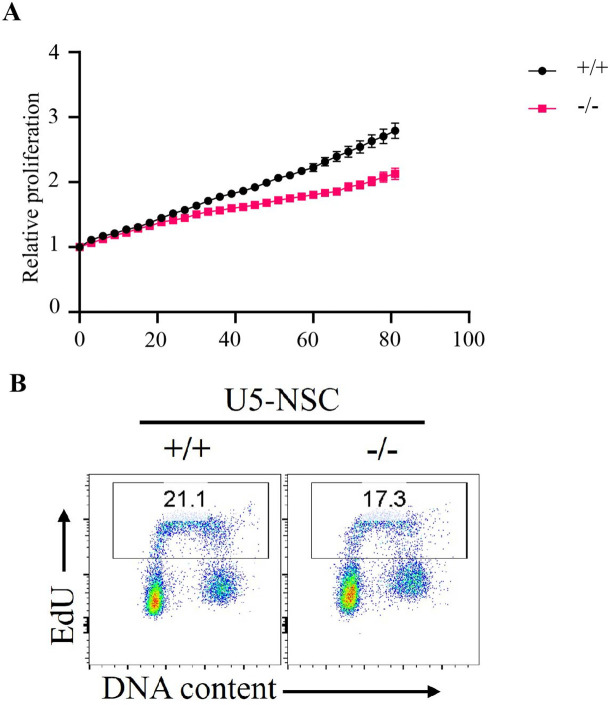
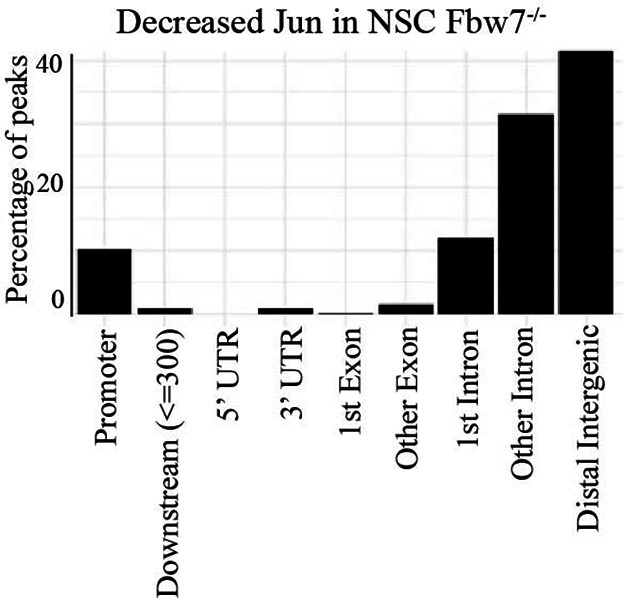
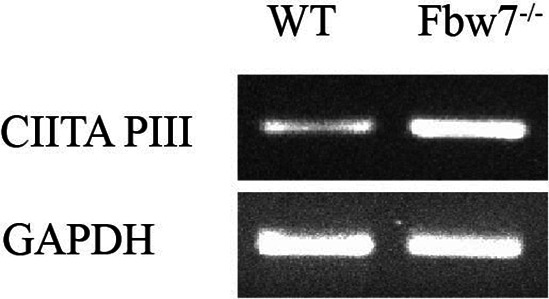
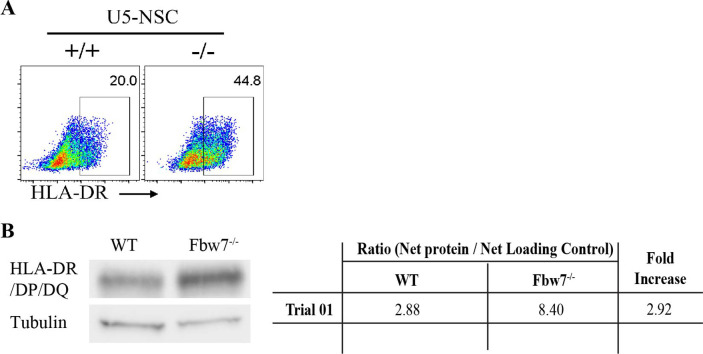
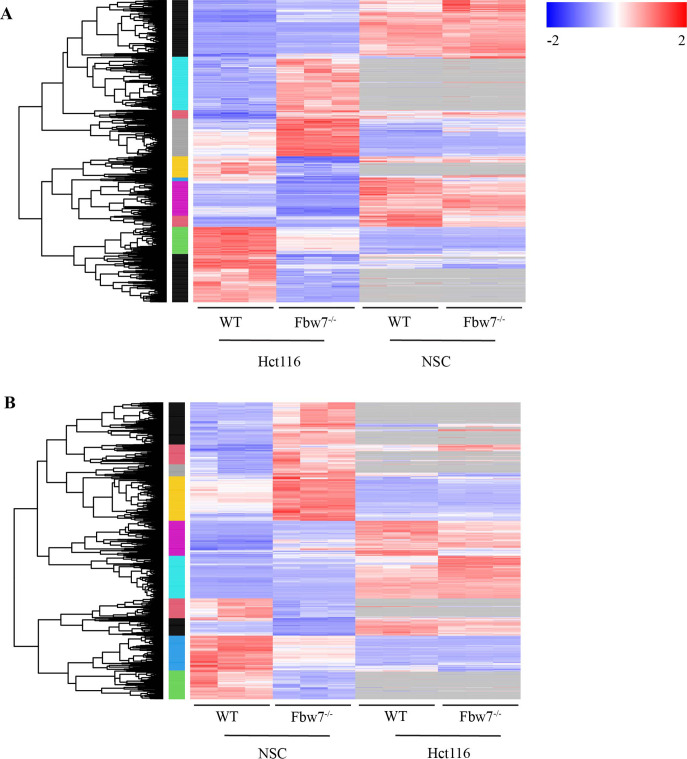
The Fbw7 ubiquitin ligase targets many proteins for proteasomal degradation, which include oncogenic transcription factors (TFs) (e.g., c-Myc, c-Jun, and Notch). Fbw7 is a tumor suppressor and tumors often contain mutations in FBXW7, the gene that encodes Fbw7. The complexity of its substrate network has obscured the mechanisms of Fbw7-associated tumorigenesis, yet this understanding is needed for developing therapies. We used an integrated approach employing RNA-Seq and high-resolution mapping (cleavage under target and release using nuclease) of histone modifications and TF occupancy (c-Jun and c-Myc) to examine the combinatorial effects of misregulated Fbw7 substrates in colorectal cancer (CRC) cells with engineered tumor-associated FBXW7 null or missense mutations. Both Fbw7 mutations caused widespread transcriptional changes associated with active chromatin and altered TF occupancy: some were common to both Fbw7 mutant cell lines, whereas others were mutation specific. We identified loci where both Jun and Myc were coregulated by Fbw7, suggesting that substrates may have synergistic effects. One coregulated gene was CIITA, the master regulator of MHC Class II gene expression. Fbw7 loss increased MHC Class II expression and Fbw7 mutations were correlated with increased CIITA expression in TCGA colorectal tumors and cell lines, which may have immunotherapeutic implications for Fbw7-associated cancers. Analogous studies in neural stem cells in which FBXW7 had been acutely deleted closely mirrored the results in CRC cells. Gene set enrichment analyses revealed Fbw7-associated pathways that were conserved across both cell types that may reflect fundamental Fbw7 functions. These analyses provide a framework for understanding normal and neoplastic context-specific Fbw7 functions.

Keywords: Fbw7; Jun; Myc; cancer biology; chromatin; chromosomes; gene expression; human; transcription factors; ubiquitin.


Conflict of interest statement

HT, FW, DJ, JS, AD, HF, RA, RG, PP, SH, BC No competing interests declared

Figures

Figure 1.
Figure 1.. RNA-Seq reveals differential gene expression in Hct116 Fbw7−/− and Fbw7R/+ cells.
(A) Genetically engineered isogenic cell lines used in the study: Hct116 wild-type (WT), Fbw7−/−, and Fbw7R/+. (B) Differentially expressed (DE) protein-coding genes (represented by each dot) in Fbw7−/− or Fbw7R/+ (FDR<0.05). Dashed lines mark log2FC=0.6. (C) Hierarchical clustering of DE protein-coding genes. The heatmap shows the intensity of expression of each gene (y-axis) for three replicates per cell type (x-axis). Three replicates per cell type were included. Replicates for each genotype were from a single clone, however from separately cultured samples. (D) Transcription factors, pathways (MSigDB), and GO terms that were enriched in genes upregulated in Fbw7−/− and Fbw7R/+ Hct116 cells. Detailed output of differential expression analysis, hierarchical clustering, and Enrichr analysis are provided as Figure 1—source data 1, Figure 1—source data 2, Figure 1—source data 3, respectively. See Figure 1—figure supplement 1 for the PCA of Hct116 RNA-Seq and Figure 1—figure supplement 2 for cell proliferation data. GO, gene ontology; PCA, principal component analysis.
Figure 1—figure supplement 1.
Figure 1—figure supplement 1.. Principal component analysis (PCA) of RNA-Seq from Hct116 cells.
Hct116 wild-type (WT), Fbw7−/−, and Fbw7R/+ samples separate by genotype. Replicates from each condition are clustered together.
Figure 1—figure supplement 2.
Figure 1—figure supplement 2.. Proliferation of Fbw7 mutant Hct116 cells.
(A) Cell proliferation was monitored with an IncuCyte for 75 hr. Data are shown as mean ± SEM. Proliferation was measured at each time point normalized to percent confluence at time 0. Doubling time, WT 20.9 hr, Fbw7R/+ 24.9 hr, and Fbw7−/− 25.9 hr. (B) Flow cytometry analysis of DNA replication in Fbw7 mutant cells. Density plots of EdU versus DNA content (DAPI) in Hct116 cells. Single cells were identified by gating events on DAPI-H/DAPI-A. Cells were labeled with EdU prior to harvest and were later fixed and immuno-stained for flow cytometry. WT, wild-type.
Figure 2.
Figure 2.. Differential H3K27ac signal in Hct116 Fbw7 mutant cells reveal genomic sites targeted by Fbw7.
(A) Heatmaps showing the correlation between CUT&RUN profiles of H3K27ac and H3K27me3, and RNA-Seq in Hct116 WT cells. (B) Genome browser view of H3K27ac and H3K27me3 signal from Hct116 WT, Fbw7R/+, and Fbw7−/− cells at a representative gene. (C) Peaks with increased (red) or decreased (blue) H3K27ac signal in Hct116 Fbw7−/− and Fbw7R/+ cells compared to WT cells. Differential sites indicated as a percent of total H3K27ac peaks in Hct116 WT cells. (D) Percentage of H3K27ac peaks located within different gene regions. (E) Sequence logo for AP-1 motif enriched in H3K27ac peaks increased in Fbw7−/− cells (E value=1.6e−3). See Figure 2—figure supplement 1, Figure 2—figure supplement 2, Figure 2—source data 1 and Figure 2—source data 2. Figure 2—figure supplement 3 has the complete MEME output and details on the FIMO analysis. CUT&RUN, cleavage under target and release using nuclease; WT, wild-type.
Figure 2—figure supplement 1.
Figure 2—figure supplement 1.. Hierarchically clustered correlation matrix of H3K27ac CUT&RUN profiles in Hct116 cells.
Correlation matrix of three replicates from Hct116 WT, Fbw7−/− (Del), and Fbw7R/+ (R) cells. IgG negative control for each cell type included. Peaks from the three cell types were merged to create a final peak-set to perform the correlation analysis. CUT&RUN, cleavage under target and release using nuclease; WT, wild-type.
Figure 2—figure supplement 2.
Figure 2—figure supplement 2.. Percentage of peaks with decreased H3K27ac signal located within different gene features.
Compared to nondifferential H3K27ac peaks, differential H3K27ac peaks enrich mostly within introns and intergenic regions (p<0.0001, Fisher test).
Figure 2—figure supplement 3.
Figure 2—figure supplement 3.. Complete output of the MEME-ChIP analysis on H3K27ac differential sites.
(A) MEME-ChIP analysis on the sequences of H3K27ac increased sites in Fbw7−/− cells. (B) MEME-ChIP analysis on the sequences of nondifferential H3K27ac sites in Fbw7−/− cells (negative control, 1409 sites). *FIMO analysis revealed that AP-1 motif was enriched in approximately 30%–35% of H3K27ac sites that were decreased in Fbw7−/− (p<1.8e−5), increased in Fbw7R/+ (30.2%; p=1.8e−5), decreased in Fbw7R/+ (35%; p<1.5e−5); however, only 17% in nondifferential sites (1409 sites) (p<1.8e−5).
Figure 3.
Figure 3.. Fbw7 preferentially regulates Jun and Myc DNA occupancy at distal regulatory regions.
(A) Fbw7 abundance in chromatin (C) and soluble (S) fractions from Hct116 WT, Fbw7R/+, and Fbw7R/R cells. Histone H3 was detected in chromatin fractions. (B) Increased (red) and decreased (blue) Jun and Myc sites in Hct116 Fbw7−/− and Fbw7R/+ cells compared to WT. (C) Nondifferential and differential Jun and Myc peaks located within gene features. (D) H3K27ac and H3K4me1 CUT&RUN signal from Hct116 WT and Fbw7−/− cells mapped on genomic sites that have increased Jun occupancy in Fbw7−/− cells. (E) Schema depicting the filtering criteria applied to the annotated differential sites to select gene proximal sites. (F) Transcription of genes with increased or decreased Jun bound at a gene proximal site. (Each row is a gene and three replicates each from Hct116 WT and Fbw7−/− cells are shown. Replicates for each genotype were from a single clone, however from separately cultured samples.) See Figure 3—figure supplements 1–4 and Figure 3—source data 1–2. CUT&RUN, cleavage under target and release using nuclease; WT, wild-type.
Figure 3—figure supplement 1.
Figure 3—figure supplement 1.. Fbw7 abundance in chromatin (C) and soluble (S) fractions from Hct116 WT, Fbw7R/+, and Fbw7R/R cells treated with and without Bortezomib.
WT, wild-type.
Figure 3—figure supplement 2.
Figure 3—figure supplement 2.. Validation of Jun and Myc CUT&RUN profiles.
(A) Hierarchically clustered correlation matrix of Jun and Myc signal mapped in Hct116 WT, Fbw7−/− (Del), and Fbw7R/+ (R) cells. IgG negative control for each cell type included. Peaks from the three cell types were merged to create a final peak-set. (B) Sequence logo of the AP-1 motif enriched in the center 100-bp sequence of Jun peaks in Hct116 WT (E value=1.3e−53) and sequence logo of E-box motif enriched in the center 100-bp sequence of Myc peaks in Hct116 WT (1.7e−4). AP-1 motif was input to FIMO to scan for the motif in full sequence of 25,527 Jun peaks in Hct116 WT. FIMO output showed that motifs with score between 15.73 and 12.11 occurred 26,547 times (p<6.46e−05). E-box motif was input to FIMO to scan for the motif in full sequence of 24,111 Myc peaks in Hct116 WT. FIMO output showed that motifs with score between 15.32 and 9.24 occurred 9343 times (p<0.00024). Motif score range was determined by the exact similarity to TGAG/CTCA (AP-1 motif) or CACGTG (E box). CUT&RUN, cleavage under target and release using nuclease; WT, wild-type.
Figure 3—figure supplement 3.
Figure 3—figure supplement 3.. Percentage of Myc and Jun peaks located at different gene features.
Figure 3—figure supplement 4.
Figure 3—figure supplement 4.. Transcription of genes with differential promoter-proximal Myc and Jun occupancy in Fbw7 mutant cells.
Hierarchically clustered genes showing the transcription of genes that have increased or decreased Myc and Jun occupancy at gene proximal sites in Fbw7−/− and Fbw7R/+ cells.
Figure 4.
Figure 4.. Fbw7 exhibits mutation-type specific regulation and coordinate regulation of multiple TFs.
(A) The overlap between peaks with increased Jun in Fbw7−/− and Fbw7R/+ cells. (B) Genome browser view of Jun and H3K27ac occupancy in Hct116 WT, Fbw7−/−, and Fbw7R/+ cells at representative loci. Black arrows point to peaks with increased signal uniquely in Fbw7−/− (KCNQ5), in both Fbw7−/− and Fbw7R/+ (intermediate level in Fbw7R/+) (ITGA2) and increased in Fbw7R/+ than in Fbw7−/− (MAML2). (C, D) Heatmap of Jun and H3K27ac signal from each cell type mapped on sites with increased Jun in Fbw7−/− cells. (E–H) (E) the overlap between peaks with increased Jun and Myc, (F) decreased Jun and Myc, (G) increased Jun and decreased Myc, and (H) decreased Jun and increased Myc in Fbw7−/− cells. See Figure 4—figure supplement 1. TF, transcription factor; WT, wild-type.
Figure 4—figure supplement 1.
Figure 4—figure supplement 1.. Comparison between Jun and Myc peaks in Hct116 cells.
(A) The overlap between Jun and Myc peaks in Hct116 WT cells (p<0.0001, Fisher test). (B) The overlap between peaks with increased Jun occupancy in Fbw7−/− and Fbw7R/+ cells, and decreased Myc occupancy in Fbw7−/− and Fbw7R/+ cells. (C) The overlap between decreased Jun occupancy in Fbw7−/− and Fbw7R/+ cells, and increased Myc occupancy in Fbw7−/− and Fbw7R/+ cells.
Figure 5.
Figure 5.. Fbw7 regulates the expression of MHC Class II genes.
(A) Genome browser view of TFs and histone modification marks enriched at the promoter and regulatory sites upstream of CIITA gene. Arrows point to (from right to left): PIV (promoter of isoform IV); PIII (promoter of isoform III); PURR (PIII Upstream Regulatory Regions)—a known regulatory site 6-kb upstream of PIII; and a known regulatory site 14-kb upstream to PIII. Black scale bar=10 kb. (B) Expression fold change of CIITA and MHC Class II genes in Hct116 Fbw7−/− with respect to WT cells. FDR values are indicated on top of each bar. n=3. (C) Quantitative RT-PCR analysis of MHC Class II (HLA-DRA, HLA-DRB, HLA-DPA, and HLA-DPB) expression in Hct116 Fbw7−/− cells. Mean fold change in Fbw7−/− cells with respect to WT cells. Error bars=SEM, n=3. (D) CIITA isoforms III and IV amplified using isoform specific primers in Hct116 and Raji cells. (E) Flow cytometry analysis of HLA-DR/DP/DQ protein expression in Hct116 cells. (F) CIITA expression in primary cancer samples from TCGA COADREAD data sets that have WT Fbw7 (n=297) and mutated Fbw7 (n=43). (G) CIITA expression in colon and rectal cancer cell lines with WT Fbw7 (n=47) and mutated Fbw7 (n=23). Data collected from DepMap portal. See Figure 5—figure supplement 1, Figure 5—figure supplement 2 and Figure 5—source data 1–4. TF, transcription factor; WT, wild-type.
Figure 5—figure supplement 1.
Figure 5—figure supplement 1.. Expression fold change of MHC Class I genes in Hct116 Fbw7−/− with respect to WT cells.
FDR values are indicated at top of each bar (n=3). WT, wild-type.
Figure 5—figure supplement 2.
Figure 5—figure supplement 2.. MHC Class II protein expression in Hct116 cells.
Western blot detecting HLA-DR in Hct116 cells. Protein intensity of HLA-DR band was measured using ImageJ in comparison to the loading control. HLA-DR protein is ~2-fold higher in Fbw7−/− cells in comparison to WT (n=2). WT, wild-type.
Figure 6.
Figure 6.. Transcriptional consequences of loss of Fbw7 in neural stem cells.
(A) Clustering analysis separates differentially expressed protein-coding genes in NSCs into two groups. Heatmap shows the intensity of expression of each gene (y-axis) for three replicates per cell type (x-axis). Three replicates were from two independently engineered cell samples. (B) TFs, pathways, and GO terms enriched in upregulated genes in Fbw7−/− NSCs. (C) Sites with increased (red) and decreased (blue) Jun in Fbw7−/− NSCs compared to WT. (D) Nondifferential and differential Jun peaks located within each gene feature. (E) Fold change of CIITA and MHC Class II genes in Fbw7−/− NSCs compared to WT. FDR values are given at the top of each bar. n=3. (F) Quantitative RT-PCR analysis of MHC Class II (HLA-DRA, HLA-DRB, HLA-DPA, and HLA-DPB) expression in Fbw7−/− NSCs. Mean fold change in Fbw7−/− cells with respect to WT cells. Error bars=SEM, n=3. (G) Genome browser view of Myc, Jun, and H3K27ac occupancy on CIITA regulatory regions in WT and Fbw7−/− NSCs. Black scale bar=8 kb. See Figure 6—figure supplements 1–3 and Figure 6—source data 1–4, Figure 6—figure supplement 1—source data 1, Figure 6—figure supplement 3—source data 1, Figure 6—figure supplement 5—source data 1. GO, gene ontology; TF, transcription factor; WT, wild-type.
Figure 6—figure supplement 1.
Figure 6—figure supplement 1.. Validation of U5-NSC Fbw7−/− generation and CUT&RUN Jun signal.
(A) Western blot showing Fbw7; samples 1–4: U5 NSCs with sgRNA targeting Fbw7 exons 3, 4, and 9, and all three exons in one pool; samples 5–6: U5 NSCs with control sgRNA 1× and 3×; and sample 7: Hct116 WT. (B) Sequence logo of AP-1 motif enriched in Jun peaks in U5 NSCs (E value=1.2e−146). CUT&RUN, cleavage under target and release using nuclease; NSC, neural stem cell; WT, wild-type.
Figure 6—figure supplement 2.
Figure 6—figure supplement 2.. Proliferation of Fbw7 mutant U5 NSCs.
(A) Cell proliferation was monitored with an IncuCyte for 81 hr. Data are shown as mean ± SEM. Proliferation was measured at each time point normalized to percent confluence at time 0. Doubling time, WT 61.3 hr and Fbw7−/− 88.82 hr. (B) Flow cytometry analysis of DNA replication in Fbw7 mutant cells. Density plots of EdU versus DNA content (DAPI) in NSCs. Single cells were identified by gating events on DAPI-H/DAPI-A. Cells were labeled with EdU prior to harvest and were later fixed and immuno-stained for flow cytometry. NSC, neural stem cell; WT, wild-type.
Figure 6—figure supplement 3.
Figure 6—figure supplement 3.. Percentage of peaks with decreased Jun in U5 NSC Fbw7−/− within different gene regions.
NSC, neural stem cell.
Figure 6—figure supplement 4.
Figure 6—figure supplement 4.. CIITA isoform III amplified using isoform specific primers in U5 NSCs.
NSC, neural stem cell.
Figure 6—figure supplement 5.
Figure 6—figure supplement 5.. MHC Class II protein expression in Hct116 cells.
(A) Flow cytometry analysis of HLA-DR in Fbw7 mutant NSCs. Density plots of side scatter (SSC) versus PE HLA-DR. (B) Western blot detecting HLA-DR/DP/DQ in NSCs. Protein intensity of HLA band was measured using ImageJ in comparison to the loading control. HLA protein is ~3-fold higher in Fbw7−/− cells in comparison to WT. NSC, neural stem cell; WT, wild-type.
Figure 6—figure supplement 6.
Figure 6—figure supplement 6.. Comparison of differentially expressed (DE) genes in Hct116 and NSCs.
(A) Hierarchical clustering of DE protein-coding genes in Hct116. Expression level of the same genes in NSCs is also mapped. Genes that are not captured in NSC are in gray. Log2FC of DE genes specific to Hct116 cells was higher than the DE genes shared by both Hct116 and NSCs (Wilcoxon test: p=5.33e−16). (B) Hierarchical clustering of DE protein-coding genes in NSC. Expression level of the same genes in Hct116 cells is also mapped. Log2FC of DE genes specific to NSCs was higher than the DE genes shared by both Hct116 and NSCs (Wilcoxon test: p=3.727e−10). NSC, neural stem cell.

Similar articles

Cited by

References

    1. Axelrod ML, Cook RS, Johnson DB, Balko JM. Biological Consequences of MHC-II Expression by Tumor Cells in Cancer. Clinical Cancer Research. 2019;25:2392–2402. doi: 10.1158/1078-0432.CCR-18-3200. - DOI - PMC - PubMed
    1. Bailey TL, Boden M, Buske FA, Frith M, Grant CE, Clementi L, Ren J, Li WW, Noble WS. MEME SUITE: tools for motif discovery and searching. Nucleic Acids Research. 2009;37:W202–W208. doi: 10.1093/nar/gkp335. - DOI - PMC - PubMed
    1. Barretina J, Caponigro G, Stransky N, Venkatesan K, Margolin AA, Kim S, Wilson CJ, Lehár J, Kryukov GV, Sonkin D, Reddy A, Liu M, Murray L, Berger MF, Monahan JE, Morais P, Meltzer J, Korejwa A, Jané-Valbuena J, Mapa FA, Thibault J, Bric-Furlong E, Raman P, Shipway A, Engels IH, Cheng J, Yu GK, Yu J, Aspesi P, Jr, de Silva M, Jagtap K, Jones MD, Wang L, Hatton C, Palescandolo E, Gupta S, Mahan S, Sougnez C, Onofrio RC, Liefeld T, MacConaill L, Winckler W, Reich M, Li N, Mesirov JP, Gabriel SB, Getz G, Ardlie K, Chan V, Myer VE, Weber BL, Porter J, Warmuth M, Finan P, Harris JL, Meyerson M, Golub TR, Morrissey MP, Sellers WR, Schlegel R, Garraway LA. The Cancer Cell Line Encyclopedia enables predictive modelling of anticancer drug sensitivity. Nature. 2012;483:603–607. doi: 10.1038/nature11003. - DOI - PMC - PubMed
    1. Bressan RB, Dewari PS, Kalantzaki M, Gangoso E, Matjusaitis M, Garcia-Diaz C, Blin C, Grant V, Bulstrode H, Gogolok S, Skarnes WC, Pollard SM. Efficient CRISPR/Cas9-assisted gene targeting enables rapid and precise genetic manipulation of mammalian neural stem cells. Development (Cambridge, England) 2017;144:635–648. doi: 10.1242/dev.140855. - DOI - PMC - PubMed
    1. Carrieri FA, Dale JK. Turn It Down a Notch. Frontiers in Cell and Developmental Biology. 2016;4:151. doi: 10.3389/fcell.2016.00151. - DOI - PMC - PubMed

Publication types

MeSH terms

Associated data