. 2022 Feb 28;79(3):160.
doi: 10.1007/s00018-022-04204-6.

Defective repair of topoisomerase I induced chromosomal damage in Huntington's disease

Affiliations

Defective repair of topoisomerase I induced chromosomal damage in Huntington's disease

Nelma M Palminha et al. Cell Mol Life Sci. .

Abstract

Topoisomerase1 (TOP1)-mediated chromosomal breaks are endogenous sources of DNA damage that affect neuronal genome stability. Whether TOP1 DNA breaks are sources of genomic instability in Huntington's disease (HD) is unknown. Here, we report defective 53BP1 recruitment in multiple HD cell models, including striatal neurons derived from HD patients. Defective 53BP1 recruitment is due to reduced H2A ubiquitination caused by the limited RNF168 activity. The reduced availability of RNF168 is caused by an increased interaction with p62, a protein involved in selective autophagy. Depletion of p62 or disruption of the interaction between RNAF168 and p62 was sufficient to restore 53BP1 enrichment and subsequent DNA repair in HD models, providing new opportunities for therapeutic interventions. These findings are reminiscent to what was described for p62 accumulation caused by C9orf72 expansion in ALS/FTD and suggest a common mechanism by which protein aggregation perturb DNA repair signaling.

Keywords: Chromatin ubiquitination; DNA repair; Huntington’s disease; RNF168; TOP1cc; p62/SQSTM1.


Conflict of interest statement

The authors declare no competing/ conflicting interests.

Figures
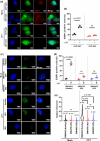
Fig. 1
Fig. 1
Expression of mutant huntingtin drives deficient 53BP1 recruitment in response to DNA damage. MRC5 cells transiently transfected with HTT GFP-tagged plasmids containing either 23 CAG repeats (GFP-Q23: wild-type HTT) or 74 CAG repeats (GFP-Q74: mutant HTT). Cells were treated with either DMSO or 10 µM CPT for 1 h. a Representative images of MRC5 immunostained with 53BP1 are shown (scale bar: 10 µm). b The percentage 53BP1 positive cells (> 5 foci) was quantified and analyzed using Student’s t-test (n = 3, 50 cells per replicate). Error bars represent ± s.e.m. ce GM08402 represents the unaffected individual (healthy). GM04799 (HD: 42 CAG) and GM04869 (HD: 47 CAG) are fibroblasts retrieved from patients clinically affected with Huntington’s disease (HD). All cells were purchased from Coriell Institute. c Representative image showing primary human fibroblasts immunostained with 53BP1 after treatment with 0.5 µM of CPT for 1 h (scale bar: 10 µm). d The percentage average of 53BP1 positive cells (> 5 foci) was quantified and analyzed using Student’s t-test (n = 3, 10 fields per replicate). e Violin-plot showing the number of 53BP1 foci per cell, quantified from three biological experiments and analyzed using Kruskal–Wallis test (10 fields per replicate, ± s.e.m.). Error bars represent ± s.e.m. ns nonsignificant
Fig. 2
Fig. 2
HD patient-derived fibroblasts show increased TOP1cc levels after CPT treatment. a Representative images of primary skin fibroblasts from a healthy individual (GM08402) and a HD patient (GM04799, 42 CAG) after treatment with 10 μM CPT for 10 min and immunostained with a specific antibody against TOP1cc. Scale bar: 10 μm. b The number of TOP1cc foci per cell was quantified and analyzed by Student’s t-test. Data are presented as average of three independent experiments ± s.e.m
Fig. 3
Fig. 3
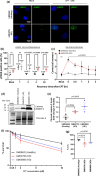
Accumulation of DNA damage compromises cell viability in HD fibroblasts. a Representative images of primary fibroblasts immunostained (Healthy: GM08402; HD: GM04799, 42 CAG) with an anti-γH2AX antibody after treatment with 2 μM CPT for 1 h and recovery in complete medium for 1–24 h (scale bar: 10 µm). b The percentage (%) of γH2AX positive cells (> 10 foci) was quantified for each time point and analyzed by Student’s t-test. Data are shown as average of three independent experiments (10 fields each; N = total number of cells counted). Error bars: ± s.e.m. c Healthy (GM08402) or HD (GM04799) fibroblasts were treated with 60 µM CPT for 30 min then allowed to recover in CPT-free media for 30 min, 1 h, 2 h and 4 h. Double-strand breaks were measured by neutral comet assays and the mean comet tail moments from three independent experiments analyzed by one-way ANOVA with Dunnett’s multiple comparisons test using the healthy fibroblast data as the comparator. d Western blotting analysis of fibroblasts after treatment with 10 μM CPT for 72 h and incubation with a cleaved caspase-3 specific antibody. Ponceau for loading control. e Levels of cleaved caspase-3 normalized against Ponceau. Fold-change relative to healthy cells was calculated and analyzed by Student’s t-test. Error bars: ± s.e.m; n = 3. f Sensitivity to CPT treatment of healthy and HD patient fibroblasts was monitored by CellTiter-Blue® after 96 h treatment with CPT (0–10 µM). Y-axis represent the mean percentage survival (% survival) plotted against CPT concentration (µM) (n = 3). % survival in treated fibroblasts was assessed by normalizing against the corresponding untreated condition (0 µM). Error bars represent ± s.e.m. g The area under the curve (A.U.C.) was calculated and plotted as average of three biological replicates. The data were analyzed by Student’s t-test (error bars: ± s.e.m.). ns nonsignificant
Fig. 4
Fig. 4
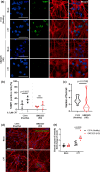
GABAergic neurons from HD patients exhibit decreased 53BP1 signaling and increased activation of the apoptotic marker cleaved caspase-3. a Representative images of GABAergic neurons differentiated from NPCs from a healthy individual (CS14) and a patient with HD (GM23225, 68 CAG) immunostained with an anti-53BP1 antibody after treatment with 0.5 μM CPT or mock (DMSO) for 1 h (scale bar: 50 µm). DAPI shows nuclear staining. MAP2 is a specific marker for neuronal cytoskeleton. b The percentage (%) of 53BP1 positive cells (> 2 foci) was quantified for each time point and analyzed by Student’s t-test. Data are shown as average of three independent experiments. Error bars represent ± s.e.m. c Violin-plot showing the number of 53BP1 foci per cell after treatment with 0.5 μM CPT. d Representative images of GABAergic neurons differentiated from NPCs immunostained with a specific cleaved caspase-3 antibody after treatment with 10 μM CPT or mock (DMSO) for 48 h (scale bar: 50 µm). e The intensity of cleaved caspase-3 signal was quantified and data are shown as average of six technical replicates across two biological experiments and was analyzed by Student’s t-test. Error bars represent ± s.e.m. ns nonsignificant
Fig. 5
Fig. 5
Expression of mutant huntingtin impairs H2A ubiquitylation. a Western blotting of chromatin-bound fractions from MRC5 overexpressed with GFP-Q23 or GFP-Q74 after probing with an antibody against H2A. Bottom band at ~ 17 KDa represents unmodified H2A, showing equal loading. Top band represents ubiquitinated H2A (H2Aub). b Levels of H2Aub, normalized against H2A and presented as percentage (%) of healthy and analyzed by Student’s t-test. (Error bars: ± s.e.m, n = 3). c Chromatin-bound fractions from healthy (GM08402) and HD (GM04869, 47 CAG) fibroblasts were analyzed by western blotting. Bottom band represents unmodified H2A. Top band represents H2Aub. d Levels of H2Aub, normalized against H2A and presented as % of healthy cells. The data were analyzed by Student’s t-test and is shown as means ± s.e.m. (n = 3). e Chromatin-fractions of HEK293 co-transfected with GFP-Q23 or GFP-Q74 and Flag-H2A K5-9-118-119-125-127-129R mutant plasmids (Flag-H2A K13/K15) were subjected to Flag immunoprecipitation (Flag IP) after treatment with 10 μM CPT for 1 h. GFP-empty represents negative control. Flag-H2A K13/15 ubiquitination was detected using a pan-ubiquitin antibody (Fk2). 10% of the lysates were analyzed by Western blotting. GFP-Q23 and GFP-Q74 express similar levels of Flag-H2A K13/K15 (Inputs). f Levels of Fk2 were quantified and normalized against the corresponding Flag-IP signal. Data show means ± s.e.m. (n = 2) and were analyzed by Student’s t-test
Fig. 6
Fig. 6
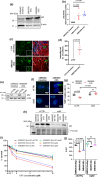
P62 depletion restores 53BP1 signaling and ameliorates hypersensitivity to TOP1 DNA damage. a Whole cell extracts from healthy (GM08402) and HD patient fibroblasts (GM04799, 42 CAG and GM04869, 47 CAG) were analyzed by western blotting using a p62 antibody. Actin was used as loading control. b Fold-change of p62 levels relative to healthy cells was calculated and analyzed by Student’s t-test. Error bars: ± s.e.m, n = 4. c Immunofluorescence images of healthy and HD striatal neurons stained for p62. DAPI shows nuclear staining and MAP2 represents a neuronal marker (scale bar: 10 μm). d Intensity of p62 per cell was quantified and shown as % of healthy. Data were analyzed by Student’s t-test (error bars: ± s.e.m from three technical repeats). e Healthy (GM08402) and HD fibroblasts (GM04869) were transfected with control siRNA particles (siCTRL) or targeting p62 (sip62) and analyzed by western blotting using a p62 antibody. Actin staining shows loading. f 53BP1-immunofluorescence images of healthy and HD fibroblasts transfected with sip62 or siCTRL after treatment with 0.5 μM of CPT for 1 h (scale bar: 10 μm). g The percentage of 53BP1 positive cells (> 5 foci) was quantified and analyzed by One-way ANOVA, followed by post hoc Tukey’s multiple comparisons test (n = 3, ± s.e.m.). h Western blotting analysis of healthy (GM08402) and HD fibroblasts (HD1: GM04799 and HD2: GM04869) after siRNA transfection, using an anti-p62 antibody. Ponceau indicates loading. i Sensitivity to CPT of healthy and HD patient fibroblasts transfected with either siCTRL or sip62 was monitored by CellTiter-Blue® assay after 96 h treatment CPT (0–10 µM). Y-axis: mean percentage survival (% survival) of n = 3 plotted against CPT concentration. % survival was assessed by normalizing against the corresponding untreated condition (0 µM). j The area under the curve (A.U.C.) was calculated for each condition and plotted as average as in [25]. The data were analyzed by Student’s t-test (error bars: ± s.e.m; n = 3). ns nonsignificant
Fig. 7
Fig. 7
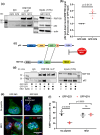
Pharmacological disruption of p62:RNF 168 binding rescues 53BP1 recruitment in response to DNA damage in cells expressing mutant huntingtin. a RNF168 co-immunoprecipitation (RNF168 co-IP) of nuclear fractions of HEK293 co-transfected with GFP-Q23 or GFP-74. Left: Western blotting shows interaction between RNF168 and p62. Right: 10% of lysates were analyzed by western blotting after incubation with anti-RNF168 and anti-p62 antibodies. Actin shows loading control. (Q23: wild-type huntingtin. Q74: mutant huntingtin). b p62 pull-down levels were quantified and normalized to the amount of p62 present in the inputs. This value was normalized against the bait RNF168 levels. The data are shown as fold-change of GFP-Q23. The data were analyzed by Student’s t-test and shown as average ± s.e.m.; n = 3. c Schematic representation of p62 and RNF168 interaction. LB domain of p62 interacts with MIU1 of RNF168. The interaction between p62 and RNF168 is interrupted by a recombinant rhodamine-tagged peptide that mimics MIU1 domain of RNF168. d RNF168 Co-IP was performed in nuclear fractions of HEK293 transfected with GFP-Q23 or GFP-74. Left: Western blot shows the interaction between RNF168 and p62 (lanes 3 and 4). The interaction is perturbed after incubation with 5 μM MIU1 peptide for 24 h (lanes 5 and 6). Right: 10% of lysates were analyzed by western blotting with anti-RNF168 and anti-p62 antibodies. (Q23: wild-type huntingtin. Q74: mutant huntingtin). e MRC5 cells were transfected with GFP-Q23 or GFP-Q74 plasmids and exposed to 5 µM mock (DMSO)/ rhodamine-tagged MIU1. Cells were treated with 10 μM CPT for 1 h and analyzed by immunofluorescence (scale bar: 10 µm). f The percentage 53BP1 positive cells (> 5 foci) were quantified and analyzed by One-way ANOVA, followed by Tukey’s multiple comparisons test. Data are shown as average ± s.e.m; n = 3 (50 GFP-expressing cells/replicate). *p < 0.05; **p < 0.01; ns nonsignificant
Fig. 8
Fig. 8
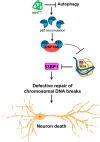
Proposed model showing defective repair of chromosomal DNA breaks in Huntington’s disease. Mutant huntingtin protein (mtHTT) causes defects in autophagy, promoting accumulation of the cargo receptor protein, p62. Increased p62 levels then proceed to inactivate the E3 ubiquitin ligase activity of RNF168 during the repair of chromosomal DNA breaks. This leads to insufficient histone H2AK13/K15 ubiquitination which is necessary for the recruitment of repair factors such as 53BP1. By failing to recruit 53BP1, cells are left with unrepaired damage which lead to premature neuronal death

Similar articles

Cited by

References

    1. Bates GP, Dorsey R, Gusella JF, et al. Huntington disease. Nat Rev Dis Prim. 2015 doi: 10.1038/nrdp.2015.5. - DOI - PubMed
    1. Tabrizi SJ, Ghosh R, Leavitt BR. Huntingtin lowering strategies for disease modification in Huntington’s disease. Neuron. 2019;101:801–819. doi: 10.1016/J.NEURON.2019.01.039. - DOI - PubMed
    1. Lopes C, Aubert S, Bourgois-Rocha F, et al. Dominant-negative effects of adult-onset huntingtin mutations alter the division of human embryonic stem cells-derived neural cells. PLoS ONE. 2016;11:1–16. doi: 10.1371/journal.pone.0148680. - DOI - PMC - PubMed
    1. Suberbielle E, Sanchez PE, Kravitz AV, et al. Physiologic brain activity causes DNA double-strand breaks in neurons, with exacerbation by amyloid-β. Nat Neurosci. 2013;16:613–621. doi: 10.1038/nn.3356. - DOI - PMC - PubMed
    1. Massey TH, Jones L (2018) The central role of DNA damage and repair in CAG repeat diseases. Dis Model Mech 11:dmm031930. 10.1242/dmm.031930 - PMC - PubMed