Links Between N 6-Methyladenosine and Tumor Microenvironments in Colorectal Cancer
- PMID: 35223837
- PMCID: PMC8866562
- DOI: 10.3389/fcell.2022.807129
Links Between N 6-Methyladenosine and Tumor Microenvironments in Colorectal Cancer
Abstract
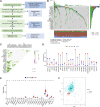
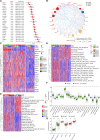
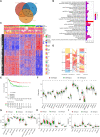
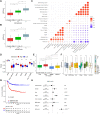
N 6-methyladenosine (m6A) is a critical epigenetic modification for tumor malignancies, but its role in regulating the tumor microenvironments (TMEs) has not been fully studied. By integrating multiple data sets and multi-omics data, we comprehensively evaluated the m6A "writers," "erasers," and "readers" in colorectal cancer and their association with TME characteristics. The m6A regulator genes showed specific patterns in co-mutation, copy number variation, and expression. Based on the transcriptomic data of the m6A regulators and their correlated genes, two types of subtyping systems, m6AregCluster and m6AsigCluster, were developed. The clusters were distinct in pathways (metabolism/inflammation/extracellular matrix and interaction), immune phenotypes (immune-excluded/immune-inflamed/immune-suppressive), TME cell composition (lack immune and stromal cells/activated immune cells/stromal and immune-suppressive cells), stroma activities, and survival outcomes. We also established an m6Ascore associated with molecular subgroups, microsatellite instability, DNA repair status, mutation burdens, and survival and predicted immunotherapy outcomes. In conclusion, our work revealed a close association between m6A modification and TME formation. Evaluating m6A in cancer has helped us comprehend the TME status, and targeting m6A in tumor cells might help modulate the TME and improve tumor therapy and immunotherapy.
Keywords: N6-methyladenosine; colorectal cancer; immunotherapy; molecular classification; tumor microenvironments.
Copyright © 2022 Zhang, Zhang, Gong, Li, Man, Jin, Zhang and Li.
Conflict of interest statement
The authors declare that the research was conducted in the absence of any commercial or financial relationships that could be construed as a potential conflict of interest.
Figures



Similar articles
-
m6A regulator-mediated methylation modification patterns and tumor microenvironment infiltration characterization in gastric cancer.Mol Cancer. 2020 Mar 12;19(1):53. doi: 10.1186/s12943-020-01170-0. Mol Cancer. 2020. PMID: 32164750 Free PMC article.
-
Multi-omics analysis of m6A modification-related patterns based on m6A regulators and tumor microenvironment infiltration in lung adenocarcinoma.Sci Rep. 2021 Oct 22;11(1):20921. doi: 10.1038/s41598-021-00272-z. Sci Rep. 2021. PMID: 34686691 Free PMC article.
-
m6A regulator-based methylation modification patterns characterized by distinct tumor microenvironment immune profiles in colon cancer.Theranostics. 2021 Jan 1;11(5):2201-2217. doi: 10.7150/thno.52717. eCollection 2021. Theranostics. 2021. PMID: 33500720 Free PMC article.
-
N6-Methyladenosine RNA Modification: An Emerging Immunotherapeutic Approach to Turning Up Cold Tumors.Front Cell Dev Biol. 2021 Sep 20;9:736298. doi: 10.3389/fcell.2021.736298. eCollection 2021. Front Cell Dev Biol. 2021. PMID: 34616742 Free PMC article. Review.
-
Progression of m6A in the tumor microenvironment: hypoxia, immune and metabolic reprogramming.Cell Death Discov. 2024 Jul 20;10(1):331. doi: 10.1038/s41420-024-02092-2. Cell Death Discov. 2024. PMID: 39033180 Free PMC article. Review.
Cited by
-
Modulation of host N6-methyladenosine modification by gut microbiota in colorectal cancer.World J Gastroenterol. 2024 Oct 14;30(38):4175-4193. doi: 10.3748/wjg.v30.i38.4175. World J Gastroenterol. 2024. PMID: 39493326 Free PMC article. Review.
-
RNA Modifications Meet Tumors.Cancer Manag Res. 2022 Nov 22;14:3223-3243. doi: 10.2147/CMAR.S391067. eCollection 2022. Cancer Manag Res. 2022. PMID: 36444355 Free PMC article. Review.
-
The Role of N6-Methyladenosine in Inflammatory Diseases.Oxid Med Cell Longev. 2022 Dec 12;2022:9744771. doi: 10.1155/2022/9744771. eCollection 2022. Oxid Med Cell Longev. 2022. PMID: 36578520 Free PMC article. Review.
-
The Potential Value of m6A RNA Methylation in the Development of Cancers Focus on Malignant Glioma.Front Immunol. 2022 May 30;13:917153. doi: 10.3389/fimmu.2022.917153. eCollection 2022. Front Immunol. 2022. PMID: 35711459 Free PMC article. Review.
-
Interaction between N6-methyladenosine modification and the tumor microenvironment in colorectal cancer.Mol Med. 2023 Sep 22;29(1):129. doi: 10.1186/s10020-023-00726-2. Mol Med. 2023. PMID: 37737134 Free PMC article. Review.
References
-
- Becht E., de Reyniès A., Giraldo N. A., Pilati C., Buttard B., Lacroix L., et al. (2016). Immune and Stromal Classification of Colorectal Cancer Is Associated with Molecular Subtypes and Relevant for Precision Immunotherapy. Clin. Cancer Res. 22 (16), 4057–4066. 10.1158/1078-0432.CCR-15-2879 - DOI - PubMed
LinkOut - more resources
Full Text Sources

