. 2022 Feb;10(2):e004346.
doi: 10.1136/jitc-2021-004346.

Tumor-specific T cells support chemokine-driven spatial organization of intratumoral immune microaggregates needed for long survival

Affiliations

Tumor-specific T cells support chemokine-driven spatial organization of intratumoral immune microaggregates needed for long survival

Ziena Abdulrahman et al. J Immunother Cancer. 2022 Feb.

Abstract

Background: The composition of the tumor immune microenvironment (TIME) associated with good prognosis generally also predicts the success of immunotherapy, and both entail the presence of pre-existing tumor-specific T cells. Here, the blueprint of the TIME associated with such an ongoing tumor-specific T-cell response was dissected in a unique prospective oropharyngeal squamous cell carcinoma (OPSCC) cohort, in which tumor-specific tumor-infiltrating T cells were detected (immune responsiveness (IR+)) or not (lack of immune responsiveness (IR-)).

Methods: A comprehensive multimodal, high-dimensional strategy was applied to dissect the TIME of treatment-naive IR+ and IR- OPSCC tissue, including bulk RNA sequencing (NanoString), imaging mass cytometry (Hyperion) for phenotyping and spatial interaction analyses of immune cells, and combined single-cell gene expression profiling and T-cell receptor (TCR) sequencing (single-cell RNA sequencing (scRNAseq)) to characterize the transcriptional states of clonally expanded tumor-infiltrating T cells.

Results: IR+ patients had an excellent survival during >10 years follow-up. The tumors of IR+ patients expressed higher levels of genes strongly related to interferon gamma signaling, T-cell activation, TCR signaling, and mononuclear cell differentiation, as well as genes involved in several immune signaling pathways, than IR- patients. The top differently overexpressed genes included CXCL12 and LTB, involved in ectopic lymphoid structure development. Moreover, scRNAseq not only revealed that CD4+ T cells were the main producers of LTB but also identified a subset of clonally expanded CD8+ T cells, dominantly present in IR+ tumors, which secreted the T cell and dendritic cell (DC) attracting chemokine CCL4. Indeed, immune cell infiltration in IR+ tumors is stronger, highly coordinated, and has a distinct spatial phenotypical signature characterized by intratumoral microaggregates of CD8+CD103+ and CD4+ T cells with DCs. In contrast, the IR- TIME comprised spatial interactions between lymphocytes and various immunosuppressive myeloid cell populations. The impact of these chemokines on local immunity and clinical outcome was confirmed in an independent The Cancer Genome Atlas OPSCC cohort.

Conclusion: The production of lymphoid cell attracting and organizing chemokines by tumor-specific T cells in IR+ tumors constitutes a positive feedback loop to sustain the formation of the DC-T-cell microaggregates and identifies patients with excellent survival after standard therapy.

Keywords: immunotherapy; tumor microenvironment.


Conflict of interest statement

Competing interests: None declared.

Figures
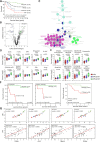
Figure 1
Figure 1
Immune signature of TME impacts survival of patients with OPSCC. (A) Kaplan-Meier survival curves of prospectively followed up cohort of HPV and HPV16+ patients with OPSCC, the latter of whom are also subdivided into those with a tumor-specific T-cell response (HPV16+IR+) and those lacking this immune response (HPV16+IR). (B) Volcano plots of upregulated DEGs identified by NanoString Pancancer IO360 between HPV16+IR+ (right) and HPV16+IR (left). The dotted lines indicate the Benjamini-Hochberg adjusted p<0.05 and p<0.1 thresholds. (C) ClueGo of DEGs (p<0.1) between HPV16+IR+ and HPV16+IR patients, visualizing the pathways in which these genes are involved. (D) Deconvoluted cells by expression of genes predefined for different immune cell types depicted as counts in HPV, HPV16+IR and HPV16+IR+ OPSCC. (E) Differential expression of predefined pathway genes in HPV, HPV16+IR and HPV16+IR+ OPSCC. (F) Kaplan-Meier survival curves based on high/low LTB expression (classification based on median LTB expression), in all patients with OPSCC analyzed by NanoString Pancancer IO360 (n=21), in the HPV16+ patients within this cohort (n=13) and in a large independent TCGA cohort of HPV16+ OPSCC (n=69). (G) Linear regression analyses of top upregulated DEG LTB in HPV16+IR+ compared with HPV16+IR OPSCC versus cell-type profiles of CD8 (CD8A), CD4, Tbet+ T cells (TBX21) and DC (ITGAX, CD11c) both for this cohort (n=21, upper panel) and the TCGA cohort of HPV16+ OPSCC (n=69, lower panel). HPV (red), HPV16+IR (blue) and HPV16+IR+ (green). DC, dendritic cell; DEG, differentially expressed gene; HPV, human papillomavirus; IR+, immune responsiveness; IR, lack of immune responsiveness; OPSCC, oropharyngeal squamous cell carcinoma; TCGA, The Cancer Genome Atlas; TME, tumor microenvironment.
Figure 2
Figure 2
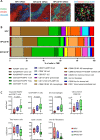
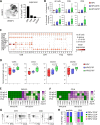
Imaging mass cytometry identifies cell clusters present in different percentages across OPSCC subgroups. (A) Representative images of immune cell infiltrate in the context of the microenvironment of OPSCC, as found in the three distinct subgroups (HPV, HPV16+IR, and HPV16+IR+), visualizing the spatial location of immune cells (CD45ro in green) in the tumor epithelium (keratin in red) and stroma (vimentin in blue) regions. A selection of both lymphoid and myeloid cell markers in the same image is also shown. (B) Fractional composition of the TME of the three OPSCC subgroups, depicting the median percentage of the 18 sc. (C) Box plots visualizing the quantitative cell counts in the whole tumor of the most differential sc across the three OPSCC subgroups: HPV red (n=5), HPV16+IR blue (n=4), and HPV16+IR+ green (n=11). HPV, human papillomavirus; IR+, immune responsiveness; IR, lack of immune responsiveness; OPSCC, oropharyngeal squamous cell carcinoma; sc, superclusters; TME, tumor microenvironment.
Figure 3
Figure 3
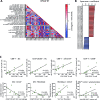
A coordinated and diverse immune infiltrate in HPV16+IR+ patients. (A) Spearman quantitative correlation heatmaps of the 28 sc (18 mutually exclusive and 10 non-mutually exclusive) in the whole tumor in HPV16+IR+ OPSCC (n=11). The empty line separates mutually exclusive sc (above the crossed line) from the non-mutually exclusive sc (below the crossed line). (B) Waterfall plot of statistically significant (p<0.01) Spearman correlations between the 28 sc (defined in online supplemental table 5) in HPV16+IR+ OPSCC (n=11), with bars indicating their corresponding Spearman r coefficient. (C) Linear regression analyses of the mutually exclusive sc with statistically significant (p<0.01) Spearman correlations in HPV16+IR+ OPSCC (n=11), including corresponding R squared values and linear regression p values. HPV, human papillomavirus; IR+, immune responsiveness; OPSCC, oropharyngeal squamous cell carcinoma; sc, superclusters; TME, tumor microenvironment.
Figure 4
Figure 4
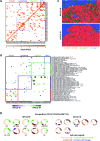
Organized intratumoral immune microaggregates specifically in HPV16+IR+ OPSCC. Spatial interaction heatmap of the 51 identified clusters (online supplemental table 5), with interaction neighborhood defined as 5 µm (<1 cell, direct spatial interaction). Cluster name is based on the markers that are expressed by that cluster, indicating that a cluster is negative for all other tested markers. (A) Spatial interaction heatmap of the total OPSCC cohort (n=20), showing all spatial interactions with a permutation-verified Z-score of >2 (ie, outside the 95% normal distribution range), with dark orange indicating highest Z-scores. (B) Heatmap showing the differences in spatial interactions occurring in HPV16+IR+ (n=11) versus HPV16+IR (n=4) OPSCC. Only spatial interactions with a permutation-verified Z-score of >2, which specifically occurred in only one of the subgroups, and had at least a twofold interaction difference in percentage between the subgroups, are visualized. Spatial interactions occurring more frequently in HPV16+IR+ tumors are indicated in green, and those in HPV16+IR tumors are indicated in purple. (C) Hyperion images of the TME of OPSCC, showing the direct spatial interactions between CD8+ T cells, CD4+ FoxP3 T cells and dendritic cells with tumor cells in HPV16+IR+ OPSCC, and the absence of these microaggregates in HPV16+IR OPSCC. Tumor epithelium is visualized in red; tumor stroma is visualized in blue. (D) Spatial interaction compositions of 360° of DCs, for HPV16+IR+ and HPV16+IR tumors. Visualized is the DC (center), surrounded by other clusters (thin circle segment indicates SD). Below each composition, the involved T-cell cluster numbers are given. Threshold for the 360° compositions: ≥20 occurrences. HPV, human papillomavirus; IR+, immune responsiveness; IR, lack of immune responsiveness; OPSCC, oropharyngeal squamous cell carcinoma; TME, tumor microenvironment.
Figure 5
Figure 5
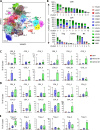
HPV16+IR+ patients show enrichment of clusters CD8_0 and Treg_0. Integrated single-cell transcriptome and TCR repertoire RNA sequencing analysis was performed on magnetic-bead sorted CD3+ T cells and CD56+ NK cells from 13 OPSCC samples. Following quality control and doublet filtering, the 6000 most highly variable genes of 14 242 T cells and 2820 NK cells were selected and unsupervised clustering was performed using the Leiden algorithm. (A) A two-dimensional UMAP plot visualizing the 38 identified clusters. (B) Bar graphs depicting the number of cells per patient per cluster for CD8+ (top), CD4+ (middle) T cells and FoxP3+ T cells (Treg), Tother and NK cells (bottom, from left to right). (C, D, E) Box plots depicting the identified CD8 (C), CD4 (D) and Treg (E) clusters, among HPV (red, n=3), HPV16+IR (blue, n=4) and HPV16+IR+ (green, n=6) OPSCC tumors. Data are represented as percentage of cluster. HPV, human papillomavirus; IR+, immune responsiveness; IR, lack of immune responsiveness; NK, natural killer; OPSCC, oropharyngeal squamous cell carcinoma; TCR, T-cell receptor; Treg, regulatory T cell.
Figure 6
Figure 6
HPV16+IR+ patients show T-cell expansion in clusters particularly defined by the expression of CCL4 or CXCL13. Integrated single-cell transcriptome and TCR repertoire RNA sequencing analysis was performed on magnetic-bead sorted CD3+ T cells and CD56+ NK cells from 13 OPSCC samples. (A) UMAP plot depicting the localization of expanded TCR clonotypes (left) and graph depicting the percentage of expanded TCR clonotypes within CD8, CD4, Treg, and Tother cells (right). (B) Box plots displaying the number of expanded cells (top) and clonotypes (bottom) within all cells (left), CD8 (middle) and CD4 (right) cells detected in HPV (red, n=3), HPV16+IR (blue, n=4) and HPV16+IR+ (green, n=6) patients with OPSCC. (C) Dot plots showing the gene expression of selected determining genes in the clusters. (D) Normalized log2 counts for the expression of chemokine receptors in HPV16+IR+ (green, n=7) compared with HPV16+IR (blue, n=6) OPSCC (Mann-Whitney U test). (E, F) Heatmap presenting specific (E) CXCL13 and (F) CCL4 cytokine production of cultured CD4+ and CD8+ T cell containing TIL in response to HPV16 E6 peptide (pool 1+2 and 3+4)-loaded, HPV16 E7 peptide (pool 1+2)-loaded autologous monocytes for HPV16+IR+ (n=9) and HPV16+IR (n=5) OPSCC. PHA served as positive control. Three OPSCC TIL cultures containing HPV-specific T cells were analyzed for HPV16-specific cytokine production by intracellular cytokine staining and flow cytometry following stimulation with BLCL loaded with pools of HPV16 E6/E7 synthetic long peptides. Expression of CD3, CD4, CD8, IFN-γ, TNF-α, and CCL4 following overnight stimulation in the presence of brefeldin A. (G) A representative example. The TILs were gated for viable and single cells, and further gated for CD3, CD4, and CD8. The cells producing TNF-α and CCL4 within the CD8+IFN-γ+ (left) and CD4+IFN-γ+ (right) T-cell population are depicted. (H) The percentage of TNF-α and CCL4 within the total IFN-γ-producing CD4+ and CD8+ T cells is depicted for two patients for HPV16 peptide (left) and three patients for PHA (right). BLCL, B-lymphoblastoid cell line; HPV, human papillomavirus; IFN-γ, interferon gamma; IR+, immune responsiveness; IR, lack of immune responsiveness; NK, natural killer; OPSCC, oropharyngeal squamous cell carcinoma; TCR, T-cell receptor; TIL, tumor-infiltrating lymphocyte; TNF-α, tumor necrosis factor alpha; Treg, regulatory T cell.
Figure 7
Figure 7
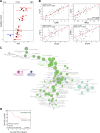
CCL4 associates with stronger antitumor immunity and improved survival. (A) To identify immune cell types that are over-represented in HPV16-positive OPSCC with strong expression of CCL4, a gene set enrichment analysis was performed on a cohort of 69 patients with HPV16+ OPSCC present in the publicly available TCGA database. An average gene expression of each gene was calculated for a high and low group. The log2-fold change of expression level between groups was used as input for the GSEA pre-ranked analysis. The association was represented by a NES. An immune cell type was considered enriched when the FDR (q-value) was <10%. The Volcano plot for the enrichment (red) and depletion (blue) of immune cell types in CCL4-high versus CCL4-low HPV16+ OPSCC is shown. (B) The Pearson correlation between the expression of CCL4 with CD8A (for CD8 T cells), TBX21 (for Tbet+ T cells), and ITGAX (CD11c for DCs) as well as CD8A and ITGAX in the tumors of the 69 patients with HPV16+ OPSCC in the TCGA database. (C) The correlation between CCL4 with a subset of genes representing immune related functions selected based on correlation analysis (Pearson correlation coefficient (R) >0.6, adjusted p<0.05) were used for gene ontology analysis of immune enrichment processes using ClueGO. (D) Kaplan-Meier survival plots of the 69 patients with HPV16+ OPSCC in the TCGA database grouped according to high and low gene expression using the median value of CCL4 as cut-off. HPV, human papillomavirus; NES, normalized enrichment score; OPSCC, oropharyngeal squamous cell carcinoma; TCGA, The Cancer Genome Atlas.

Similar articles

Cited by

References

    1. Shield KD, Ferlay J, Jemal A, et al. . The global incidence of lip, oral cavity, and pharyngeal cancers by subsite in 2012. CA Cancer J Clin 2017;67:51–64. 10.3322/caac.21384 - DOI - PubMed
    1. Welters MJP, Ma W, Santegoets SJAM, et al. . Intratumoral HPV16-specific T cells constitute a type I–oriented tumor microenvironment to improve survival in HPV16-driven oropharyngeal cancer. Clin Cancer Res 2018;24:634–47. 10.1158/1078-0432.CCR-17-2140 - DOI - PubMed
    1. Ang KK, Harris J, Wheeler R, et al. . Human papillomavirus and survival of patients with oropharyngeal cancer. N Engl J Med Overseas Ed 2010;363:24–35. 10.1056/NEJMoa0912217 - DOI - PMC - PubMed
    1. Pignon J-P, le Maître A, Maillard E, et al. . Meta-analysis of chemotherapy in head and neck cancer (MACH-NC): an update on 93 randomised trials and 17,346 patients. Radiother Oncol 2009;92:4–14. 10.1016/j.radonc.2009.04.014 - DOI - PubMed
    1. Burtness B, Harrington KJ, Greil R, et al. . Pembrolizumab alone or with chemotherapy versus cetuximab with chemotherapy for recurrent or metastatic squamous cell carcinoma of the head and neck (KEYNOTE-048): a randomised, open-label, phase 3 study. Lancet 2019;394:1915–28. 10.1016/S0140-6736(19)32591-7 - DOI - PubMed

Publication types