. 2022 Feb 16;10(2):305.
doi: 10.3390/vaccines10020305.

A Triple Gene-Deleted Pseudorabies Virus-Vectored Subunit PCV2b and CSFV Vaccine Protects Pigs against PCV2b Challenge and Induces Serum Neutralizing Antibody Response against CSFV

Affiliations

A Triple Gene-Deleted Pseudorabies Virus-Vectored Subunit PCV2b and CSFV Vaccine Protects Pigs against PCV2b Challenge and Induces Serum Neutralizing Antibody Response against CSFV

Selvaraj Pavulraj et al. Vaccines (Basel). .

Abstract

Porcine circovirus type 2 (PCV2) is endemic worldwide. PCV2 causes immunosuppressive infection. Co-infection of pigs with other swine viruses, such as pseudorabies virus (PRV) and classical swine fever virus (CSFV), have fatal outcomes, causing the swine industry significant economic losses in many if not all pig-producing countries. Currently available inactivated/modified-live/vectored vaccines against PCV2/CSFV/PRV have safety and efficacy limitations. To address these shortcomings, we have constructed a triple gene (thymidine kinase, glycoprotein E [gE], and gG)-deleted (PRVtmv) vaccine vector expressing chimeric PCV2b-capsid, CSFV-E2, and chimeric Erns-fused with bovine granulocytic monocyte-colony stimulating factor (Erns-GM-CSF), designated as PRVtmv+, a trivalent vaccine. Here we compared this vaccine's immunogenicity and protective efficacy in pigs against wild-type PCV2b challenge with that of the inactivated Zoetis Fostera Gold PCV commercial vaccine. The live PRVtmv+ prototype trivalent subunit vaccine is safe and highly attenuated in pigs. Based on PCV2b-specific neutralizing antibody titers, viremia, viral load in lymphoid tissues, fecal-virus shedding, and leukocyte/lymphocyte count, the PRVtmv+ yielded better protection for vaccinated pigs than the commercial vaccine after the PCV2b challenge. Additionally, the PRVtmv+ vaccinated pigs generated low to moderate levels of CSFV-specific neutralizing antibodies.

Keywords: CSFV; PCV2 capsid; PRV trivalent vaccine; glycoproteins E2 and Erns; granulocytic monocyte-colony stimulating factor (GM-CSF); pig; pseudorabies virus; triple mutant; vaccine efficacy; vectored vaccine.


Conflict of interest statement

The authors declare no conflict of interest.

Figures

Figure 1
Figure 1
Schematic showing genomic configuration of pseudorabies virus (PRV) and the strategy of thymidine kinase (TK), glycoprotein G (gG), and gE gene deletion to generate a PRV triple mutant virus (tmv) vaccine vector. (A) Schematic of PRV wild type (wt) Becker strain backbone [39]. UL—Unique long region; US—Unique short region; IR—Internal repeat region; TR—Terminal repeat region. Plasmid construct pPRV gEΔ (C) was used to introduce gEΔ in the PRV wt backbone (A) in the gE locus to generate PRV gEΔ mutant virus. Plasmid construct pPRV TKΔ (D) was used to incorporate TK deletion in the PRV gEΔ mutant backbone virus in TK locus (B) to generate PRV gE/TK dual gene deleted mutant virus. Finally, PRVtmv (gE/TK/gG-deleted) was constructed by incorporating the plasmid construct pPRV gGΔ (E) in to the gG locus in PRV gE/TK dual gene deleted mutant virus backbone. Arrows indicate the direction of the corresponding open reading frame (ORF). Nucleotide numbers correspond to the GenBank accession # JF797219. Part.—partial sequence; Inter.—intergenic sequence.
Figure 2
Figure 2
Strategy of chimeric PCV2 cap, CSFV Erns-GM-CSF, and CSFV E2 insertion in the TK deletion, gG deletion, and gE deletion loci, respectively, of PRVtmv genome to generate PRVtmv-CSFV E2-Erns-GM-CSF-PCV2b Cap (PRVtmv+). (A) Schematic of PRV triple mutant virus (tmv) genomic organization showing thymidine kinase (TK) (B), glycoprotein G (gG), and gE (C) deletions. Arrows indicate the direction of the corresponding open reading frame (ORF). Nucleotide numbers correspond the GenBank accession # JF797219. (E) Schematic of chimeric PCV2 cap V5 epitope gene expression cassette. The PCV2 cap expression cassette cloned in to EcoRI-NsiI site of pPRV TKΔ to yield pPRV TKΔ/PCV2 Cap-INS. (F) Schematic of chimeric CSFV Erns-GM-CSF Flag expression cassette. The CSFV Erns-GM-CSF expression cassette cloned in to KpnI-BamHI site of pPRV gGΔ to yield pPRV gGΔ/CSFV Erns-GM-CSF-INS (D) Schematic of chimeric CSFV E2 V5 epitope gene expression cassette. The CSFV E2 expression cassette was cloned in to KpnI-BamHI site of pPRV gEΔ to yield pPRVgEΔ/CSFV E2-INS. Part.—partial sequence; Inter.—intergenic sequence.
Figure 3
Figure 3
Vaccination, sample collection, challenge, and euthanasia scheme for the animal experiment. Intranasal (IN)—intranasal inoculation; Subcut—subcutaneous injection; PFU—plaque-forming units.
Figure 4
Figure 4
Immunoblot analysis of PRVtmv+ expressing chimeric CSFV E2, CSFV Erns-GM-CSF, and PCV2 cap proteins using an anti-CSFV E2 monoclonal antibody (mAbs) (left panel), an anti-CSFV Erns mAbs (middle panel), and a rabbit anti-PCV2 cap Ab (right panel), respectively.
Figure 5
Figure 5
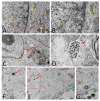
Transmission electron microscopy: (A,B) Mock infected healthy swine kidney (SK) cell with normal cellular morphology. (C,D) SK cells were infected with porcine circovirus type 2b (PCV2b) (infected at an MOI of 0.1) and fixed at 72 h post-infection (hpi). PCV2b infected cell showed accumulation of PCV2 viruses (red arrow) within the vesicle-like structures in the cytoplasm. Each PCV2 particle measured about 20 nm in diameter. (EG) SK cells were infected with PRV wt (infected with an MOI of 5) and fixed at 12 hpi. PRV wt-infected cells showed enveloped herpesvirus (red arrow; about 200 nm in diameter) within the vesicle-like structure in the cytoplasm. The process of budding and release of several enveloped viruses were also noticed on the periphery of the cell near the plasma membrane (blue arrow). Released virus particles from the outer surface of the cells were accumulated in intercellular space (green arrow). (B, D, F, G) are magnifications of (A, C, E), respectively. N—Nucleus; C—Cytoplasm; RER—Rough endoplasmic reticulum; M—Mitochondria; L—Lysosomes.
Figure 6
Figure 6
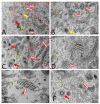
Transmission electron microscopy. (A) PRVtmv+ vaccine virus-infected swine kidney (SK) cells (infected at an MOI of 5) were fixed at 18 h post-infection. PRVtmv+ infected cells showed several fully enveloped 200 nm in diameter size PRVtmv+ vaccine virus particles in the exocytic vesicles in the cytoplasm (red arrows). Secondary envelopment of intracytoplasmic PRVtmv+ capsids by budding into vesicles was visible (yellow arrows). Most of the PRVtmv+ infected SK cells showed several accumulations of PCV2 virus-like particles (VLPs) within the vesicular structures in the cytoplasm (red arrow with a white fill). The PCV2-VLPs were circular, and each measured about 20 nm in diameter. (B) Magnification of A is given. (C) The presence of enveloped PRVtmv+ vaccine virus (red arrow) and PCV2 VLPs within vesicles (red arrow with a white fill) in the cytoplasm of the PRVtmv+ infected SK cells were visible. (DF) Accumulations of PCV2-VLPs within the vesicle-like structures in the cytoplasm of the infected cells (red arrow with a white fill). C—Cytoplasm; RER—Rough endoplasmic reticulum; G—Golgi apparatus.
Figure 7
Figure 7
In vitro characterization of PRVtmv+. (A) Plaque size analysis of PRVtmv+ compared to that of PRV wt. Shown are the pictures of areas containing representative plaques of each virus. (B) Bar graph showing normalized average plaque size (n = 150) for each virus with standard deviation (SD). (C) One-step growth analysis of PRVtmv+ compared with PRV wt.
Figure 8
Figure 8
Clinical assessment. (A) Rectal temperature of pigs following immunization and challenge. Rectal temperature was measured using a digital thermometer on indicated days. Shown is the mean temperature of each treatment group with standard deviation (SD) (n = 5). (B) Body weight (BW) of pigs following immunization and challenge. BW was measured using a digital weight balance on indicated days. The mean BW of each treatment group with SD (n = 5) is shown. dpv—days post-vaccination; dpc—days post-challenge. Two-way ANOVA followed by Bonferroni post-tests to compare replicate means by row. p < 0.05 is considered as significant.
Figure 8
Figure 8
Clinical assessment. (A) Rectal temperature of pigs following immunization and challenge. Rectal temperature was measured using a digital thermometer on indicated days. Shown is the mean temperature of each treatment group with standard deviation (SD) (n = 5). (B) Body weight (BW) of pigs following immunization and challenge. BW was measured using a digital weight balance on indicated days. The mean BW of each treatment group with SD (n = 5) is shown. dpv—days post-vaccination; dpc—days post-challenge. Two-way ANOVA followed by Bonferroni post-tests to compare replicate means by row. p < 0.05 is considered as significant.
Figure 9
Figure 9
Nasal shedding of PRVtmv+ in immunized pigs assessed by qPCR and virus isolation. (A) DNA was isolated from nasal swab following immunization with PRVtmv+ vaccine, and PRV-qPCR was performed. PRV genome copy numbers were calculated according to the CT values of a standard curve. Shown are the mean copy numbers of PRV genome in 100 ng of DNA of two independent qPCR analyses of each animal from three vaccination groups on 0, 2, 4, 8, and 15 dpv. The dot plot graph represents mean + individual values in each group (n = 5). (B) Virus isolated from each animal’s nasal swab following the immunization with PRVtmv+ vaccine was titrated in confluent SK cells by plaque assay. Shown are the virus titers (in plaque-forming unit/mL of the nasal swab; PFU/mL) of each animal from three vaccination groups on 0, 2, 4, 8, and 15 dpv. The dot plot graph represents mean + individual values in each group (n = 5). dpv—days post-vaccination.
Figure 10
Figure 10
Quantification of PRVtmv+ in tonsil swab of immunized pigs assessed by qPCR and virus isolation. (A) DNA was isolated from tonsil swabs following immunization with PRVtmv+ vaccine, and PRV-qPCR was performed. PRV genome copy numbers were calculated according to the CT values of a standard curve. The mean copy numbers of PRV genome in 100 ng of DNA from tonsil swab of two independent qPCR analyses of each animal from three vaccination groups on 0, 2, 4, 8, and 15 dpv are shown. The dot plot graph represents mean + individual values in each group (n = 5). (B) Virus isolated from each animal’s tonsil swab following the immunization with PRVtmv+ vaccine was titrated in confluent SK cells by plaque assay. Shown are the titers (in plaque-forming unit/mL of the nasal swab; PFU/mL) of each animal from three vaccination groups on 0, 2, 4, 8, and 15 dpv. The dot plot graph represents mean + individual values in each group (n = 5).
Figure 11
Figure 11
PRVtmv+ is stable in pigs. Immunoblot analysis of PRVtmv+ vaccine virus after a passage in pigs expressing chimeric CSFV E2 and Erns proteins by using E2- (left panel) and Erns-specific (right panel) mAbs, respectively.
Figure 12
Figure 12
Indirect immunofluorescence assay (IIFA) for serum samples collected from PRVtmv+ immunized pigs. Swine kidney cells were transfected with PCV2b plasmid. At 72 h post-transfection, cells were fixed and IIFA were performed using serum samples collected from PRVtmv+ immunized pig on 0 day post-vaccination (dpv) (pig #2313) and 32 dpv (pig #2313 and 2304) as a primary antibody and fluorescent-labeled anti-porcine secondary antibody with DAPI nuclear stain. Positive signals were indicated by bright apple-green fluorescent signals. (Magnifications 200×).
Figure 13
Figure 13
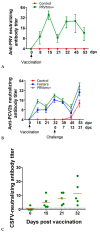
PRV-, PCV2b-, and CSFV-specific serum neutralizing (SN) antibody titer developed in pigs after PRVtmv+ vaccination. (A) PRV-specific SN titers. The data represent the mean + standard deviation (n = 5). (B) PCV2b-specific SN antibody titer following PRVtmv+ immunization and PCV2b challenge. PCV2b is non-cytopathic, and the viral plaques were visualized by IFA at 72 h post-inoculation using the PCV2b specific mAbs 36F1 and fluorescent-tagged secondary antibody. (C) CSFV-specific neutralization dose (ND50) SN titers following PRVtmv+ immunization. ND50 titers were calculated as described earlier [51] and briefly in the materials and method section. The dot plot graph shows each animal’s mean values and individual titer with standard deviation (n = 5). dpv—days post-vaccination; dpc—days post-challenge.
Figure 14
Figure 14
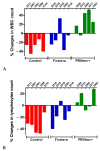
Percent changes in leukocyte and lymphocyte count following challenge in all three groups. Whole blood was collected from pigs on 32 dpv/0 dpc and 53 dpv/21 dpc, and (A) leukocyte and (B) lymphocyte counts were determined and percent changes were calculated.
Figure 15
Figure 15
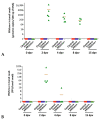
Fecal PCV2b shedding in control and vaccinated pigs following the PCV2b challenge was assessed by qPCR. DNA was isolated from fecal swab, and PCV2b qPCR was performed. PCV2b genome copy numbers were calculated according to CT-values of a standard curve. The mean copy numbers of PCV2b genome are shown in 200 ng of DNA of two independent qPCR analyses of each animal from the three vaccination groups on 0, 13, 17, and 21 dpc. The dot plot graph represents mean + individual values in each group (n = 5). dpc—days post-challenge.
Figure 16
Figure 16
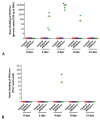
PCV2b in serum (cell-free) and PBMC (cell-associated viremia) in control and vaccinated pigs following the challenge was assessed by qPCR. DNA was isolated from serum and PBMC, and PCV2b qPCR was performed as described. PCV2b genome copy numbers were calculated according to CT-values of a standard curve. (A) Shown is the mean copy numbers of PCV2b genome in serum (100 ng of DNA) and (B) PBMC (normalized to 107 cells) of two independent qPCR analysis of each animal from three vaccination group on 0, 13, 17, and 21 dpc. The dot plot graph represents mean + individual values in each group (n = 5). dpc—days post-challenge.
Figure 16
Figure 16
PCV2b in serum (cell-free) and PBMC (cell-associated viremia) in control and vaccinated pigs following the challenge was assessed by qPCR. DNA was isolated from serum and PBMC, and PCV2b qPCR was performed as described. PCV2b genome copy numbers were calculated according to CT-values of a standard curve. (A) Shown is the mean copy numbers of PCV2b genome in serum (100 ng of DNA) and (B) PBMC (normalized to 107 cells) of two independent qPCR analysis of each animal from three vaccination group on 0, 13, 17, and 21 dpc. The dot plot graph represents mean + individual values in each group (n = 5). dpc—days post-challenge.
Figure 17
Figure 17
Histopathology following vaccination with Fostera or PRVtmv+ vaccines and subsequent challenge with PCV2. Control group (A,D), Fostera-vaccinated group (B,E), and PRVtmv+-vaccinated group (C,F). Overall, there are no significant histologic changes. Rare multinucleated giant cells were noted in the mesenteric lymph node of one PRVtmv+-vaccinated pig (#2302; F, arrow, and inset) H&E 100× total magnification, Bar = 100 μm.
Figure 18
Figure 18
Quantification of PCV2b viral genome copies in pig tissues. DNA was isolated from 25 mg of tissues (tonsil, mesenteric LN, mediastinal LN, cervical LN, Peyer’s patch, and spleen), and PCV2b qPCR was performed. PCV2b genome copy numbers were calculated according to CT-values of a standard curve. Calculated PCV2b genome copies were normalized based on porcine house-keeping gene GAPDH, and shown are the mean copy numbers of PCV2b genome per one million cells. Two independent qPCR analyses were performed for each animal from three vaccination groups. The dot plot graph represents the mean + individual values in each group (n = 5).
Figure 19
Figure 19
Immunohistochemistry showing the PCV2b antigen in tonsil (A) and intestine (Peyer’s patches) (B). Tissue sections were prepared, cleared, rehydrated, and subjected to immunostaining using anti-PCV2b mAb and horseradish peroxidase-labeled secondary antibodies. Immunostained sections were counterstained with 0.5% methylene green stain and examined under a microscope after mounting. PCV2 antigens in tissues were confirmed by the presence of bright-golden brown positive signals. (A) Note that PCV2b antigens are detected in the tonsil (A) and Peyer’s patch (B) of the control unvaccinated pig. Regardless of PRVtmv+ or Fostera vaccine group, PCV2b Cap antigen could not be detected in the tonsils of pigs. In one pig (#2310) of the Fostera group, PCV2b Cap-specific antigen in a tiny area of Peyer’s patch could be detected (B). Magnification 100×. Bar = 100 μm.
Figure 19
Figure 19
Immunohistochemistry showing the PCV2b antigen in tonsil (A) and intestine (Peyer’s patches) (B). Tissue sections were prepared, cleared, rehydrated, and subjected to immunostaining using anti-PCV2b mAb and horseradish peroxidase-labeled secondary antibodies. Immunostained sections were counterstained with 0.5% methylene green stain and examined under a microscope after mounting. PCV2 antigens in tissues were confirmed by the presence of bright-golden brown positive signals. (A) Note that PCV2b antigens are detected in the tonsil (A) and Peyer’s patch (B) of the control unvaccinated pig. Regardless of PRVtmv+ or Fostera vaccine group, PCV2b Cap antigen could not be detected in the tonsils of pigs. In one pig (#2310) of the Fostera group, PCV2b Cap-specific antigen in a tiny area of Peyer’s patch could be detected (B). Magnification 100×. Bar = 100 μm.

Similar articles

Cited by

References

    1. Baekbo P., Kristensen C.S., Larsen L.E. Porcine circovirus diseases: A review of PMWS. Transbound. Emerg. Dis. 2012;59((Suppl. S1)):60–67. doi: 10.1111/j.1865-1682.2011.01288.x. - DOI - PubMed
    1. Allan G.M., McNeilly F., Kennedy S., Daft B., Clarke E.G., Ellis J.A., Haines D.M., Meehan B.M., Adair B.M. Isolation of porcine circovirus-like viruses from pigs with a wasting disease in the USA and Europe. J. Vet. Diagn. Investig. 1998;10:3–10. doi: 10.1177/104063879801000102. - DOI - PubMed
    1. Meng X.J. Porcine circovirus type 2 (PCV2): Pathogenesis and interaction with the immune system. Annu. Rev. Anim. Biosci. 2013;1:43–64. doi: 10.1146/annurev-animal-031412-103720. - DOI - PubMed
    1. Ellis J.A., Bratanich A., Clark E.G., Allan G., Meehan B., Haines D.M., Harding J., West K.H., Krakowka S., Konoby C., et al. Coinfection by porcine circoviruses and porcine parvovirus in pigs with naturally acquired postweaning multisystemic wasting syndrome. J. Vet. Diagn. Investig. 2000;12:21–27. doi: 10.1177/104063870001200104. - DOI - PubMed
    1. Huang Y.L., Pang V.F., Lin C.M., Tsai Y.C., Chia M.Y., Deng M.C., Chang C.Y., Jeng C.R. Porcine circovirus type 2 (PCV2) infection decreases the efficacy of an attenuated classical swine fever virus (CSFV) vaccine. Vet. Res. 2011;42:115. doi: 10.1186/1297-9716-42-115. - DOI - PMC - PubMed

LinkOut - more resources