Ribosome accumulation during early phase resistance training in humans
- PMID: 35213791
- PMCID: PMC9540306
- DOI: 10.1111/apha.13806
Ribosome accumulation during early phase resistance training in humans
Abstract
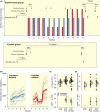
Aim: To describe ribosome biogenesis during resistance training, its relation to training volume and muscle growth.
Methods: A training group (n = 11) performed 12 sessions (3-4 sessions per week) of unilateral knee extension with constant and variable volume (6 and 3-9 sets per session respectively) allocated to either leg. Ribosome abundance and biogenesis markers were assessed from vastus lateralis biopsies obtained at baseline, 48 hours after sessions 1, 4, 5, 8, 9 and 12, and after eight days of de-training, and from a control group (n = 8). Muscle thickness was measured before and after the intervention.
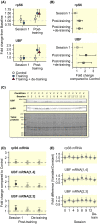
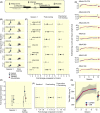
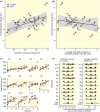
Results: Training led to muscle growth (3.9% over baseline values, 95% CrI: [0.2, 7.5] vs. control) with concomitant increases in total RNA, ribosomal RNA, upstream binding factor (UBF) and ribosomal protein S6 with no differences between volume conditions. Total RNA increased rapidly in response to the first four sessions (8.6% [5.6, 11.7] per session), followed by a plateau and peak values after session 8 (49.5% [34.5, 66.5] above baseline). Total RNA abundance was associated with UBF protein levels (5.0% [0.2, 10.2] per unit UBF), and the rate of increase in total RNA levels predicted hypertrophy (0.3 mm [0.1, 0.4] per %-point increase in total RNA per session). After de-training, total RNA decreased (-19.3% [-29.0, -8.1]) without muscle mass changes indicating halted biosynthesis of ribosomes.
Conclusion: Ribosomes accumulate in the initial phase of resistance training with abundances sensitive to training cessation and associated with UBF protein levels. The average accumulation rate predicts muscle training-induced hypertrophy.
Keywords: muscle hypertrophy; resistance training; ribosome biogenesis.
© 2022 The Authors. Acta Physiologica published by John Wiley & Sons Ltd on behalf of Scandinavian Physiological Society.
Conflict of interest statement
The authors do not have any conflict of interest to declare.
Figures


Similar articles
-
Glucose ingestion before and after resistance training sessions does not augment ribosome biogenesis in healthy moderately trained young adults.Eur J Appl Physiol. 2024 Aug;124(8):2329-2342. doi: 10.1007/s00421-024-05446-x. Epub 2024 Mar 8. Eur J Appl Physiol. 2024. PMID: 38459192 Free PMC article. Clinical Trial.
-
Benefits of higher resistance-training volume are related to ribosome biogenesis.J Physiol. 2020 Feb;598(3):543-565. doi: 10.1113/JP278455. Epub 2020 Jan 15. J Physiol. 2020. PMID: 31813190
-
Consecutive bouts of electrical stimulation-induced contractions alter ribosome biogenesis in rat skeletal muscle.J Appl Physiol (1985). 2019 Jun 1;126(6):1673-1680. doi: 10.1152/japplphysiol.00665.2018. Epub 2019 Apr 18. J Appl Physiol (1985). 2019. PMID: 30998122
-
Revisiting the roles of protein synthesis during skeletal muscle hypertrophy induced by exercise.Am J Physiol Regul Integr Comp Physiol. 2019 Nov 1;317(5):R709-R718. doi: 10.1152/ajpregu.00162.2019. Epub 2019 Sep 11. Am J Physiol Regul Integr Comp Physiol. 2019. PMID: 31508978 Review.
-
It's not just about protein turnover: the role of ribosomal biogenesis and satellite cells in the regulation of skeletal muscle hypertrophy.Eur J Sport Sci. 2019 Aug;19(7):952-963. doi: 10.1080/17461391.2019.1569726. Epub 2019 Feb 9. Eur J Sport Sci. 2019. PMID: 30741116 Review.
Cited by
-
Resistance Training Diminishes Mitochondrial Adaptations to Subsequent Endurance Training.bioRxiv [Preprint]. 2023 Apr 6:2023.04.06.535919. doi: 10.1101/2023.04.06.535919. bioRxiv. 2023. Update in: J Physiol. 2023 Sep;601(17):3825-3846. doi: 10.1113/JP284822 PMID: 37066356 Free PMC article. Updated. Preprint.
-
Mechanisms of mechanical overload-induced skeletal muscle hypertrophy: current understanding and future directions.Physiol Rev. 2023 Oct 1;103(4):2679-2757. doi: 10.1152/physrev.00039.2022. Epub 2023 Jun 29. Physiol Rev. 2023. PMID: 37382939 Free PMC article. Review.
-
Resistance training diminishes mitochondrial adaptations to subsequent endurance training in healthy untrained men.J Physiol. 2023 Sep;601(17):3825-3846. doi: 10.1113/JP284822. Epub 2023 Jul 20. J Physiol. 2023. PMID: 37470322 Free PMC article.
-
Elevated muscle mass accompanied by transcriptional and nuclear alterations several months following cessation of resistance-type training in rats.Physiol Rep. 2022 Oct;10(20):e15476. doi: 10.14814/phy2.15476. Physiol Rep. 2022. PMID: 36259109 Free PMC article.
-
The rRNA epitranscriptome and myonuclear SNORD landscape in skeletal muscle fibers contributes to ribosome heterogeneity and is altered by a hypertrophic stimulus.Am J Physiol Cell Physiol. 2024 Sep 1;327(3):C516-C524. doi: 10.1152/ajpcell.00301.2024. Epub 2024 Jun 24. Am J Physiol Cell Physiol. 2024. PMID: 38912733 Free PMC article.
References
-
- Wolfe RR. The underappreciated role of muscle in health and disease. Am J Clin Nutr. 2006;84(3):475‐482. - PubMed
-
- Phillips SM, Tipton KD, Aarsland A, Wolf SE, Wolfe RR. Mixed muscle protein synthesis and breakdown after resistance exercise in humans. Am J Physiol. 1997;273(Pt 1):E99‐E107. - PubMed
-
- Brook MS, Wilkinson DJ, Mitchell WK, et al. Skeletal muscle hypertrophy adaptations predominate in the early stages of resistance exercise training, matching deuterium oxide‐derived measures of muscle protein synthesis and mechanistic target of rapamycin complex 1 signaling. FASEB J. 2015;29(11):4485‐4496. - PubMed
MeSH terms
Substances
LinkOut - more resources
Full Text Sources

