

Reduced ER-mitochondria connectivity promotes neuroblastoma multidrug resistance
- PMID: 35211994
- PMCID: PMC9016347
- DOI: 10.15252/embj.2021108272
Reduced ER-mitochondria connectivity promotes neuroblastoma multidrug resistance
Abstract
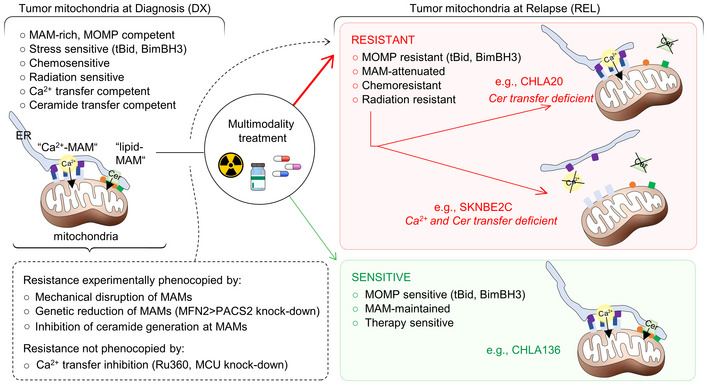
Most cancer deaths result from progression of therapy resistant disease, yet our understanding of this phenotype is limited. Cancer therapies generate stress signals that act upon mitochondria to initiate apoptosis. Mitochondria isolated from neuroblastoma cells were exposed to tBid or Bim, death effectors activated by therapeutic stress. Multidrug-resistant tumor cells obtained from children at relapse had markedly attenuated Bak and Bax oligomerization and cytochrome c release (surrogates for apoptotic commitment) in comparison with patient-matched tumor cells obtained at diagnosis. Electron microscopy identified reduced ER-mitochondria-associated membranes (MAMs; ER-mitochondria contacts, ERMCs) in therapy-resistant cells, and genetically or biochemically reducing MAMs in therapy-sensitive tumors phenocopied resistance. MAMs serve as platforms to transfer Ca2+ and bioactive lipids to mitochondria. Reduced Ca2+ transfer was found in some but not all resistant cells, and inhibiting transfer did not attenuate apoptotic signaling. In contrast, reduced ceramide synthesis and transfer was common to resistant cells and its inhibition induced stress resistance. We identify ER-mitochondria-associated membranes as physiologic regulators of apoptosis via ceramide transfer and uncover a previously unrecognized mechanism for cancer multidrug resistance.
Keywords: ceramides; inter-organelle contacts; mitochondria-associated membranes; multidrug resistance; sphingolipids.
© 2022 The Authors. Published under the terms of the CC BY NC ND 4.0 license.
Figures
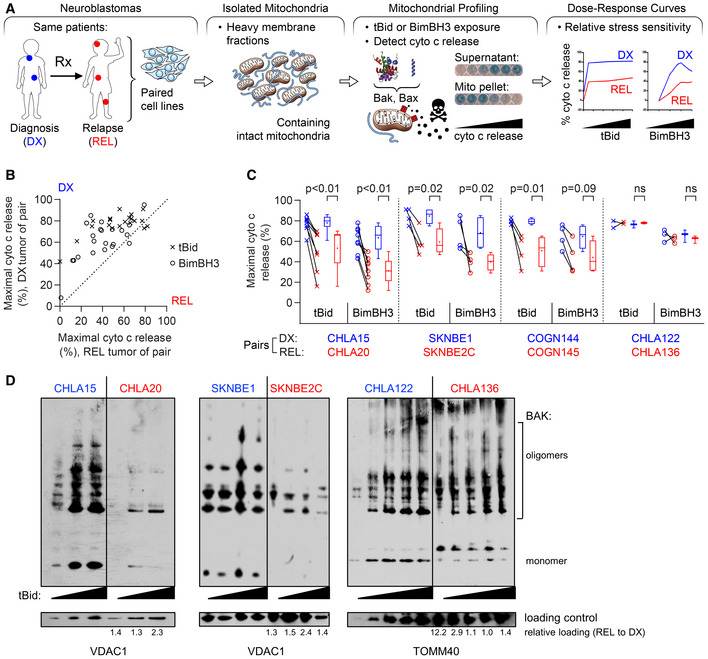
Tumor models were derived at DX and REL following treatment. Mitochondria‐rich fractions were exposed to tBid or BimBH3 peptide and cytochrome c release measured as a surrogate for apoptotic commitment.
Maximal cytochrome c release in response to tBid or BimBH3 peptide for each replicate of a DX/REL tumor pair (1–9 biological replicates per DX/REL pair; n = 44 total).
Maximal cytochrome c release for all DX/REL pairs with ≥ 3 biological replicates; box‐whisker plots summarize data (box 25–75%; belt = median; dot = mean; and whiskers = minimum and maximum values).
Bak oligomerization in response to escalating tBid concentration for DX/REL pairs. Relative mitochondrial protein loading per lane is assessed by densitometry, showing ration of loading control in REL lane with patient‐matched DX lane at same tBid exposure (no REL lane is underloaded compared to DX lane).
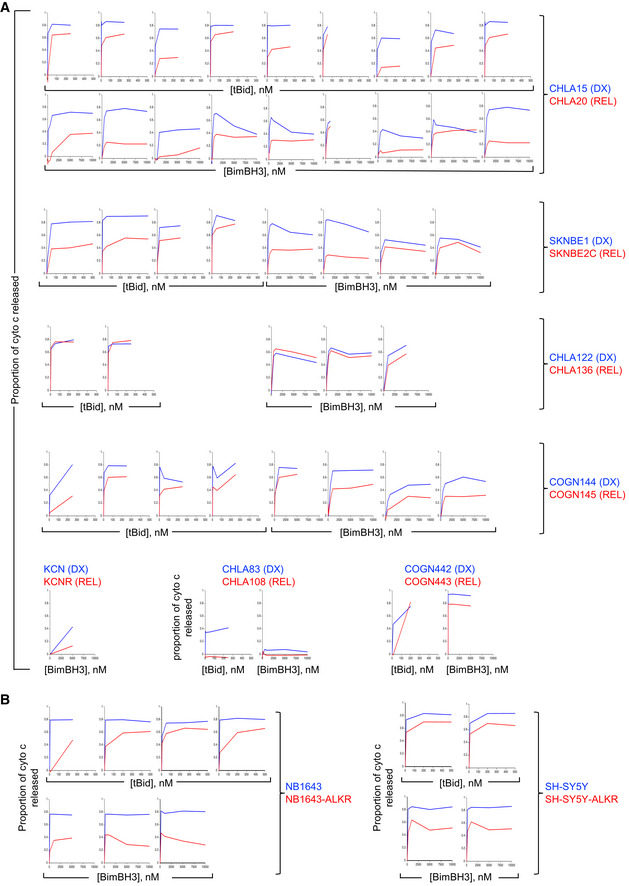
All mitochondrial profiling data using heavy‐membrane mitochondria‐enriched fractions from DX cells (blue curves) and patient‐matched REL cells (red curves) showing robust qualitative reproducibility.
All mitochondrial profiling using heavy‐membrane mitochondria‐enriched fractions obtained from ALK mutant neuroblastoma cells selected for resistance to the Alk inhibitor, crizotinib. Cells with crizotinib resistance are designated by “‐ALKR” and are shown relative to parental cells.
- A
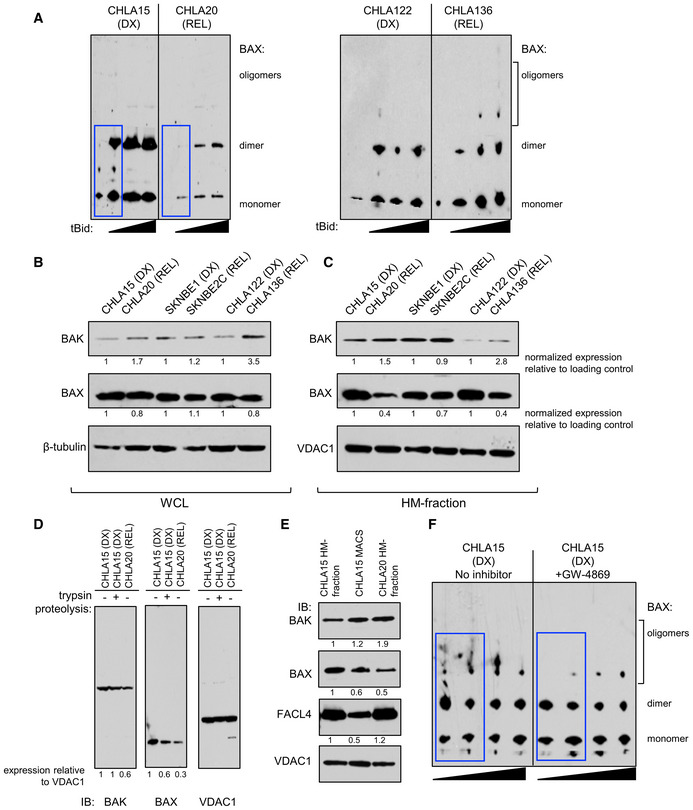
Bax oligomerization in response to escalating tBid concentration by immunoblot for DX/REL pairs. Blue boxes highlight key oligomerization differences.
- B, C
DX/REL pair whole‐cell lysates and heavy‐membrane (HM) fractions immunoblotted for Bak and Bax with relevant loading controls.
- D
Immunoblot of CHLA15 HM fraction, with and without tryptic digestion to deplete MAMs, compared with CHLA20 HM fraction, for Bak, Bax, and Vdac1 (loading control).
- E
Similar to D, but with immunomagnetic separation (MACS) to deplete MAMs, immunoblotted for Bak, Bax, Facl4 (MAM marker), and Vdac1 (loading control).
- F
Bax oligomerization in response to escalating tBid concentration by immunoblot for CHLA15 mitochondria pre‐incubated for 30 min with or without the neutral sphingomyelinase inhibitor, GW4869. Blue boxes highlight key oligomerization differences.
- A
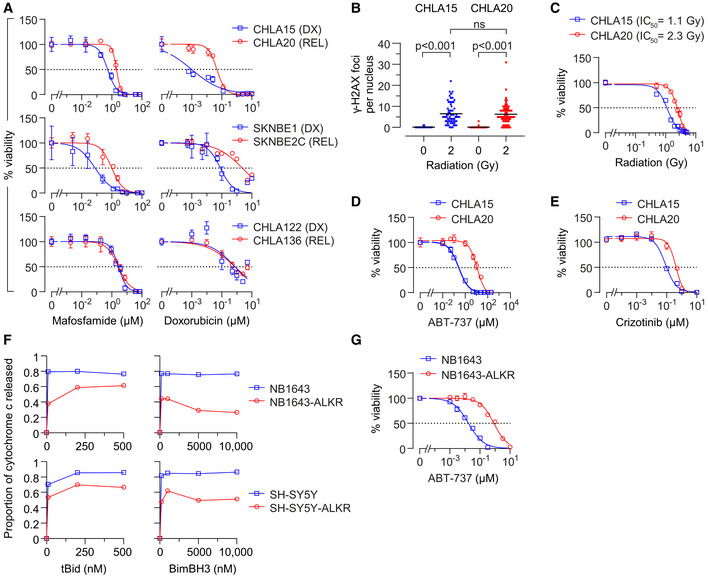
In vitro viability curves after 72 h exposure to mafosfamide or doxorubicin. Results are shown for three DX/REL neuroblastoma cell line pairs, two with attenuated cytochrome c release (CHLA15/CHLA20 and SKNBE1/SKNBE2C), and one without (CHLA122/CHLA136).
- B
DNA damage induced by 2 Gy ionizing radiation as measured by γ‐H2AX foci at 1 h (n = 53–77 cell nuclei/condition scored; mean shown); statistical analyses performed using two‐tailed Mann–Whitney U test.
- C–E
In vitro viability for CHLA15 (DX) and CHLA20 (REL) following ionizing radiation at 7 days, 48 h exposure to the Bcl2/Bclx inhibitor, ABT‐737, or 120 h exposure to the Alk inhibitor, crizotinib.
- F
Cytochrome c release from mitochondria after exposure to tBid or BimBH3 peptide for parental NB1643 and SY5Y cells, in comparison to cells cultured in escalating concentrations of crizotinib until resistant (NB1643‐ALKR and SY5Y‐ALKR).
- G
In vitro viability of NB1643 and NB1643‐ALKR cells following 72 h exposure to ABT‐737.
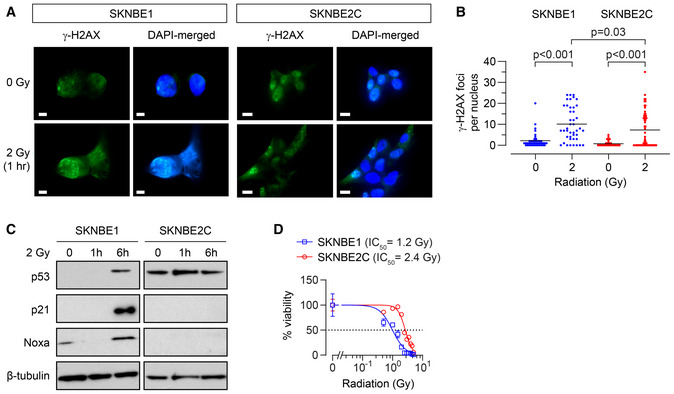
DNA damage induced by 2 Gy ionizing radiation as measured by γ‐H2AX foci for SKNBE1 (DX, TP53 wild type) and SKNBE2C (REL, TP53 mutant). Fluorescence detection of γ‐H2AX foci and DAPI nuclear counterstain assessed, with representative images shown; SKNBE1 scale bar = 5 µm; SKNBE2C scale bar = 10 µm.
Foci frequency plotted with mean shown for each condition in A (n = 42–58 nuclei/condition).
Cell lysates from cells treated with 2 Gy of ionizing irradiation were immunoblotted for p53 and p53 target genes with β‐tubulin as a protein loading control.
In vitro viability following ionizing radiation at 7 days; dotted line represents 50% viability. Data points are mean and SD error bars from triplicate wells, experiments are representative of at least three biological replicates.
- A
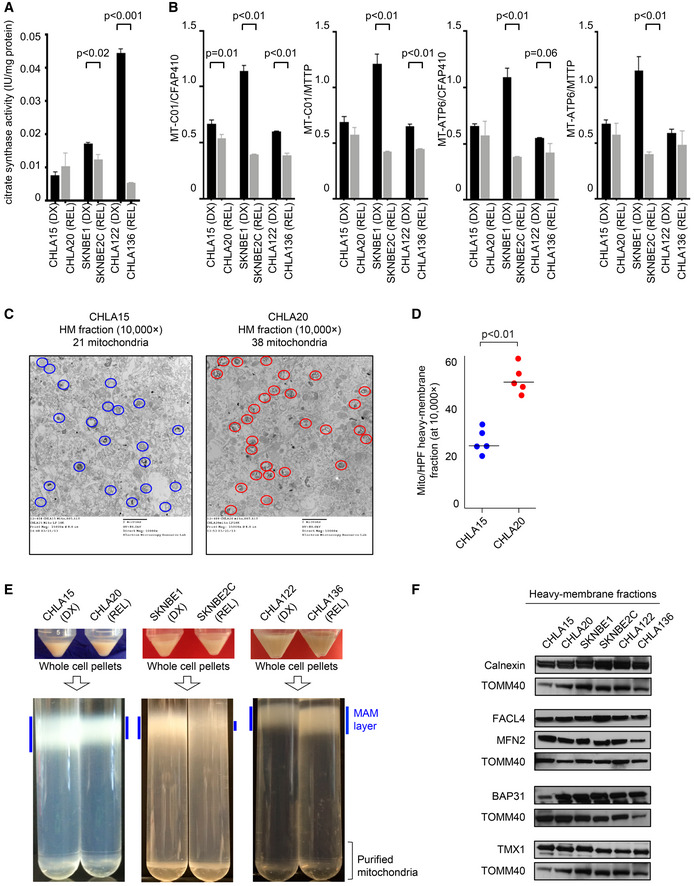
Mitochondrial biomass assessed by citrate synthase activity across DX/REL pairs; in triplicate from three biological replicates; mean with SD error bar shown.
- B
Mitochondrial DNA content as quantified by qPCR using the mtDNA/nucDNA ratio for each of the two mitochondrial (MT‐C01 and MT‐ATPase6) and two nuclear (CFAP410 and MTTP) genes; in triplicate from three biological replicates; mean with SD error bar shown.
- C, D
Electron micrograph images of heavy‐membrane mitochondria‐enriched fractions from CHLA15 and CHLA20 cells, identifying relative mitochondria abundance (identified within colored circles); quantification shown in D.
- E
Heavy‐membrane fractions obtained from equal cell input were separated by Percoll gradient ultracentrifugation into MAM fractions (blue bars) and purified mitochondria for DX/REL pairs.
- F
Immunoblot detection of MAM‐ and ER‐localized proteins in heavy‐membrane fractions from DX/REL pairs, with TOMM40 as a loading control for mitochondrial protein input.
- A–C
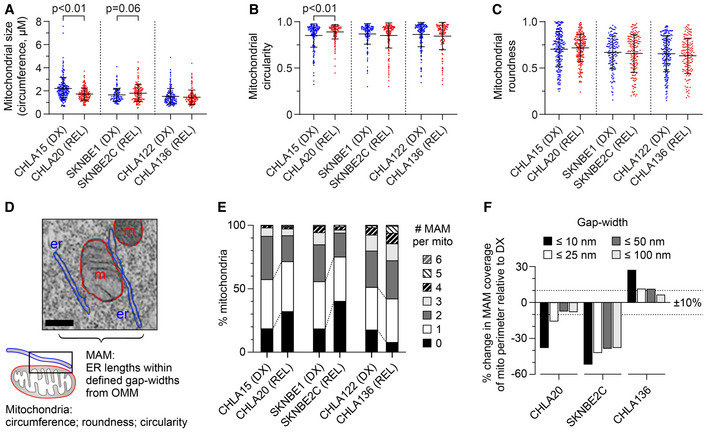
Transmission electron microscopy image analysis was used to quantify mitochondrial size, circularity, and roundness in DX/REL neuroblastoma pairs (mean ± SD shown).
- D
Electron micrograph illustrating organelle masking of MAM interfaces; scale bar = 500 nm.
- E
Proportion of mitochondria with 0–6 or more MAMs are shown for each cell line, as DX/REL pairs.
- F
Percentage of mitochondria perimeter with an apposed ER within defined gap widths for DX/REL neuroblastoma cell line pairs; dotted lines denote +10% and −10% change.
- A
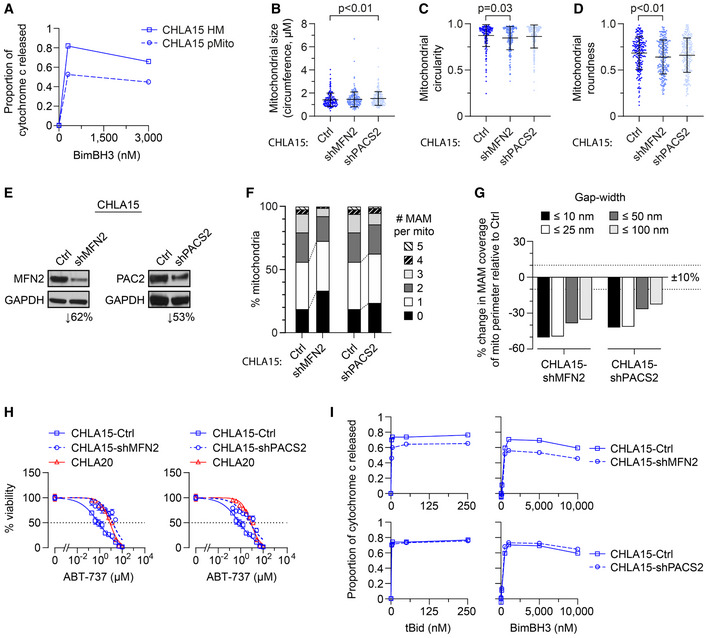
Heavy‐membrane (HM) fractions of CHLA15 were rendered MAM depleted by immunomagnetic separation to derive purified mitochondria (pMito), and cytochrome c release measured in response to BimBH3 peptide.
- B–D
TEM analyses were used to quantify mitochondrial size, circularity, and roundness in CHLA15 cells transfected with a sh‐control (Ctrl), shMFN2 or shPACS2 constructs (mean ± SD shown).
- E
Immunoblot assessment of Mfn2 and Pacs2 protein knockdown.
- F
Proportion of mitochondria with 0–5 MAMs are shown for each.
- G
Percentage of mitochondria perimeter with an apposed ER within defined gap widths; dotted lines denote +10% and −10% change.
- H
In vitro viability of CHLA15‐ctrl, CHLA15‐shMFN2, CHLA15‐shPACS2, and CHLA20 cells following 72 h exposure to ABT‐737; dotted line represents 50% viability.
- I
Mitochondrial cytochrome c release in response to tBid and BimBH3 peptide in CHLA15‐Ctrl, CHLA15‐shMFN2, and CHLA15‐shPACS2 cells.
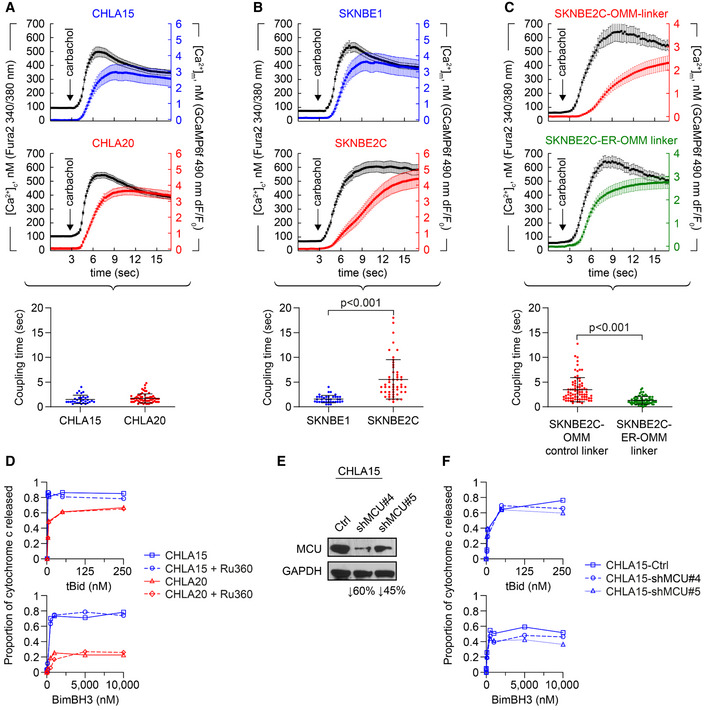
- A, B
Cytosolic (black tracing) and mitochondrial (colored tracing) Ca2+ concentration measured using fluorescent reporters in the CHLA15 (n = 29 cells)/CHLA20 (n = 65 cells) and SKNBE1 (n = 37 cells)/SKNBE2C (n = 52 cells) pairs. ER Ca2+ release was induced by 100 μM carbachol, an IP3R‐agonist; time added indicated by arrow; tracings are mean ± SD error bars. Coupling time (time between achieving 50% of maximal cytosolic and mitochondrial concentrations) is an index of ER–mitochondrial proximity and transfer efficiency; plotted below.
- C
MAM proximity was enforced in SKNBE2C cells using an ER‐OMM linker construct, with Ca2+ transfer coupling time (n = 57 cells) compared with cells expressing an OMM‐only control linker (n = 70 cells); tracings are mean ± SEM error bars.
- D
Mitochondrial cytochrome c release for CHLA15 and CHLA20 cells following exposure to tBid or BimBH3 peptide, with or without Ru360 treatment.
- E
Silencing of the mitochondrial calcium uniporter (MCU) was achieved in two CHLA15‐shMCU clones.
- F
Cytochrome c release in response to tBid and BimBH3 assessed.
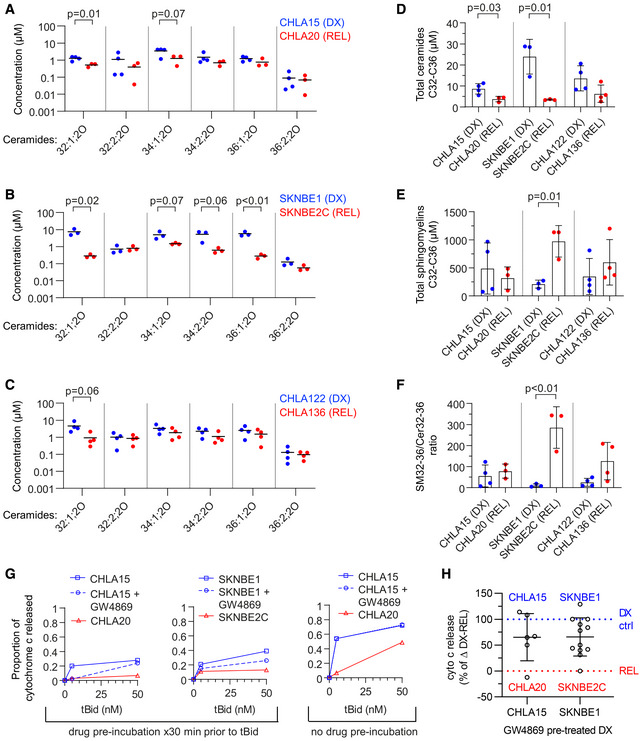
- A–C
Concentration of ceramide species as measured by LC/MS from DX and REL pair whole‐cell pellets.
- D, E
Cumulative ceramides and sphingomyelins (of C32–C36 chain length) for DX/REL pairs.
- F
Ratio of total C32‐C36 sphingomyelins:ceramides for DX/REL pairs.
- G
Cytochrome c release for CHLA15 and SKNBE1 mitochondria following exposure to tBid, pre‐incubated for 30 min with or without GW4869, and CHLA20 and SKNBE2C pre‐incubated without GW4869 (left panel); same experiment but with GW4869 added with tBid, after the 30 min pre‐incubation (right panel).
- H
Summary data for CHLA15/CHLA20 and SKNBE1/SKNBE2C showing relative cytochrome c release when pre‐incubated with GW4869 to inhibit ceramide generation, compared with untreated cells.
- A–C
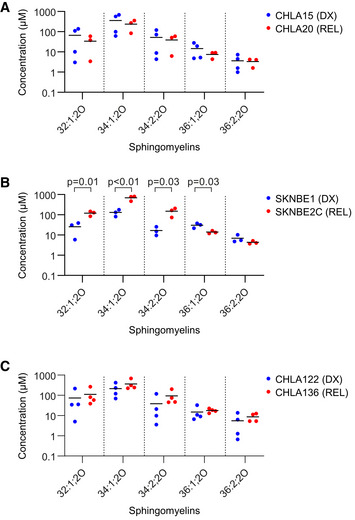
Concentration of sphingomyelin species as measured by LC/MS from DX and REL pair whole‐cell pellets. Data information: three to four biological replicates plotted per cell line; three technical replicates each; statistical analyses were performed using an unpaired two‐sided Student’s t‐test, with significance P < 0.05.
Similar articles
-
Sphingolipid distribution at mitochondria-associated membranes (MAMs) upon induction of apoptosis.J Lipid Res. 2020 Jul;61(7):1025-1037. doi: 10.1194/jlr.RA120000628. Epub 2020 Apr 29. J Lipid Res. 2020. PMID: 32350079 Free PMC article.
-
Very long chain ceramides interfere with C16-ceramide-induced channel formation: A plausible mechanism for regulating the initiation of intrinsic apoptosis.Biochim Biophys Acta. 2015 Feb;1848(2):561-7. doi: 10.1016/j.bbamem.2014.11.018. Epub 2014 Nov 21. Biochim Biophys Acta. 2015. PMID: 25462172
-
Mitochondria-Associated Membranes and ER Stress.Curr Top Microbiol Immunol. 2018;414:73-102. doi: 10.1007/82_2017_2. Curr Top Microbiol Immunol. 2018. PMID: 28349285 Review.
-
Endoplasmic Reticulum-Mitochondria Communication Through Ca2+ Signaling: The Importance of Mitochondria-Associated Membranes (MAMs).Adv Exp Med Biol. 2017;997:49-67. doi: 10.1007/978-981-10-4567-7_4. Adv Exp Med Biol. 2017. PMID: 28815521 Review.
-
Mitochondrial ceramide-rich macrodomains functionalize Bax upon irradiation.PLoS One. 2011;6(6):e19783. doi: 10.1371/journal.pone.0019783. Epub 2011 Jun 13. PLoS One. 2011. PMID: 21695182 Free PMC article.
Cited by
-
Comparison among Neuroblastoma Stages Suggests the Involvement of Mitochondria in Tumor Progression.Biomedicines. 2023 Feb 17;11(2):596. doi: 10.3390/biomedicines11020596. Biomedicines. 2023. PMID: 36831133 Free PMC article.
-
Mitochondria-associated endoplasmic reticulum membrane (MAM): a dark horse for diabetic cardiomyopathy treatment.Cell Death Discov. 2024 Mar 20;10(1):148. doi: 10.1038/s41420-024-01918-3. Cell Death Discov. 2024. PMID: 38509100 Free PMC article. Review.
-
MAMs and Mitochondrial Quality Control: Overview and Their Role in Alzheimer's Disease.Neurochem Res. 2024 Oct;49(10):2682-2698. doi: 10.1007/s11064-024-04205-w. Epub 2024 Jul 13. Neurochem Res. 2024. PMID: 39002091 Review.
-
Get Closer to the World of Contact Sites: A Beginner's Guide to Proximity-Driven Fluorescent Probes.Contact (Thousand Oaks). 2022 Dec 15;5:25152564221135748. doi: 10.1177/25152564221135748. eCollection 2022 Jan-Dec. Contact (Thousand Oaks). 2022. PMID: 37366505 Free PMC article. Review.
-
Compositions and Functions of Mitochondria-Associated Endoplasmic Reticulum Membranes and Their Contribution to Cardioprotection by Exercise Preconditioning.Front Physiol. 2022 Jun 6;13:910452. doi: 10.3389/fphys.2022.910452. eCollection 2022. Front Physiol. 2022. PMID: 35733995 Free PMC article. Review.
References
-
- Anastasia I, Ilacqua N, Raimondi A, Lemieux P, Ghandehari‐Alavijeh R, Faure G, Mekhedov SL, Williams KJ, Caicci F, Valle G et al (2021) Mitochondria‐rough‐ER contacts in the liver regulate systemic lipid homeostasis. Cell Rep 34: 108873 - PubMed
Publication types
MeSH terms
Substances
Grants and funding
LinkOut - more resources
Full Text Sources
Other Literature Sources
Medical
Research Materials
Miscellaneous
