. 2022 Mar;29(3):194-202.
doi: 10.1038/s41594-021-00718-y. Epub 2022 Feb 24.

Seipin forms a flexible cage at lipid droplet formation sites

Affiliations

Seipin forms a flexible cage at lipid droplet formation sites

Henning Arlt et al. Nat Struct Mol Biol. 2022 Mar.

Abstract

Lipid droplets (LDs) form in the endoplasmic reticulum by phase separation of neutral lipids. This process is facilitated by the seipin protein complex, which consists of a ring of seipin monomers, with a yet unclear function. Here, we report a structure of S. cerevisiae seipin based on cryogenic-electron microscopy and structural modeling data. Seipin forms a decameric, cage-like structure with the lumenal domains forming a stable ring at the cage floor and transmembrane segments forming the cage sides and top. The transmembrane segments interact with adjacent monomers in two distinct, alternating conformations. These conformations result from changes in switch regions, located between the lumenal domains and the transmembrane segments, that are required for seipin function. Our data indicate a model for LD formation in which a closed seipin cage enables triacylglycerol phase separation and subsequently switches to an open conformation to allow LD growth and budding.


Conflict of interest statement

The authors declare no competing interests.

Figures
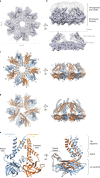
Fig. 1
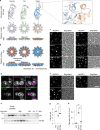
Fig. 1. Cryo-EM structure of yeast seipin Sei1.
a, Cryo-EM density map of purified seipin oligomers shows the density of the lumenal domain and TM segments. The five symmetrical subunits are indicated by dashed lines. b, Sideview of cryo-EM density map. Top, overlay of unsharpened density map (semitransparent gray) showing the shape of the micelle, with sharpened map (purple). Bottom, sliced view of EM density map reveals cage-like structure. Position of ER membrane is indicated with gray lines. c,d, Model of seipin show ten seipin subunits per oligomer. Top view from the cytosolic side. c, Model contains residues 17–264 for both A and B conformations, except loop residues 134–147, which are not observed in the EM density map. d, Extended structural model beyond EM density map contains residues 11–283 for conformation A (blue) and residues 8–285 for conformation B (orange) modeled by AI-assisted structure prediction. e, Seipin oligomers contain two alternating monomer conformations termed A (blue) and B (orange) that differ only in the switch and TM region, while the lumenal domains have the same structure.
Fig. 2
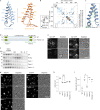
Fig. 2. Interactions of seipin lumenal domains are sufficient for oligomerization but are not required for seipin function.
a, Comparison of seipin lumenal domain structural models of monomers and oligomers from fly (PDB 6MLU), human (PDB 6DS5) and yeast. Magnified box shows detailed view of yeast central helix, including neighboring monomer. b, Hydrophobic surfaces of human, fly and yeast seipin lumenal domains indicate hydrophobic helices present in human and fly, but not yeast seipin. Blue indicates the least hydrophobic and orange the most hydrophobic residues based on the Kyte–Doolittle scale. c, LD morphology of strains expressing central helix mutants from seipin genomic locus. Cells were grown to high density and LDs were stained with BODIPY. Scale bar, 5 µm. d, WT and R178A localize normally to the ER and form seipin foci. C-terminal GFP-tagged WT and R178A expressed from plasmids in sei1∆ cells. ssHDEL was also expressed from a plasmid. Scale bar, 5 µm. e, Seipin WT shows two peaks in size-exclusion chromatography of membrane extract in Triton X-100 from cell expressing SEI1-13xmyc WT and R178A mutant from endogenous promoter. Immunoblot with anti-myc antibodies. Representative of two biologically independent experiment repeats is shown. f, Microscopy analysis of cell expressing indicated seipin mutants from endogenous locus driven by PGK1 promoter with C-terminal 13xmyc tag or deleted for seipin (sei1∆). Staining as in c. Scale bar, 5 µm. g,h, Quantification of LD morphology from the experiment shown in f. LDs per cell (g) and cells with LD area >0.5µm2 (h) were analyzed from n = 4 biologically independent experiments. Data were analyzed with one-way ANOVA and Holm–Sidak’s post hoc comparisons; *P < 0.05; **P < 0.01; ***P < 0.001. Graphs indicate mean value; one dot indicates one separate experiment. Source data
Fig. 3
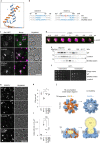
Fig. 3. TM domain intramolecular interactions are important for seipin function and oligomer formation.
a, Detailed view of TM segments and switch regions in conformation A (blue) and B (orange); labeled residues are predicted to be involved in intramolecular contacts. b, Evolutionary coupling residues in yeast seipin highlight potential interactions in the TM segment regions. On the left, the membrane-embedded region is magnified. c, Extended seipin structural model of conformation A, showing amino acids at least ten residues apart in the primary sequence predicted to have beta-carbons interacting within 10 Å distance, with maximal probability and over 70% probability mass, mapped onto the final model. Green dotted lines indicates that the actual distance is within 10 Å, yellow within 12 Å, and red for >12 Å. View similar to the left side of a. d, Overview of mutant constructs used in this figure. TMS, TM segments. e, Seipin TM segment mutants integrate normally into the membrane and form WT-like foci. Seipin WT and indicated mutants expressed as C-terminal GFP fusion constructs from plasmids in sei1∆ cells. Scale bar, 5 µm. f, Seipin intramolecular TM mutants form normal oligomers. Size-exclusion chromatography of membrane extract in Triton X-100 from cells expressing PGK1 promoter driven seipin and indicated mutants from the endogenous locus with C-terminal 13xmyc tag. Immunoblot with anti-myc antibodies. Representative of two biologically independent experiment repeats is shown. g, LD morphology phenotype of strains expressing patch mutants from PGK1 promoter. Densely grown cells were stained with BODIPY to visualize LDs. Scale bar, 5 µm. h,i, Quantification of experiment shown in g. One dot equals one separate experiment. LDs per cell (h) and cells containing LDs with area >0.5µm2 (i) analyzed from n = 3 biologically independent experiments. Data were analyzed with one-way ANOVA and Holm–Sidak’s post hoc comparisons; **P < 0.01; NS, not significant. Source data
Fig. 4
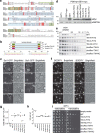
Fig. 4. The seipin switch regions are required for seipin complex formation and function.
a, Detailed view of conformational change in C-terminal membrane helix comparing superimposed conformations A and B. Conformation A shows kinked alpha helix, and conformation B has an extended helix. b, Overview of switch mutant constructs. c, Seipin switch mutants forms large ring structures around LDs. Cells expressing C-terminal GFP-tagged seipin and indicated mutants from plasmids in sei1∆ cells. LDs were stained with autodot dye. Scale bar, 5 µm. White box indicated area is shown in d. d, Enlarged view and z-stack of seipin ring structures shown in ∆-switch mutant in c. Scale bar, 1 µm. e, Shuffled-switch mutant is unable to form WT-like oligomers in detergent extracts. Size-exclusion analysis of membrane extract from cells expressing SEI1-13xmyc or indicated mutants from the endogenous locus driven by integrated PGK1 promoter. Representative immunoblots of two biologically independent experiment repeats is shown. f, Growth of yeast strain sei1∆ carrying plasmids with C-terminally GFP-tagged SEI1 (WT), or indicated mutants on synthetic medium ± 100 µg ml−1 terbinafine. g, LD morphology analysis of strains shown in e. Scale bar, 5 µm. h,i, Quantification of LD morphology analysis shown in f. LDs per cell (h) and cells containing LDs with area >0.5µm2 (i) from n = 3 biologically independent experiments. Data were analyzed with one-way ANOVA and Holm–Sidak’s post hoc comparisons; *P < 0.05; NS, not significant. j, Model of seipin function in TG phase separation and LD budding by changing conformations of the TM segments. Left side shows the conformation we obtained experimentally, and right side a predicted version of an ‘open’ conformation based on all TM segments in the A conformation. Bottom model shows side views with TG accumulation in the complex. Source data
Extended Data Fig. 1
Extended Data Fig. 1. Transmembrane segments of seipin are conserved and required for function.
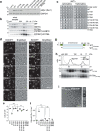
(a) Sequence alignment of yeast (Saccharomyces cerevisiae) seipin (Sei1) protein sequence with Drosophila melanogaster (dseipin) and human seipin (hseipin) in T-COFFEE, plotted in ESPript 3.0. Identical residues are colored in red boxes, red characters and blue framed residues indicate similarity in a group or across groups, respectively. TM segments are colored in green and lumenal domains in cyan background similar to overview in b. (b) Overview of mutants analyzed in this figure. Detailed sequence information yeast seipin constructs is shown at the bottom for WT (green), shuffled-TMS (orange) and FIT2-TMS (pink). TMS, transmembrane segment. (c) Localization of seipin WT and mutant constructs expressed from plasmids in sei1∆ cells. Size bar = 5 µm. (d) Expression level of WT and mutant constructs tagged with C-terminal 13xmyc. SEI1-myc indicates expression level from endogenous promoter. (e) Transmembrane mutants form normal oligomers in detergent extracts. Size-exclusion analysis of membrane extract from cells expressing SEI1-13xmyc or indicated mutants from the endogenous locus driven by integrated PGK1 promoter. Representative immunoblots of two biologically independent experiment repeats are shown. (f) Analysis of LD morphology using BODIPY staining. Seipin mutants with C-terminal 13xmyc tag were expressed from PGK1 promoter. Size bar = 5 µm. (g,h) Quantification of experiment in panel f. n=3 biologically independent experiments. (i) Growth of indicated mutants on synthetic medium ± 100 µg/ml terbinafine. Source data
Extended Data Fig. 2
Extended Data Fig. 2. Purification and cryo-EM image processing of yeast seipin-Ldb16 complex.
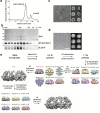
(a) Sei1-Ldb16 complex was purified from yeast as described in Experimental Procedures. After extraction of the complex in Triton X-100, detergent was subsequently exchanged to digitonin, and finally to PmalC8. The complex was separated by size-exclusion chromatography column in buffer without detergents. (b) Analysis of 1-ml fractions (8–18 ml) after SDS-PAGE by Coomassie Blue staining (top) or Western-blot (bottom). (c) Representative negative stain-EM image of purified complexes shown in a and b. Right side shows 2D class averages. White boxes indicate single oligomers. Size-bar, 500 Å. (d) Representative cryo-EM image of purified Sei1-Ldb16 complex. Right side shows 2D class averages. White boxes indicate single oligomers. Size-bar, 500 Å. (e) Three-dimensional classification and refinement of cryo-EM particles in Relion 3.0. Source data
Extended Data Fig. 3
Extended Data Fig. 3. Single-particle cryo-EM analysis of Sei1-Ldb16 complex.
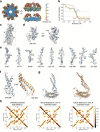
(a) Local resolution mapped onto EM density map using Resmap shows differences between lumenal and transmembrane regions of the map. (b) FSC curves: gold-standard FSC curve between the two half maps with indicated resolution at FSC = 0.143 (red); half-map 1 (green), half-map 2 (orange) and the atomic model refined against half map 1 (blue). (c-e) Superimposed cryo-EM densities from sharpened map with atomic model for central alpha-helices (d) and individual beta-sheets (e). (f) Superimposed cryo-EM densities from unsharpened map with atomic model for TM segments of conformation A (blue) and conformation B (orange). (g) Extended models for conformation A (left) and B (right). Residues at least 10 residues apart in the primary sequence predicted to have beta-carbons interacting within 10 Å distance, with maximal probability and over 70% probability mass, mapped onto the final model of conformation A (left) and B (right). Green indicates that the actual distance is within 10Å, yellow within 12Å, and red for >12Å. (h) The predicted and actual distances between beta-carbons of residues in the seipin monomer. The color of each pixel corresponds to the distance in Å between these atoms. Plotted on the left is the least distance predicted by trRosetta for each pair of CB atoms. In the middle are actual distances in conformations A, and conformation B (right). The trRosetta pipeline correctly predicts interactions between the N- and C-terminal helices for both conformations (from residues 10–40 and 250–280).
Extended Data Fig. 4
Extended Data Fig. 4. Mutants in seipin’s lumenal central helix retain function in vivo.
(a) Western blot analysis of seipin expression level. Cells expressing WT or indicated mutant constructs with C-terminal 13xmyc tag from the endogenous promoter. Sei1 detected with anti-myc antibodies. (b,c) Quantification of images shown in Fig. 2c. n=3 biologically independent experiments. (d) Growth of yeast strain sei1∆ carrying vectors with C-terminally GFP-tagged SEI1 sequences or empty vector on synthetic medium ± 100 µg/ml terbinafine. (e) Western blot analysis of whole-cell-lysates from strains in d using antibodies against GFP to detect seipin, against Ldb16 or Pgk1 as loading control. Representative immunoblots of two biologically independent experiment repeats is shown. Source data
Extended Data Fig. 5
Extended Data Fig. 5. Lumenal domain interactions are mediated by R178.
(a) Western blot analysis with anti-myc antibodies of lysate from strains expressing WT seipin or indicated point mutations from the endogenous locus with C-terminal 13xmyc tag. (b) Size-exclusion chromatography of Triton X-100 solubilized membrane extracts of indicated strains expressing C-terminal 13xmyc-tagged seipin. Representative immunoblots of two biologically independent experiment repeats is shown. (c) Growth of yeast strain sei1∆ carrying vectors with C-terminally GFP-tagged SEI1 mutants or empty vector on synthetic medium ± 100 µg/ml terbinafine. (d) LD morphology of strains expressing indicated seipin mutants with C-terminal 13xmyc from endogenous locus. Size bar, 5 µm, (e,f) Quantification of experiment shown in d. n=4 biologically independent experiments. Data were analyzed with one-way ANOVA and Holm-Sidak’s posthoc comparisons; *, p<0.05; **, p<0.01; ***, p<0.001, ns, not significant. (g) Overview of lumenal domain construct purified from E. coli. (h) Size-exclusion chromatography analysis of affinity purified WT lumenal domain (WT(47-235)) or R178A(47-235). Top, traces of absorbance at 280 nm in mAu of WT and R178A lumenal domains. Bottom, SDS-PAGE analysis of 1-ml fractions by Coomassie staining. (i) Negative stain-EM analysis of WT lumenal domain oligomers shown in h. Right side shows 2D class averages. Size-bar, 500 Å. Source data
Extended Data Fig. 6
Extended Data Fig. 6. Potential TG binding mutant retains function in vivo.
(a) Western blot analysis of whole-cell lysates from strains expressing C-terminal 13xmyc tagged seipin from endogenous or PGK1 promoter. (b) Western blot analysis of fractions from size-exclusion chromatography of Triton X-100 solubilized membrane extracts carrying potential TG binding mutant C260L S266L T269I with C-terminal 13xmyc. (c) Growth of yeast strain sei1∆ carrying plasmids with C-terminally GFP-tagged SEI1 from yeast (WT), or indicated mutant on synthetic medium ± 100 µg/ml terbinafine. (d) Localization of seipin WT-GFP and C260L S266L T269I-GFP mutant expressed from plasmids in sei1∆ cells. Size bar, 5 µm (e) Analysis of LD morphology using BODIPY staining. Seipin mutants with C-terminal 13xmyc tag were expressed from PGK1 promoter. Size bar = 5 µm. (f,g) Quantification of experiment in panel d. n=3 biologically independent experiments. Source data
Extended Data Fig. 7
Extended Data Fig. 7. Intramolecular transmembrane segment interactions are crucial for seipin function.
(a) Western blot analysis of whole-cell lysates from strains expressing C-terminal 13xmyc tagged seipin variants from endogenous or PGK1 promoter. (b) Western blot analysis of fractions from size-exclusion chromatography of Triton X-100 solubilized membrane extracts carrying Patch mutants combined with R178A and C-terminal 13xmyc. (c) Growth of yeast strain sei1∆ carrying plasmids with C-terminally GFP-tagged SEI1 from yeast (WT), or indicated mutants. (d) Western blot analysis of whole-cell lysates from strains expressing indicated seipin mutants under control of the PGK1 promoter and C-terminal 13xmyc tag. Representative immunoblots of two biologically independent experiment repeats is shown. (e) Immuno-precipitation of indicated seipin mutants via anti-myc resin. Equal amounts of load (detergent solubilized membranes in Tx100) and eluate fractions were loaded. n=2 biologically independent repeats. Source data
Extended Data Fig. 8
Extended Data Fig. 8. Transmembrane segment architecture is conserved.
(a,b) Highest ranking evolutionary couplings (green lines) within seipin transmembrane and switch regions mapped onto (a) D. melanogaster or (b) human sequences. Yellow and green helices indicate secondary structure prediction by Phyre2 of membrane embedded or hydrophilic helices, respectively. Coupling residues are indicated in bold. (c) Growth of yeast strain sei1∆ carrying plasmids with C-terminally GFP-tagged SEI1 from yeast (WT), D. melanogaster (dmSeipin), human (hSeipin) or chimeric constructs on synthetic medium ± 100 µg/ml terbinafine. (d) The architecture of seipin transmembrane helices is predicted to be conserved. Comparison of switch and transmembrane regions of our structural model (left) with predicted structure of yeast (S. cerevisiae); worm (C. elegans), fly (D. melanogaster) or human by AlphaFold.
Extended Data Fig. 9
Extended Data Fig. 9. Switch regions are required for seipin function.
(a) Sequence alignment of seipin sequences from different species shows conserved F232xxGLR sequence motif. Identical residues are colored in red boxes, red characters and blue framed residues indicate similarity in a group or across groups, respectively. (b) Western blot analysis of whole cell lysates from strains expressing indicated switch mutants or WT seipin under control of the PGK1 promoter with C-terminal 13xmyc tag. Source data

Similar articles

Cited by

References

    1. Walther TC, Farese RV., Jr. Lipid droplets and cellular lipid metabolism. Annu. Rev. Biochem. 2012;81:687–714. - PMC - PubMed
    1. Zechner R, Madeo F, Kratky D. Cytosolic lipolysis and lipophagy: two sides of the same coin. Nat. Rev. Mol. Cell Biol. 2017;18:671–684. - PubMed
    1. Monson EA, et al. Intracellular lipid droplet accumulation occurs early following viral infection and is required for an efficient interferon response. Nat. Commun. 2021;12:4303. - PMC - PubMed
    1. Masaki T, et al. Interaction of hepatitis C virus nonstructural protein 5A with core protein is critical for the production of infectious virus particles. J. Virol. 2008;82:7964–7976. - PMC - PubMed
    1. Graef M. Lipid droplet-mediated lipid and protein homeostasis in budding yeast. FEBS Lett. 2018;592:1291–1303. - PMC - PubMed

Publication types

MeSH terms

Substances