. 2022 Mar 1;36(5-6):313-330.
doi: 10.1101/gad.349039.121. Epub 2022 Feb 24.

Rap1 regulates TIP60 function during fate transition between two-cell-like and pluripotent states

Affiliations

Rap1 regulates TIP60 function during fate transition between two-cell-like and pluripotent states

Raymond Mario Barry et al. Genes Dev. .

Abstract

In mammals, the conserved telomere binding protein Rap1 serves a diverse set of nontelomeric functions, including activation of the NF-kB signaling pathway, maintenance of metabolic function in vivo, and transcriptional regulation. Here, we uncover the mechanism by which Rap1 modulates gene expression. Using a separation-of-function allele, we show that Rap1 transcriptional regulation is largely independent of TRF2-mediated binding to telomeres and does not involve direct binding to genomic loci. Instead, Rap1 interacts with the TIP60/p400 complex and modulates its histone acetyltransferase activity. Notably, we show that deletion of Rap1 in mouse embryonic stem cells increases the fraction of two-cell-like cells. Specifically, Rap1 enhances the repressive activity of Tip60/p400 across a subset of two-cell-stage genes, including Zscan4 and the endogenous retrovirus MERVL. Preferential up-regulation of genes proximal to MERVL elements in Rap1-deficient settings implicates these endogenous retroviral elements in the derepression of proximal genes. Altogether, our study reveals an unprecedented link between Rap1 and the TIP60/p400 complex in the regulation of pluripotency.

Keywords: 2C-like; EPC1; MERVL; RAP1; TIP60; ZSCAN4; telomere.


Figures

Figure 1.
Figure 1.
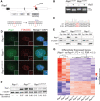
Rap1 maintains gene transcription independent of telomeres. (A) Schematic representation of CRISPR/Cas9 gene-editing strategy to substitute Rap1 isoleucine 312 with arginine. Successful targeting creates an AciI restriction site to be used during genotyping. Single-stranded oligo donor (ssODN, black line) and cut site (red scissors) are indicated. (B) PCR genotyping of tail tip DNA from two Rap1I312R/+ heterozygous mice following gene targeting. (C) Example Sanger sequencing of a Rap1I312R/+ heterozygous mouse. (D) Representative image of IF-FISH in Rap1+/+, Rap1−/−, and Rap1I312R/I312R MEFs for Rap1 (green) and telomeres (red) using Rap1 antibody and a TTAGGG PNA probe, respectively. DAPI (blue) was used as a counterstain. (E) Rap1 Western blot from Rap1−/−, Rap1+/+, and Rap1I312R/I312R MEFs following subcellular fractionation into cytoplasmic (Cyt), nucleoplasmic (Nuc), and chromatin-bound (CBFs) fractions. α-Tubulin and histone H3 were loading controls for Cyt and CBFs, respectively. The blot is representative of n = 2 biological replicates. (F) Immunoblot for Rap1 from whole-cell lysates obtained from Rap1−/− (n = 2), Rap1+/+ (n = 3), and Rap1I312R/I312R (n = 3) MEFs. Rap1 relative abundance was determined by normalizing to γ-tubulin. (G) Hierarchically clustered heat map representing RNA-seq data for differentially expressed genes (DEGs) between Rap1+/+ and Rap1−/− MEFs (FC > 1.5; FDR < 0.1; n = 3 biological replicates per genotype). (Rap1IR/IR) Rap1I312R/I312R.
Figure 2.
Figure 2.
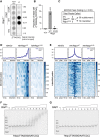
Rap1-I312R does not bind to genomic loci or DNA. (A) Dot blot for telomere repeats following ChIP using anti-HA antibody in cells expressing HA-tagged Rap1-WT, Rap1-I312R, or empty vector (EV) control (n = 2 biological replicates). Signal intensity was determined by normalizing to input. (B) High-throughput sequencing of ChIP samples as in A. Telomere binding was determined by calculating the proportion of reads with at least three telomere (TTAGGG)3/(CCCTAA)3 repeats. Data are the mean ± standard deviation of n = 4 biological replicates. (C) Summary of ChIP-seq peak calling analysis that identified 109 peaks in HA-Rap1-WT samples (MACS2; q < 0.05). Peaks were classified as subtelomeric if localized within 500 kb from the telomere. (D) Heat map representing ChIP-seq profiles of HA-Rap1-WT peaks at chromosome ends. (E) Heat map representing ChIP-seq profiles of HA-Rap1-WT interstitial peaks. (F) Electrophoretic mobility shift assay (EMSA) using His-tagged RAP (0–15 µM) and a 74-bp TTAGGG/AATCCC double-stranded DNA (100 nM). (G) EMSA using non-His-tagged RAP (0–15 µM) and a 74-bp TTAGGG/AATCCC double-stranded DNA (100 nM).
Figure 3.
Figure 3.
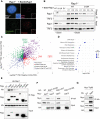
Proximity-dependent biotinylation reveals extratelomeric Rap1 binding partners. (A) Representative image of IF-FISH in Rap1−/− MEFs expressing BioID-Rap1-WT stained for BioID-Rap1 (magenta), biotin (green), and telomeres (red) using anti-Flag antibody, streptavidin, and TTAGGG PNA probe, respectively. DAPI (blue) was used as a counterstain. (B) Immunoblot for Rap1 and TRF2 following streptavidin pull-down in Rap1−/− MEFs expressing BioID-Rap1-WT (n = 3 biological replicates; clones C1, C2, and C3), BioID-Rap1-I312R (n = 4 biological replicates; clones C1, C2, C3, and C4), and BioID alone (EV). Where indicated, cells were treated with 50 µM biotin for 20 h prior to harvest. (C) Scatter plot representing log2 fold change in peptide spectrum match (PSM) of proteins identified by BioID-Rap1-WT versus BioID-Rap1-I312R. Fold change values were calculated relative to no biotin and BioID-alone controls. Each dot represents a unique protein. Known Tip60/p400 (green and purple) and shelterin (red) complex members are indicated. (D) Graphical representation of the top 10 biological processes overrepresented in BioID-Rap1-I312R streptavidin pull-down (FC > 2) using the PANTHER classification system statistical overrepresentation test. (E) Co-IP of Flag-tagged Tip60/p400 subunits (Tip60, Epc1, Epc2, Dmap1, Brd8, Ruvbl1, and Actl6a) and HA-Rap1 following cotransfection in HEK293T cells. (F) Reciprocal co-IP of HA-Rap1-I312R and Myc-tagged Epc1 or Epc2. Co-IP of HA-Rap1 or HA-Rap1-I312R with TRF2 was used as a control. (G) Reciprocal co-IP of HA-Rap1 and Myc-Tip60.
Figure 4.
Figure 4.
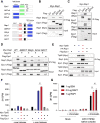
Rap1 forms a complex with and modulates the histone acetyltransferase (HAT) activity of Tip60/Epc1. (A) Schematic illustration of mouse Epc1 and Rap1 protein domains and deletion mutant constructs used for co-IP assays. (B) Co-IP of Flag-Epc1 deletion mutants and Myc-Rap1 in cotransfected HEK293T cells. Western blot analysis for input and IP sample was performed with the indicated antibody. (C) Co-IP of the Flag-Epc1 EPcA domain and Myc-Rap1. (D) Co-IP of Flag-Rap1 deletion mutants and Myc-Epc1. (E) Co-IP of Flag-Epc1, Myc-Tip60, and HA-Rap1. (F) Histone acetyltransferase (HAT) activity assays performed using co-IPs from E on core histones. Data are the counts per minute (CPM) mean ± standard deviation of n = 2 technical replicates; two-way ANOVA, and Tukey's multiple comparison test. (*) P-value < 0.0001. (G) HAT activity assay using affinity-purified human EPC1/TIP60 and RAP1 (increasing amounts) on short oligonucleosome chromatin. Bovine serum albumin (BSA) was a negative control. Data are CPM mean ± standard deviation of n = 3 technical replicates; two-way ANOVA, and Tukey's multiple comparison test. (*) P-value < 0.01.
Figure 5.
Figure 5.
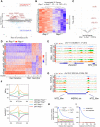
Rap1 suppresses the 2C-like state by enhancing Tip60/p400 repression of 2C genes. (A) MA plot of log2 fold changes in gene expression in Rap−/− versus Rap1+/+ mESCs. Up-regulated (light red) and down-regulated (light blue) genes are indicated (FC > 1.5; FDR < 0.1; n = 5 biological replicates). 2C-stage genes are highlighted in dark red. (B) Hierarchically clustered heat map representing RNA-seq data of 2C genes up-regulated in Rap−/− versus Rap1+/+ mESCs (n = 5 biological replicates). (C) Volcano plot of differential repeat expression analysis in Rap1−/− versus Rap1+/+ mESCs. Up-regulated (red) and down-regulated (blue) repeats are indicated (FC > 2; FDR < 0.1; n = 5 biological replicates). (D) Kmeans (k = 5) clustered heat map representing RNA-seq data of 2C genes in Rap1+/+ (gray bar) and Rap1−/− (red bar) mESCs treated with siRNAs targeting Tip60/p400 subunits (Epc1, Tip60, p400, and Dmap1) or nontargeting (siNT) control (n = 3 biological replicates were used per condition). (E) ChIP-seq profiles of H4Ac and AcH2A.Z at the Zscan4d gene locus in Rap1+/+ (gray bar) and Rap1−/− (red bar) mESCs transfected with siRNA targeting Dmap1 or nontargeting (siNT) control. Profiles plotted are representative of n = 3 biological replicates. (F) Density plot centered at all MT2_Mm sites (n = 2667) for H4Ac and AcH2A.Z ChIP-seq data. Density plots are representative of n = 3 biological replicates. (G) ChIP-seq profiles of H4Ac and AcH2A.Z at a representative MERVL site in Rap1+/+ (gray bar) and Rap1−/− (red bar) mESCs transfected with siRNA targeting Dmap1 and nontargeting control (siNT). (H) Plot of the proportion of differentially expressed genes (DEGs) in Rap1+/+ versus Rap1−/− mESCs (FC > 1.5; FDR < 0.1) at fixed distances from the indicated MERVL (MT2_Mm, n = 2667; MT2B1, n = 7248; and MT2C_Mm, n = 1982) and LINE1 (Lx5, n = 16339; Lx3_Mus, n = 12651; L1Md_A, n = 16844; and L1Md_F n = 4016) repeat sequences. Proportions were calculated by dividing the number of DEGs by the total number of genes. (I) Plot of the proportion of up-regulated (blue) and down-regulated (red) DEGs in Rap1+/+ versus Rap1−/− mESCs (FC > 1.5; FDR < 0.1) at fixed distances from MT2_Mm repeat sequences.

Similar articles

Cited by

References

    1. Abmayr SM, Yao T, Parmely T, Workman JL. 2006. Preparation of nuclear and cytoplasmic extracts from mammalian cells. Curr Protoc Mol Biol. 75: 12.1.1–12.1.10. 10.1002/0471142727.mb1201s75 - DOI - PubMed
    1. Acharya D, Hainer SJ, Yoon Y, Wang F, Bach I, Rivera-Pérez JA, Fazzio TG. 2017. KAT-independent gene regulation by Tip60 promotes ESC self-renewal but Not pluripotency. Cell Rep 19: 671–679. 10.1016/j.celrep.2017.04.001 - DOI - PMC - PubMed
    1. Allard S, Utley RT, Savard J, Clarke A, Grant P, Brandl CJ, Pillus L, Workman JL, Cȏté J. 1999. Nua4, an essential transcription adaptor/histone H4 acetyltransferase complex containing Esa1p and the ATM-related cofactor Tra1p. EMBO J 18: 5108–5119. 10.1093/emboj/18.18.5108 - DOI - PMC - PubMed
    1. Arat NO, Griffith JD. 2012. Human Rap1 interacts directly with telomeric DNA and regulates TRF2 localization at the telomere. J Biol Chem 287: 41583–41594. 10.1074/jbc.M112.415984 - DOI - PMC - PubMed
    1. Armache KJ, Garlick JD, Canzio D, Narlikar GJ, Kingston RE. 2011. Structural basis of silencing: Sir3 BAH domain in complex with a nucleosome at 3.0 Å resolution. Science 334: 977–982. 10.1126/science.1210915 - DOI - PMC - PubMed

Publication types

Substances