. 2022 Mar 23;96(6):e0201121.
doi: 10.1128/jvi.02011-21. Epub 2022 Mar 23.

Plasma-Derived HIV-1 Virions Contain Considerable Levels of Defective Genomes

Affiliations

Plasma-Derived HIV-1 Virions Contain Considerable Levels of Defective Genomes

Katie Fisher et al. J Virol. .

Abstract

Genetically-characterizing full-length HIV-1 RNA is critical for identifying genetically-intact genomes and for comparing these RNA genomes to proviral DNA. We have developed a method for sequencing plasma-derived RNA using long-range sequencing (PRLS assay; ∼8.3 kb from gag to the 3' end or ∼5 kb from integrase to the 3' end). We employed the gag-3' PRLS assay to sequence HIV-1 RNA genomes from ART-naive participants during acute/early infection (n = 6) or chronic infection (n = 2). On average, only 65% of plasma-derived genomes were genetically-intact. Defects were found in all genomic regions but were concentrated in env and pol. We compared these genomes to near-full-length proviral sequences from paired peripheral blood mononuclear cell (PBMC) samples for the acute/early group and found that near-identical (>99.98% identical) sequences were identified only during acute infection. For three participants who initiated therapy during acute infection, we used the int-3' PRLS assay to sequence plasma-derived genomes from an analytical treatment interruption and identified 100% identical genomes between pretherapy and rebound time points. The PRLS assay provides a new level of sensitivity for understanding the genetic composition of plasma-derived HIV-1 RNA from viremic individuals either pretherapy or after treatment interruption, which will be invaluable in assessing possible HIV-1 curative strategies. IMPORTANCE We developed novel plasma-derived RNA using long-range sequencing assays (PRLS assay; 8.3 kb, gag-3', and 5.0 kb, int-3'). Employing the gag-3' PRLS assay, we found that 26% to 51% of plasma-derived genomes are genetically-defective, largely as a result of frameshift mutations and deletions. These genetic defects were concentrated in the env region compared to gag and pol, likely a reflection of viral immune escape in env during untreated HIV-1 infection. Employing the int-3' PRLS assay, we found that analytical treatment interruption (ATI) plasma-derived sequences were identical and genetically-intact. Several sequences from the ATI plasma samples were identical to viral sequences from pretherapy plasma and PBMC samples, indicating that HIV-1 reservoirs established prior to therapy contribute to viral rebound during an ATI. Therefore, near-full-length sequencing of HIV-1 particles is required to gain an accurate picture of the genetic landscape of plasma HIV-1 virions in studies of HIV-1 replication and persistence.

Keywords: human immunodeficiency virus.


Conflict of interest statement

The authors declare no conflict of interest.

Figures

FIG 1
FIG 1
Lower limits of PRLS assay. Plasma samples were diluted to a range of different copy numbers, followed by sequencing of amplified positives. The number of positives obtained per dilution was plotted against the copy number in the extraction detected by ddPCR. A simple linear regression was calculated to determine the reproducibility of the assay for each diluted plasma sample. (A) For the gag-3′ assay, plasma samples from participants P6 and P7 were diluted to copy numbers ranging from >10,000 copies to <1,000 copies. (B) For the int-3‘assay, plasma samples from participants P6, P7, and P8 were diluted to copy numbers ranging from 10,000 copies to <100 copies.
FIG 2
FIG 2
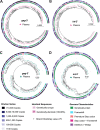
Phylogeny of sequenced plasma-derived genomes from diluted plasma. Pre-ART plasma samples from participants P6 and P7 were diluted to copy numbers ranging from >10,000 copies to <1,000 copies for the gag-3′ assay and from 10,000 copies to <100 copies for the int-3′ assay, followed by sequencing of the amplified positives. Phylogenetic trees were prepared from the sequenced gag-3′ (A and C) and int-3′ (B and D) genomes for participants P6 (A and B) and P7 (C and D). Outer rings of the trees show the estimated copy number of the sample from which the sequence was amplified, middle rings show whether the sequence is >99.98% identical to another sequence in the tree, and inner rings show whether the sequences are classified as genetically-intact or defective within the sequenced region with each type of defect shown. All sequences on the trees are plasma-derived, as indicated by triangles. Branches with bootstrap values of ≥75 are indicated by an asterisk beside the node.
FIG 3
FIG 3
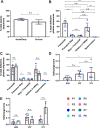
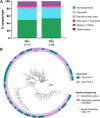
Types of defects present in the plasma of ART-naive HIV-1-infected individuals. gag-3′ RNA genomes were amplified using PRLS and sequenced from the plasma of 8 ART-naive HIV-1-infected participants. The acute/early participants (n = 6) are depicted by circles, and the chronic participants are depicted by squares (n = 2). (A) Proportion of total plasma-derived gag-3′ sequences that were genetically-intact in the acute/early group versus the chronic group. (B and C) Proportions of total genetically-defective plasma-derived gag-3′ genomes with different types of genetic defects: acute/early and chronic groups combined (B) or separated (C). Data are represented as the median ± IQR. (D and E) For full-length plasma-derived gag-3′ genomes that lack deletions >100 bp in size, the number of defects (premature stop codons and frameshift mutations combined) found in gag, pol, or env was divided by the number of full-length genomes amplified per participant. This was compared between these three genomic regions for the acute/early and chronic participant groups combined (D) and separately (E). Data are represented as the mean ± SD. *, P < 0.05; **, P < 0.01; ***, P < 0.001; n.s., P > 0.05.
FIG 4
FIG 4
Phylogenetic trees of pre-ART plasma- and PBMC-derived sequences for the early infection group. All pre-ART plasma- and PBMC-derived sequences, excluding hypermutated sequences, were trimmed and aligned in the gag-3′ region, and phylogenetic trees were prepared for participants P1 (A) and P2 (B). PBMC-derived sequences are represented by circles, while plasma-derived sequences are represented by triangles. Inner rings show whether a sequence is genetically-intact or defective for each type of defect shown. PBMC-derived sequences are classified as intact or defective based on the FLIPS 9 kb sequence, while plasma-derived sequences are classified as intact or defective in the gag-3′ region (8.3 kb). Middle rings indicate whether a sequence is identical to another sequence only within the plasma or PBMC compartments. PBMC-derived sequences are classified as identical to another PBMC sequence if they are 100% identical in the gag-3′ region, while plasma-derived sequences are classified as identical to another plasma sequence if they are >99.98% identical to another sequence. Outer rings indicate whether a plasma sequence is 99.98% identical or 100% identical to a PBMC sequence. Branches with bootstrap values of ≥75 are indicated by an asterisk beside the node.
FIG 5
FIG 5
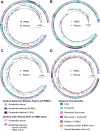
Phylogenetic trees of pre-ART plasma- and PBMC-derived sequences for the acute infection group. All pre-ART plasma- and PBMC-derived sequences, excluding hypermutated sequences, were trimmed and aligned in the gag-3′ region, and phylogenetic trees were prepared for participants P3 (A), P4 (B), P5 (C), and P6 (D). PBMC-derived sequences are represented by circles, while plasma-derived sequences are represented by triangles. Inner rings show whether a sequence is genetically-intact or defective for each type of defect shown. PBMC-derived sequences are classified as intact or defective based on the FLIPS 9 kb sequence, while plasma-derived sequences are classified as intact or defective in the gag-3′ region (8.3 kb). Middle rings indicate whether a sequence is identical to another sequence only within the plasma or PBMC compartments. PBMC-derived sequences are classified as identical to another PBMC sequence if they are 100% identical in the gag-3′ region, while plasma-derived sequences are classified as identical to another plasma sequence if they are >99.98% identical to another sequence. Outer rings indicate whether a plasma sequence is 99.98% identical or 100% identical to a PBMC sequence. Branches with bootstrap values of ≥75 are indicated by an asterisk beside the node.
FIG 6
FIG 6
Phylogenetic trees of pre-ART plasma-derived sequences for participant P8. All pre-ART plasma-derived gag-3′ sequences were aligned, and phylogenetic trees were prepared for participant P8. Inner rings show whether a sequence is genetically-intact or defective for each type of defect shown. Outer rings show whether a sequence is >99.98% identical to another sequence on the tree. All sequences on the tree are plasma-derived, as indicated by the triangles. The genetic diversity of genetically-intact sequences within the most homogenous parts of the tree are shown between the dark gray lines. Branches with bootstrap values of ≥75 are indicated by an asterisk beside the node.
FIG 7
FIG 7
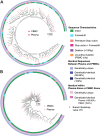
Genetic composition of plasma-derived gag-3′ PRLS sequences over 27 days of chronic untreated HIV-1 infection. For participant P7, plasma samples were available for time point 1 (TP1) and TP2, taken ∼27 days later. (A) The proportions of plasma-derived gag-3′ genomes that were genetically-intact or defective were compared between the two time points. n = number of gag-3′ genomes amplified. (B) A phylogenetic tree of all genetically-intact sequences amplified from P7 TP1 and TP2, with the outer ring and sequence symbols depicting the time point from which the sample came, and the inner ring showing which sequences were >99.98% identical to another sequence. All sequences on the tree are plasma-derived, as indicated by the triangles. Branches with bootstrap values of ≥75 are indicated by an asterisk beside the node.
FIG 8
FIG 8
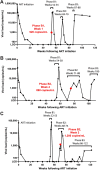
Viral load over the course of analytical treatment interruption study. Participants P3 (A), P4 (B), and P5 (C) initiated ART during acute HIV-1 infection, which they continued for 1 year. Each participant then interrupted ART for the first time (phase B1). After the indicated number of weeks, the participants reinitiated ART for 12 weeks and then interrupted ART a second time (phase B2). After the indicated number of weeks, the participants reinitiated ART and then interrupted ART for a third time (phase B3). Participants P3 and P5 reinitiated ART after the indicated number of weeks. The ATI plasma sample used for the PRLS assay int-3′ amplification is indicated by a red dot and text, with the viral load at this time noted. The limit of detection (LOD) is <50 copies/mL.
FIG 9
FIG 9
Properties of plasma-derived sequences from pre-ART and ATI plasma samples are similar. Plasma-derived sequences from pre-ART and ATI plasma samples for participants P3, P4, and P5 were trimmed to the ∼4.7-kb region spanning int-3′. (A and B) The proportions of sequences that were 100% (A) or >99.97% (B) identical to another sequence in the same sample were compared between the pre-ART and ATI plasma samples. A statistical comparison was performed using a Wilcoxon test and a paired t test, respectively. (C) The proportions of trimmed int-3′ plasma-derived sequences that are genetically-intact within the trimmed int-3′ region were compared between the pre-ART and ATI plasma samples. A statistical comparison was performed using a paired t test. ns, P > 0.05.
FIG 10
FIG 10
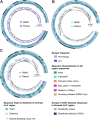
Phylogenetic trees of genomes from pre-ART plasma and PBMC samples and ATI plasma samples. Plasma-derived sequences from pre-ART and ATI plasma samples for participants P3, P4, and P5 were trimmed to the ∼4.7-kb region spanning int-3′ and aligned with trimmed proviral sequences from pre-ART PBMC samples, with sequences hypermutated or deleted in the trimmed int-3′ region excluded. Phylogenetic trees were then prepared for participants P3 (A), P4 (B), and P5 (C). PBMC-derived sequences are represented by circles, while plasma-derived sequences are represented by triangles. Inner rings show whether the sequence is from a pre-ART sample or an ATI sample. The second rings show whether a sequence is genetically-intact, or defective for each type of defect shown, within the full region sequenced for that sample (i.e., 8.3 kb gag-3′ for pre-ART plasma and 9.2 kb FLIPS for pre-ART PBMC). The third rings show whether a sequence is genetically-intact or defective within the trimmed int-3′ region. The outer rings show whether a sequence is 100% identical to another sequence in the tree in the trimmed int-3′ region. Branches with bootstrap values of ≥75 are indicated by an asterisk beside the node.

Similar articles

Cited by

References

    1. Finzi D, Hermankova M, Pierson T, Carruth LM, Buck C, Chaisson RE, Quinn TC, Chadwick K, Margolick J, Brookmeyer R, Gallant J, Markowitz M, Ho DD, Richman DD, Siliciano RF. 1997. Identification of a reservoir for HIV-1 in patients on highly active antiretroviral therapy. Science 278:1295–1300. 10.1126/science.278.5341.1295. - DOI - PubMed
    1. Siliciano JD, Kajdas J, Finzi D, Quinn TC, Chadwick K, Margolick JB, Kovacs C, Gange SJ, Siliciano RF. 2003. Long-term follow-up studies confirm the stability of the latent reservoir for HIV-1 in resting CD4+ T cells. Nat Med 9:727–728. 10.1038/nm880. - DOI - PubMed
    1. Chun T-W, Stuyver L, Mizell SB, Ehler LA, Mican JAM, Baseler M, Lloyd AL, Nowak MA, Fauci AS. 1997. Presence of an inducible HIV-1 latent reservoir during highly active antiretroviral therapy. Proc Natl Acad Sci U S A 94:13193–13197. 10.1073/pnas.94.24.13193. - DOI - PMC - PubMed
    1. Chun TW, Justement JS, Murray D, Hallahan CW, Maenza J, Collier AC, Sheth PM, Kaul R, Ostrowski M, Moir S, Kovacs C, Fauci AS. 2010. Rebound of plasma viremia following cessation of antiretroviral therapy despite profoundly low levels of HIV reservoir: implications for eradication. AIDS 24:2803–2808. 10.1097/QAD.0b013e328340a239. - DOI - PMC - PubMed
    1. Davey RT, Bhat N, Yoder C, Chun T-W, Metcalf JA, Dewar R, Natarajan V, Lempicki RA, Adelsberger JW, Miller KD, Kovacs JA, Polis MA, Walker RE, Falloon J, Masur H, Gee D, Baseler M, Dimitrov DS, Fauci AS, Lane HC. 1999. HIV-1 and T cell dynamics after interruption of highly active antiretroviral therapy (HAART) in patients with a history of sustained viral suppression. Proc Natl Acad Sci U S A 96:15109–15114. 10.1073/pnas.96.26.15109. - DOI - PMC - PubMed

Publication types

LinkOut - more resources