

The Negative Effect of Preexisting Immunity on Influenza Vaccine Responses Transcends the Impact of Vaccine Formulation Type and Vaccination History
- PMID: 35199825
- PMCID: PMC9891420
- DOI: 10.1093/infdis/jiac068
The Negative Effect of Preexisting Immunity on Influenza Vaccine Responses Transcends the Impact of Vaccine Formulation Type and Vaccination History
Abstract
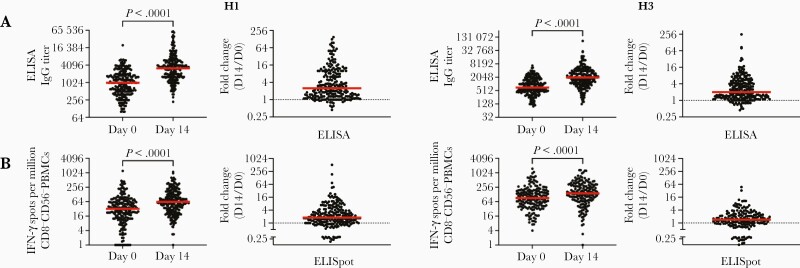
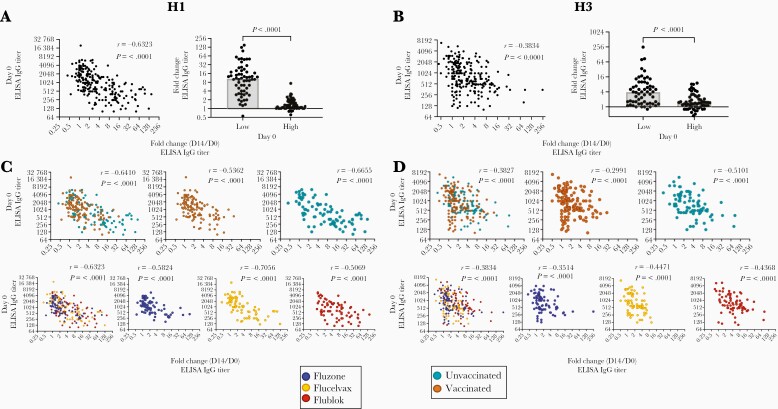
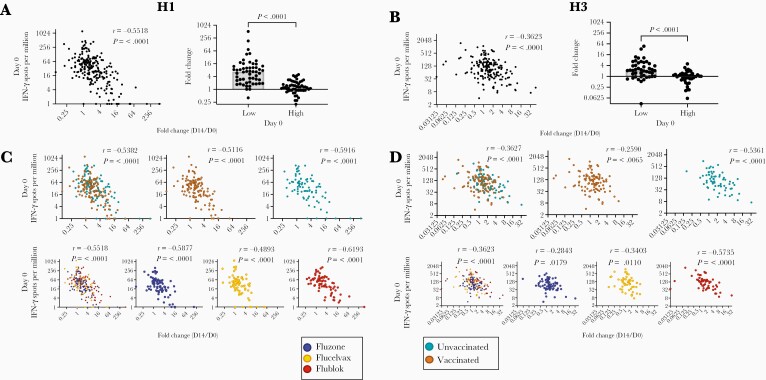
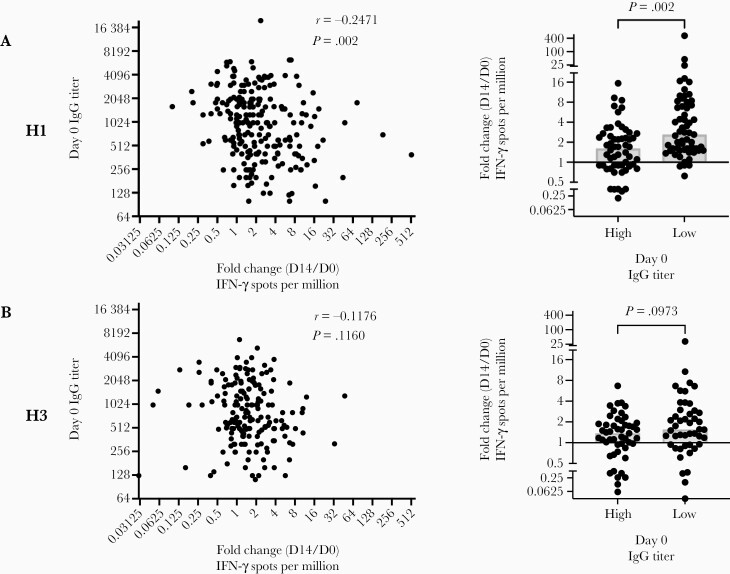
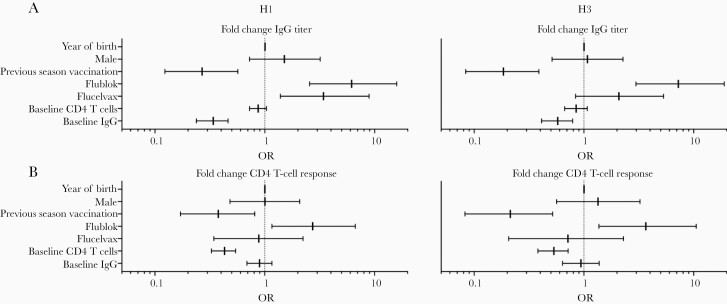
The most effective measure to induce protection from influenza is vaccination. Thus, yearly vaccination is recommended, which, together with infections, establishes diverse repertoires of B cells, antibodies, and T cells. We examined the impact of this accumulated immunity on human responses in adults to split, subunit, and recombinant protein-based influenza vaccines. Enzyme-linked immunosorbent assay (ELISA) assays, to quantify serum antibodies, and peptide-stimulated CD4 T-cell cytokine ELISpots revealed that preexisting levels of hemagglutinin (HA)-specific antibodies were negatively associated with gains in antibody postvaccination, while preexisting levels of CD4 T cells were negatively correlated with vaccine-induced expansion of CD4 T cells. These patterns were seen independently of the vaccine formulation administered and the subjects' influenza vaccine history. Thus, although memory CD4 T cells and serum antibodies consist of components that can enhance vaccine responses, on balance, the accumulated immunity specific for influenza A H1 and H3 proteins is associated with diminished future responses.
Keywords: CD4 T cells; human immunity; immune memory; influenza; vaccines.
© The Author(s) 2022. Published by Oxford University Press for the Infectious Diseases Society of America. All rights reserved. For permissions, e-mail: journals.permissions@oup.com.
Figures
Similar articles
-
Modified vaccinia virus Ankara encoding influenza virus hemagglutinin induces heterosubtypic immunity in macaques.J Virol. 2014 Nov;88(22):13418-28. doi: 10.1128/JVI.01219-14. Epub 2014 Sep 10. J Virol. 2014. PMID: 25210172 Free PMC article.
-
Complement C3 Plays a Key Role in Inducing Humoral and Cellular Immune Responses to Influenza Virus Strain-Specific Hemagglutinin-Based or Cross-Protective M2 Extracellular Domain-Based Vaccination.J Virol. 2018 Sep 26;92(20):e00969-18. doi: 10.1128/JVI.00969-18. Print 2018 Oct 15. J Virol. 2018. PMID: 30068650 Free PMC article.
-
Chimeric hemagglutinin vaccine elicits broadly protective CD4 and CD8 T cell responses against multiple influenza strains and subtypes.Proc Natl Acad Sci U S A. 2020 Jul 28;117(30):17757-17763. doi: 10.1073/pnas.2004783117. Epub 2020 Jul 15. Proc Natl Acad Sci U S A. 2020. PMID: 32669430 Free PMC article.
-
The Quest for a Truly Universal Influenza Vaccine.Front Cell Infect Microbiol. 2019 Oct 10;9:344. doi: 10.3389/fcimb.2019.00344. eCollection 2019. Front Cell Infect Microbiol. 2019. PMID: 31649895 Free PMC article. Review.
-
Heads, stalks and everything else: how can antibodies eradicate influenza as a human disease?Curr Opin Immunol. 2016 Oct;42:48-55. doi: 10.1016/j.coi.2016.05.012. Epub 2016 Jun 3. Curr Opin Immunol. 2016. PMID: 27268395 Free PMC article. Review.
Cited by
-
Seasonal influenza vaccines: Variability of immune responses to B lineage viruses.Hum Vaccin Immunother. 2024 Dec 31;20(1):2421096. doi: 10.1080/21645515.2024.2421096. Epub 2024 Nov 17. Hum Vaccin Immunother. 2024. PMID: 39552079 Free PMC article. Review.
-
The impact of pre-existing influenza antibodies and inflammatory status on the influenza vaccine responses in older adults.Influenza Other Respir Viruses. 2023 Jul 12;17(7):e13172. doi: 10.1111/irv.13172. eCollection 2023 Jul. Influenza Other Respir Viruses. 2023. PMID: 37457646 Free PMC article.
-
Restoring Trust: The Need for Precision Medicine in Infectious Diseases, Public Health and Vaccines.Hum Vaccin Immunother. 2023 Aug 1;19(2):2234787. doi: 10.1080/21645515.2023.2234787. Epub 2023 Jul 19. Hum Vaccin Immunother. 2023. PMID: 37465958 Free PMC article. Review.
-
Harmonization and qualification of an IFN-γ Enzyme-Linked ImmunoSpot assay (ELISPOT) to measure influenza-specific cell-mediated immunity within the FLUCOP consortium.Front Immunol. 2022 Sep 8;13:984642. doi: 10.3389/fimmu.2022.984642. eCollection 2022. Front Immunol. 2022. PMID: 36159843 Free PMC article.
-
Lack of memory recall in human CD4 T cells elicited by the first encounter with SARS-CoV-2.iScience. 2024 May 17;27(6):109992. doi: 10.1016/j.isci.2024.109992. eCollection 2024 Jun 21. iScience. 2024. PMID: 38868209 Free PMC article.
References
-
- Krammer F. The human antibody response to influenza A virus infection and vaccination. Nat Rev Immunol 2019; 19:383–97. - PubMed
-
- Belongia EA, Skowronski DM, McLean HQ, Chambers C, Sundaram ME, Serres GD.. Repeated annual influenza vaccination and vaccine effectiveness: review of evidence. Expert Rev Vaccines 2017; 16:1–14. - PubMed
Publication types
MeSH terms
Substances
Grants and funding
LinkOut - more resources
Full Text Sources
Medical
Research Materials
