Monitoring Pre- and Post-Operative Immune Alterations in Patients With Locoregional Colorectal Cancer Who Underwent Laparoscopy by Single-Cell Mass Cytometry
- PMID: 35185893
- PMCID: PMC8850468
- DOI: 10.3389/fimmu.2022.807539
Monitoring Pre- and Post-Operative Immune Alterations in Patients With Locoregional Colorectal Cancer Who Underwent Laparoscopy by Single-Cell Mass Cytometry
Abstract
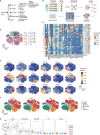
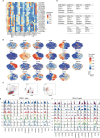
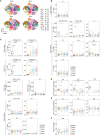
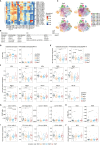
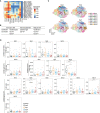
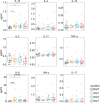
Surgical excision is currently the principal therapy for locoregional colorectal cancer (CRC). However, surgical trauma leads to controlled tissue damage, causing profound alterations in host immunity and, in turn, affecting post-operative outcomes. Surgery-induced immune alterations in CRC remain poorly defined. Here, single-cell mass cytometry was applied to serial blood samples collected pre-operatively, and on days 1, 3, and 7 post-operatively from 24 patients who underwent laparoscopic surgical resection of CRC to comprehensively monitor the perioperative phenotypic alterations in immune cells and dynamics of immune response. Characterization of immune cell subsets revealed that the post-operative immune response is broad but predominantly suppressive, supported by the decreases in total frequencies of circulating T cells and natural killer (NK) cells, as well as decreased HLA-DR expression on circulating monocytes. The proportion of T cells significantly decreased on day 1 and recovered to the pre-surgical level on day 3 after surgery. The frequency of monocytes was significantly elevated on day 1 after surgery and declined to baseline level on day 3. NK cells temporarily contracted on post-operative day 3. T cells, monocytes, DCs, NK cells, and B cells were partitioned into phenotypically different single-cell clusters. The dynamics of single-cell clusters were different from those of the bulk lineages. T cell clusters in the same response phase fluctuate inconsistently during the perioperative period. Comparing to the baseline levels, the frequencies of CD11b(+)CD33(+)CD14(+)CD16(-) classical monocytes expanded followed by contraction, whereas CD11b(+)CD33(+)CD14(high)CD16(low) intermediate monocytes remained unchanged; HLA-DR expression in monocytes were significantly reduced; the frequencies of intermediate CD56(bright)CD16(+) NK cell subsets increased; and the percentage of memory B lymphocytes were elevated after surgery. Post-operative pro- and anti-inflammatory cytokines were both altered. Furthermore, perioperative immune perturbations in some of the cell subsets were unrecovered within seven days after surgery. Chronological monitoring major immune lineages provided an overview of surgery-caused alterations, including cell augments and contractions and precisely timed changes in immune cell distribution in both innate and adaptive compartments, providing evidence for the interaction between tumor resection and immune modulation.
Keywords: immunosuppression; laparoscopy; locoregional colorectal cancer; perioperative immune alterations; single-cell mass cytometry.
Copyright © 2022 Zhou, Wang, Jiang, Di and Su.
Conflict of interest statement
The authors declare that the research was conducted in the absence of any commercial or financial relationships that could be construed as a potential conflict of interest.
Figures
Similar articles
-
Characterization of circulating T-, NK-, and NKT cell subsets in patients with colorectal cancer: the peripheral blood immune cell profile.Cancer Immunol Immunother. 2019 Jun;68(6):1011-1024. doi: 10.1007/s00262-019-02343-7. Epub 2019 May 3. Cancer Immunol Immunother. 2019. PMID: 31053876 Free PMC article.
-
Mass Cytometry Reveals a Sustained Reduction in CD16+ Natural Killer Cells Following Chemotherapy in Colorectal Cancer Patients.Front Immunol. 2019 Nov 5;10:2584. doi: 10.3389/fimmu.2019.02584. eCollection 2019. Front Immunol. 2019. PMID: 31749810 Free PMC article.
-
Systemic Immunological changes in patients with distinct clinical outcomes during Mycobacterium tuberculosis infection.Immunobiology. 2017 Nov;222(11):1014-1024. doi: 10.1016/j.imbio.2017.05.016. Epub 2017 May 26. Immunobiology. 2017. PMID: 28619539
-
T and NK Cell Phenotypic Abnormalities in Systemic Sclerosis: a Cohort Study and a Comprehensive Literature Review.Clin Rev Allergy Immunol. 2015 Dec;49(3):347-69. doi: 10.1007/s12016-015-8505-8. Clin Rev Allergy Immunol. 2015. PMID: 26445774 Review.
-
The biology of human natural killer-cell subsets.Trends Immunol. 2001 Nov;22(11):633-40. doi: 10.1016/s1471-4906(01)02060-9. Trends Immunol. 2001. PMID: 11698225 Review.
Cited by
-
Synbiotics and Surgery: Can Prebiotics and Probiotics Affect Inflammatory Surgical Outcomes?Curr Nutr Rep. 2023 Jun;12(2):238-246. doi: 10.1007/s13668-023-00464-1. Epub 2023 Mar 30. Curr Nutr Rep. 2023. PMID: 36991238 Free PMC article. Review.
-
Immunological Insights into Opioid-Free Anaesthesia in Oncological Surgery: A Scoping Review.Curr Oncol Rep. 2022 Oct;24(10):1327-1336. doi: 10.1007/s11912-022-01300-5. Epub 2022 May 28. Curr Oncol Rep. 2022. PMID: 35633449 Free PMC article. Review.
-
The role of surgical tissue injury and intraoperative sympathetic activation in postoperative immunosuppression after breast-conserving surgery versus mastectomy: a prospective observational study.Breast Cancer Res. 2024 Mar 11;26(1):42. doi: 10.1186/s13058-024-01801-0. Breast Cancer Res. 2024. PMID: 38468349 Free PMC article.
-
Association of circulating gene expression signatures with stiffness following total knee arthroplasty for osteoarthritis: a pilot study.Sci Rep. 2022 Jul 25;12(1):12651. doi: 10.1038/s41598-022-16868-y. Sci Rep. 2022. PMID: 35879399 Free PMC article.
-
Early dynamic changes to monocytes following major surgery are associated with subsequent infections.Front Immunol. 2024 Apr 9;15:1352556. doi: 10.3389/fimmu.2024.1352556. eCollection 2024. Front Immunol. 2024. PMID: 38655251 Free PMC article.
References
Publication types
MeSH terms
Substances
LinkOut - more resources
Full Text Sources
Medical
Research Materials

