

doi: 10.1002/ctm2.715.
Hyperactivation of platelet-derived growth factor signalling contributes to arrhythmogenesis in Brugada syndrome
Affiliations
- PMID: 35184407
- PMCID: PMC8858633
- DOI: 10.1002/ctm2.715
Item in Clipboard
Hyperactivation of platelet-derived growth factor signalling contributes to arrhythmogenesis in Brugada syndrome
Clin Transl Med.
2022 Feb.
No abstract available
Figures
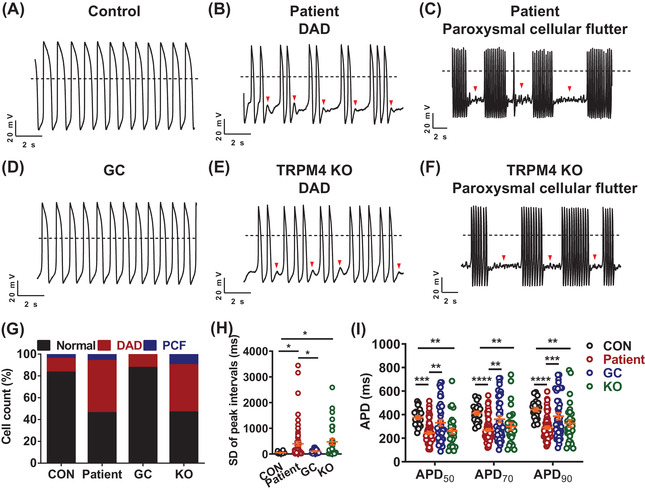
TRPM4 T262M leads to cardiac arrhythmias in iPSC‐CMs. (A–F) Representative action potential tracings recorded by single‐cell patch clamp from control, patient, gene‐corrected (GC) and TRPM4 knockout (KO) ventricular‐like myocytes. Dashed lines indicate 0 mV. (G) Bar graph to compare the percentage of cells with arrhythmias between control (CON), patient, GC and KO iPSC‐CMs. Control: 16.7%; Patient: 53.8%; GC: 12.5%; KO: 53.3%. n = 24–65 in two lines. (H) Scatter dot plot to compare SD of peak intervals between control, patient, GC and KO iPSC‐CMs by one‐way analysis of variance (ANOVA) (Tukey method). n = 24–65 in two lines. *
p < .05. (I) Scatter dot plot to compare action potential durations (APDs) between control, patient, GC and KO iPSC‐CMs by two‐way ANOVA (Tukey method). n = 24–65 in two lines. **
p < .01, ***
p < .001 and ****
p < .0001
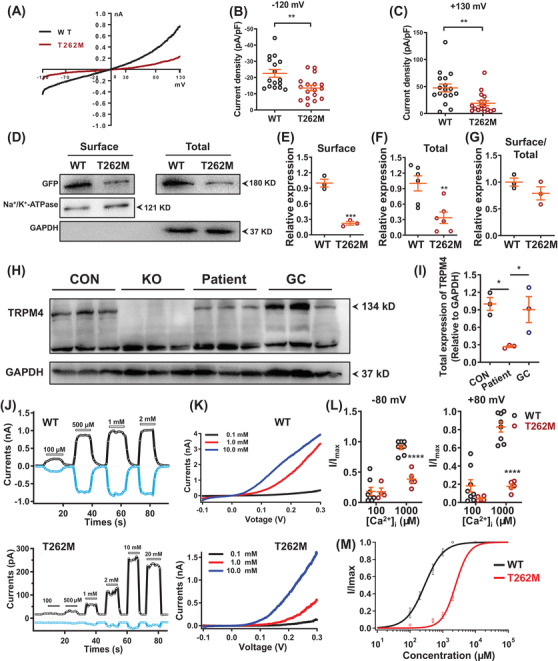
T262M confers impaired TRPM4 channel function. (A) Current‐voltage curves (IV curves) of whole‐cell TRPM4 currents recorded from human embryonic kidney 293T cells (HEK293T cells) overexpressing WT and T262M channels labelled with green fluorescent protein (GFP) at C terminus. Successfully transfected cells, indicated by green fluorescence, were patch‐clamp recorded for macroscopic currents using a voltage ramp protocol for 250 ms from –120 mV to +130 mV. (B, C) Scatter dot plots to compare the peak TRPM4 current density at ‐120 mV and +130 mV between WT and T262M by unpaired two‐tailed Student's t‐test (at –120 mV: WT = 22.6 ± 2.4 pA/pF, T262M = 13.5 ± 1.7 pA/pF; at +130 mV: WT = 47.4 ± 7.3 pA/pF, T262M = 19.1 ± 4.5 pA/pF). n = 16–17 patches. **
p < .01. (D) Western blot analysis of surface and total protein expression of TRPM4 in HEK293T cells overexpressing WT and T262M. (E–G) Scatter dot plots to compare the surface expression of TRPM4, total expression of TRPM4, and TRPM4 surface expression/TRPM4 total expression (surface/total) between WT and T262M by unpaired two‐tailed Student's t‐test, respectively. n = 3–6 independent experiments. **
p < .01 and ***
p < .001. (H) Western blot analysis of total protein expression of TRPM4 in control, KO, patient and GC iPSC‐CMs. (I) Scatter dot plot to compare total protein expression of TRPM4 in control, patient and GC iPSC‐CMs by one‐way analysis of variance (ANOVA) (Tukey method). n = 3 independent experiments. *
p < .05. (J) Representative TRPM4 current tracings of WT and T262M by inside‐out patch‐clamp recordings at +80 mV (black) and –80 mV (blue). (K) Representative IV curves of TRPM4 currents in WT and T262M by inside‐out patch clamp recordings. Three different Ca2+ concentrations were used including 0.1, 1.0 and 10.0 mM. In WT channels, currents were robustly obtained at 100 μM [Ca2+]i and the [Ca2+]i‐activated currents saturated when the [Ca2+]i concentration reached 500 μM. In contrast, T262M channels gave rise to detectable currents upon perfusion of 500 μM [Ca2+]i, which appeared significantly larger at 1000 μM [Ca2+]i and saturated at 10000 μM [Ca2+]i. (L) Currents normalized to the response to 100 and 1000 μM Ca2+ at –80 mV or +80 mV as in the experiments in Figure 2J by two‐way ANOVA (Tukey method). n = 4–8 patches. ****
p < .0001. (M) The concentration‐response curves of WT and mutant T262M with Ca2+ concentrations were measured with inside‐out patch‐clamp recordings. n = 3–5 patches
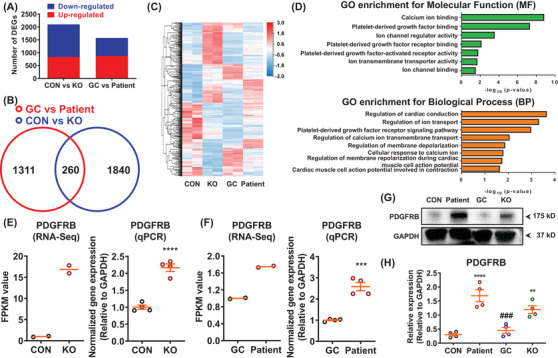
RNA sequencing analysis reveals abnormal activation of platelet‐derived growth factor signalling in patient iPSC‐CMs. (A) Bar graph to compare the number of differentially expressed genes (DEGs) between control and KO, as well as GC and patient iPSC‐CMs. n = 2 independent samples. (B) Venn diagram to compare DEGs between control and KO, as well as GC and patient iPSC‐CMs. (C) Heatmap demonstrating the differential gene expression pattern between control and KO, as well as GC and patient iPSC‐CMs. By one set of RNA sequencing (RNA‐Seq) analysis using samples of GC and patient iPSC‐CMs (GC vs. patient), we observed that 1573 genes out of 18 805 total genes were differentially expressed in GC iPSC‐CMs (869 up‐regulated and 704 down‐regulated) as compared to patient iPSC‐CMs. By another set of RNA‐Seq analyses using samples of control and TRPM4 KO iPSC‐CMs (CON versus KO), 2100 DEGs were found in control iPSC‐CMs (834 up‐regulated and 1266 down‐regulated), when compared to KO iPSC‐CMs. A cross‐analysis of GC versus patient and CON versus KO identified 260 common DEGs, in which 95 genes were up‐regulated and 165 genes were down‐regulated, respectively. (D) Enriched gene ontology (GO) for molecular function (MF) and biological process (BP). DEGs were enriched in platelet‐derived growth factor (PDGF) signaling, including “PDGF binding”, “PDGF receptor binding”, “PDGF‐activated factor activity” and “PDGF receptor signaling pathway”. (E) Scatter dot plots to compare the mRNA expression of PDGFRB between control and KO iPSC‐CMs by RNA‐Seq (n = 2 independent samples) and qPCR (n = 4 independent experiments) by unpaired two‐tailed Student's t‐test. ****
p < .0001. (F) Scatter dot plots to compare the mRNA expression of PDGFRB between GC and patient iPSC‐CMs by RNA‐Seq (n = 2 independent samples) and qPCR (n = 4 independent experiments) by unpaired two‐tailed Student's t‐test. ***
p < .001. (G) Western blot analysis of total protein expression of PDGFRB in control, patient, GC and KO iPSC‐CMs. (H) Scatter dot plot to compare total protein expression of PDGFRB in different groups by one‐way analysis of variance (ANOVA) (Tukey method). n = 4 independent experiments. **
p < .01 and ****
p < .0001, when compared to control iPSC‐CMs; ###
p < .001 when compared to patient iPSC‐CMs
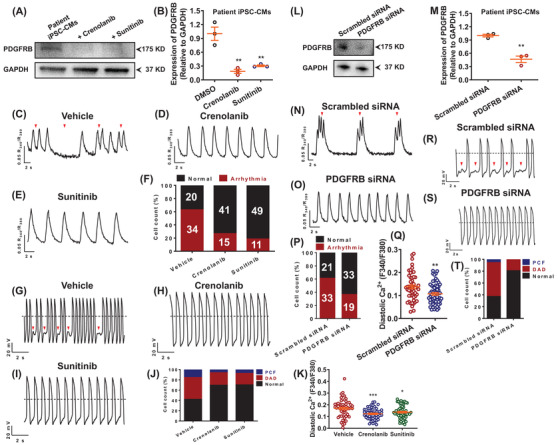
Restoration of diastolic [Ca2+]i and rescue of arrhythmic phenotypes by inhibition of PDGFRB signalling. (A) Western blot analysis of total protein expression of PDGFRB in patient iPSC‐CMs treated with dimethyl sulfoxide (DMSO) and two PDGFRB inhibitors (crenolanib and sunitinib). (B) Scatter dot plot to compare total protein expression of PDGFRB in different groups by unpaired two‐tailed Student's t‐test. n = 3 independent experiments. **
p < .01. (C–E) Representative Ca2+ transient tracings from patient iPSC‐CMs treated with DMSO, crenolanib or sunitinib. (F) Bar graph to compare the percentage of cells exhibiting regular and irregular Ca2+ transient pattern between different groups. n = 54–60 in two lines. The proarrhythmic activities were greatly attenuated when treated with crenolanib or sunitinib as evidenced by Ca2+ imaging. (G–I) Representative action potential tracings from patient iPSC‐CMs treated with DMSO, crenolanib or sunitinib. (J) Bar graph to compare the percentage of cells with arrhythmias between patient iPSC‐CMs treated with DMSO, crenolanib and sunitinib. n = 26–33 in two lines. The proarrhythmic activities were greatly attenuated when treated with crenolanib or sunitinib as evidenced by patch clamp recordings. (K) Scatter dot plot to compare diastolic [Ca2+]i between different groups by unpaired two‐tailed Student's t‐test. The elevation of diastolic [Ca2+]i in myocytes carrying TRPM4 T262M was restored by crenolanib or sunitinib treatment. n = 54 in two lines. *
p < .05 and ***
p < .001. (L) Western blot analysis of total protein expression of PDGFRB in patient iPSC‐CMs treated with scrambled or PDGFRB siRNA. (M) Scatter dot plot to compare total protein expression of PDGFRB between the two groups by unpaired two‐tailed Student's t‐test. n = 3 independent experiments. **
p < .01. (N, O) Representative Ca2+ transient tracings from patient iPSC‐CMs treated with scrambled or PDGFRB siRNA. (P) Bar graph to compare the percentage of cells exhibiting regular and irregular Ca2+ transient patterns between the two groups. n = 52–54 in two lines. (Q) Scatter dot plot to compare diastolic [Ca2+]i between the two groups by unpaired two‐tailed Student's t‐test. n = 52–59 in two lines. **
p < .01. (R, S) Representative action potential tracings from patient iPSC‐CMs treated with scrambled or PDGFRB siRNA. (T) Bar graph to compare the percentage of cells with arrhythmias between patient iPSC‐CMs treated with scrambled and PDGFRB siRNA. n = 36 in two lines
Similar articles
-
Inherited Cardiac Arrhythmia Syndromes: Focus on Molecular Mechanisms Underlying TRPM4 Channelopathies.Cardiovasc Ther. 2020 Dec 16;2020:6615038. doi: 10.1155/2020/6615038. eCollection 2020. Cardiovasc Ther. 2020. PMID: 33381229 Free PMC article. Review.
-
Mutation Load of Multiple Ion Channel Gene Mutations in Brugada Syndrome.Cardiology. 2017;137(4):256-260. doi: 10.1159/000471792. Epub 2017 May 12. Cardiology. 2017. PMID: 28494446
-
TRPM4 mutations to cause autosomal recessive and not autosomal dominant Brugada type 1 syndrome.Eur J Med Genet. 2019 Jun;62(6):103527. doi: 10.1016/j.ejmg.2018.08.008. Epub 2018 Aug 22. Eur J Med Genet. 2019. PMID: 30142439
-
Induced Brugada syndrome: Possible sources of arrhythmogenesis.Rev Port Cardiol. 2017 Dec;36(12):945-956. doi: 10.1016/j.repc.2017.06.015. Epub 2017 Dec 10. Rev Port Cardiol. 2017. PMID: 29233646 Review. English, Portuguese.
-
Effects of mutations and genetic overlap in inherited long-QT and Brugada arrhythmia syndromes.Hellenic J Cardiol. 2012 Nov-Dec;53(6):439-46. Hellenic J Cardiol. 2012. PMID: 23178427 Review. No abstract available.
Cited by
-
Colchicine attenuates the electrical remodeling of post-operative atrial fibrillation through inhibited expression of immune-related hub genes and stabilization of microtubules.Int J Biol Sci. 2023 Jun 4;19(9):2934-2956. doi: 10.7150/ijbs.81961. eCollection 2023. Int J Biol Sci. 2023. PMID: 37324937 Free PMC article.
References
-
- Brugada P, Brugada J. Right bundle branch block, persistent ST segment elevation and sudden cardiac death: a distinct clinical and electrocardiographic syndrome. A multicenter report. J Am Coll Cardiol. 1992;20:1391‐1396. - PubMed
-
- Gualandi F, Zaraket F, Malagu M, et al. Mutation load of multiple ion channel gene mutations in brugada syndrome. Cardiology. 2017;137:256‐260. - PubMed
-
- Janin A, Bessiere F, Georgescu T, Chanavat V, Chevalier P, Millat G. TRPM4 mutations to cause autosomal recessive and not autosomal dominant Brugada type 1 syndrome. Eur J Med Genet. 2019;62:103527. - PubMed
Publication types
MeSH terms
Substances
Grants and funding
LinkOut - more resources
Full Text Sources