

Site-specific mitochondrial dysfunction in neurodegeneration
- PMID: 35182728
- PMCID: PMC9035127
- DOI: 10.1016/j.mito.2022.02.004
Site-specific mitochondrial dysfunction in neurodegeneration
Abstract
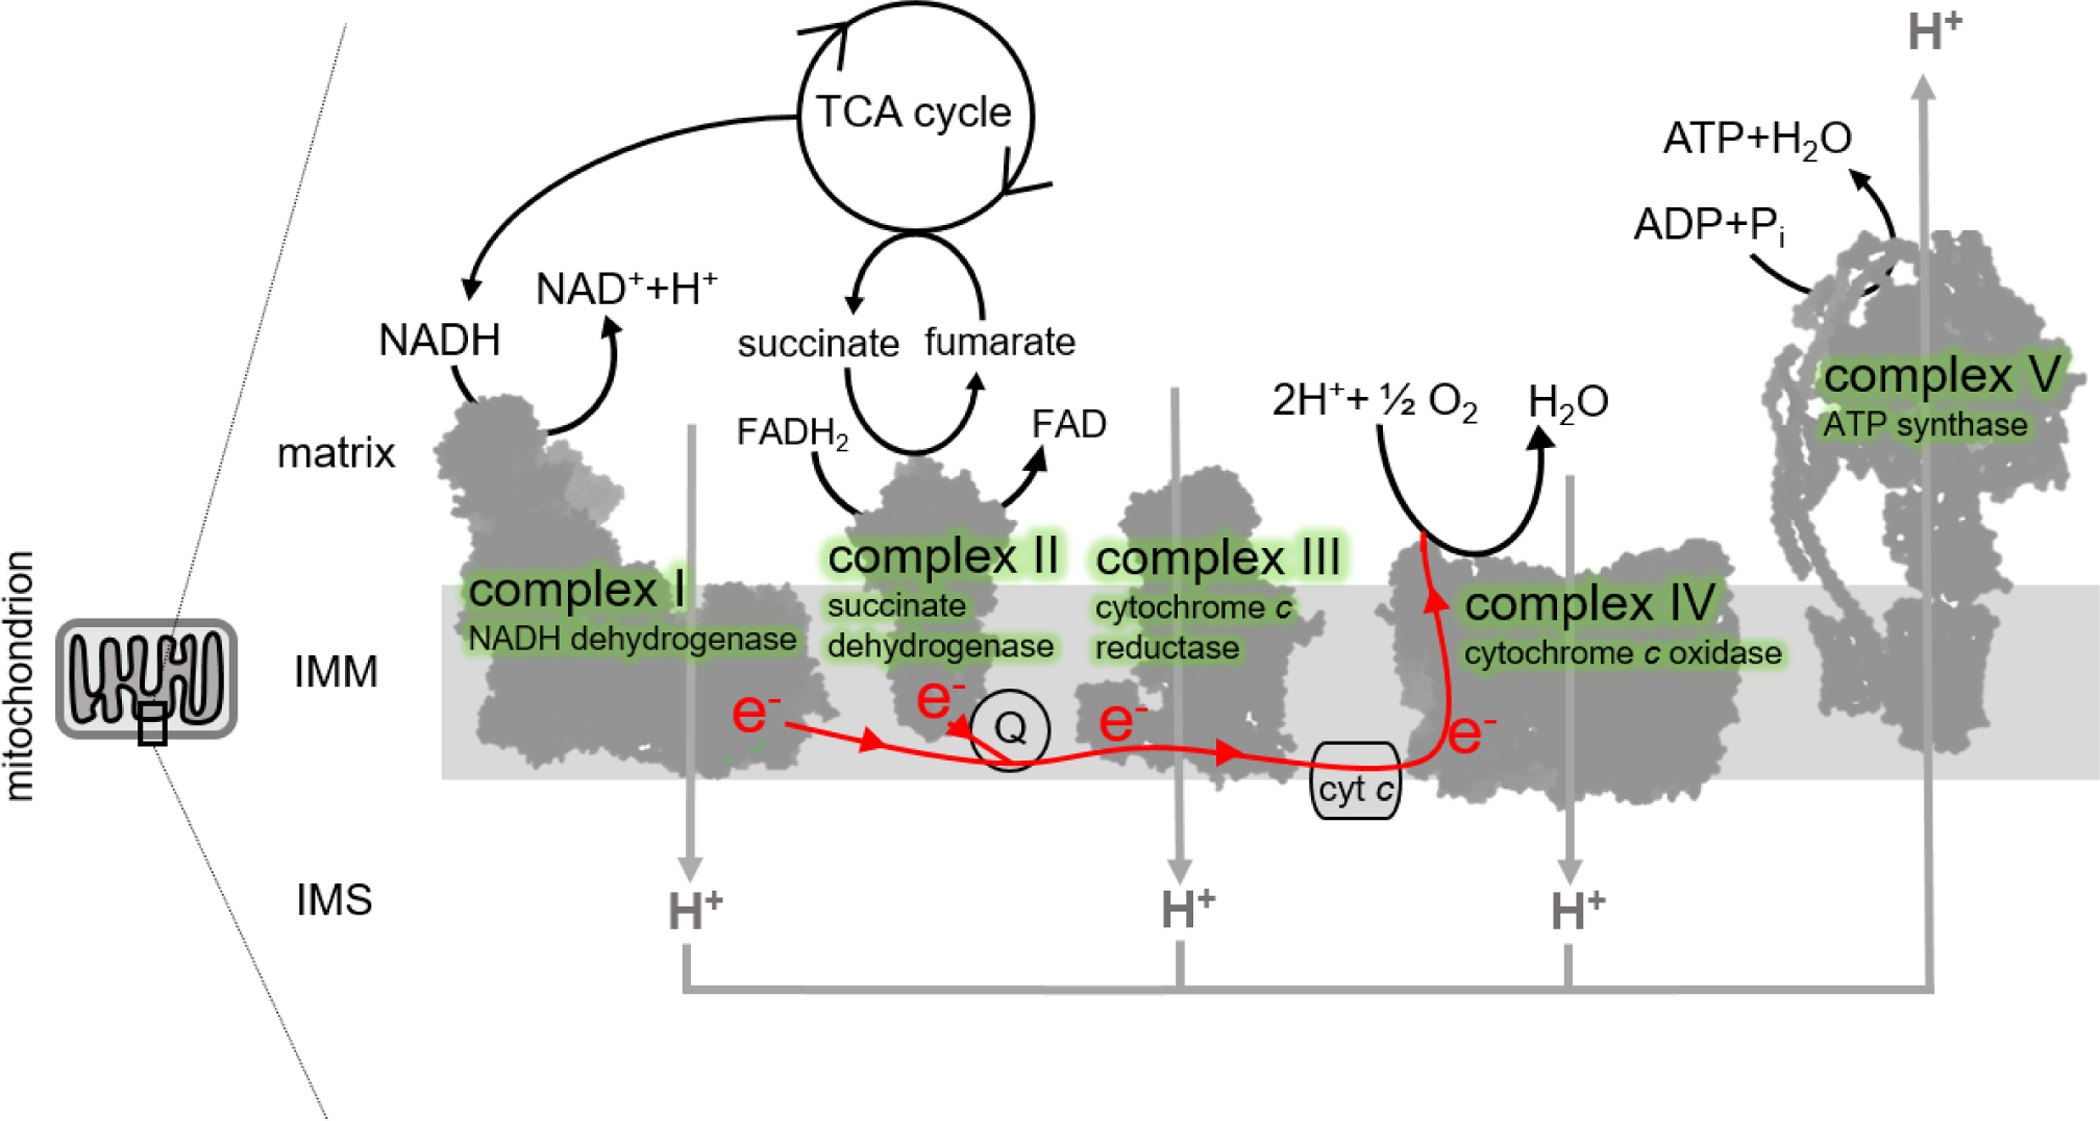
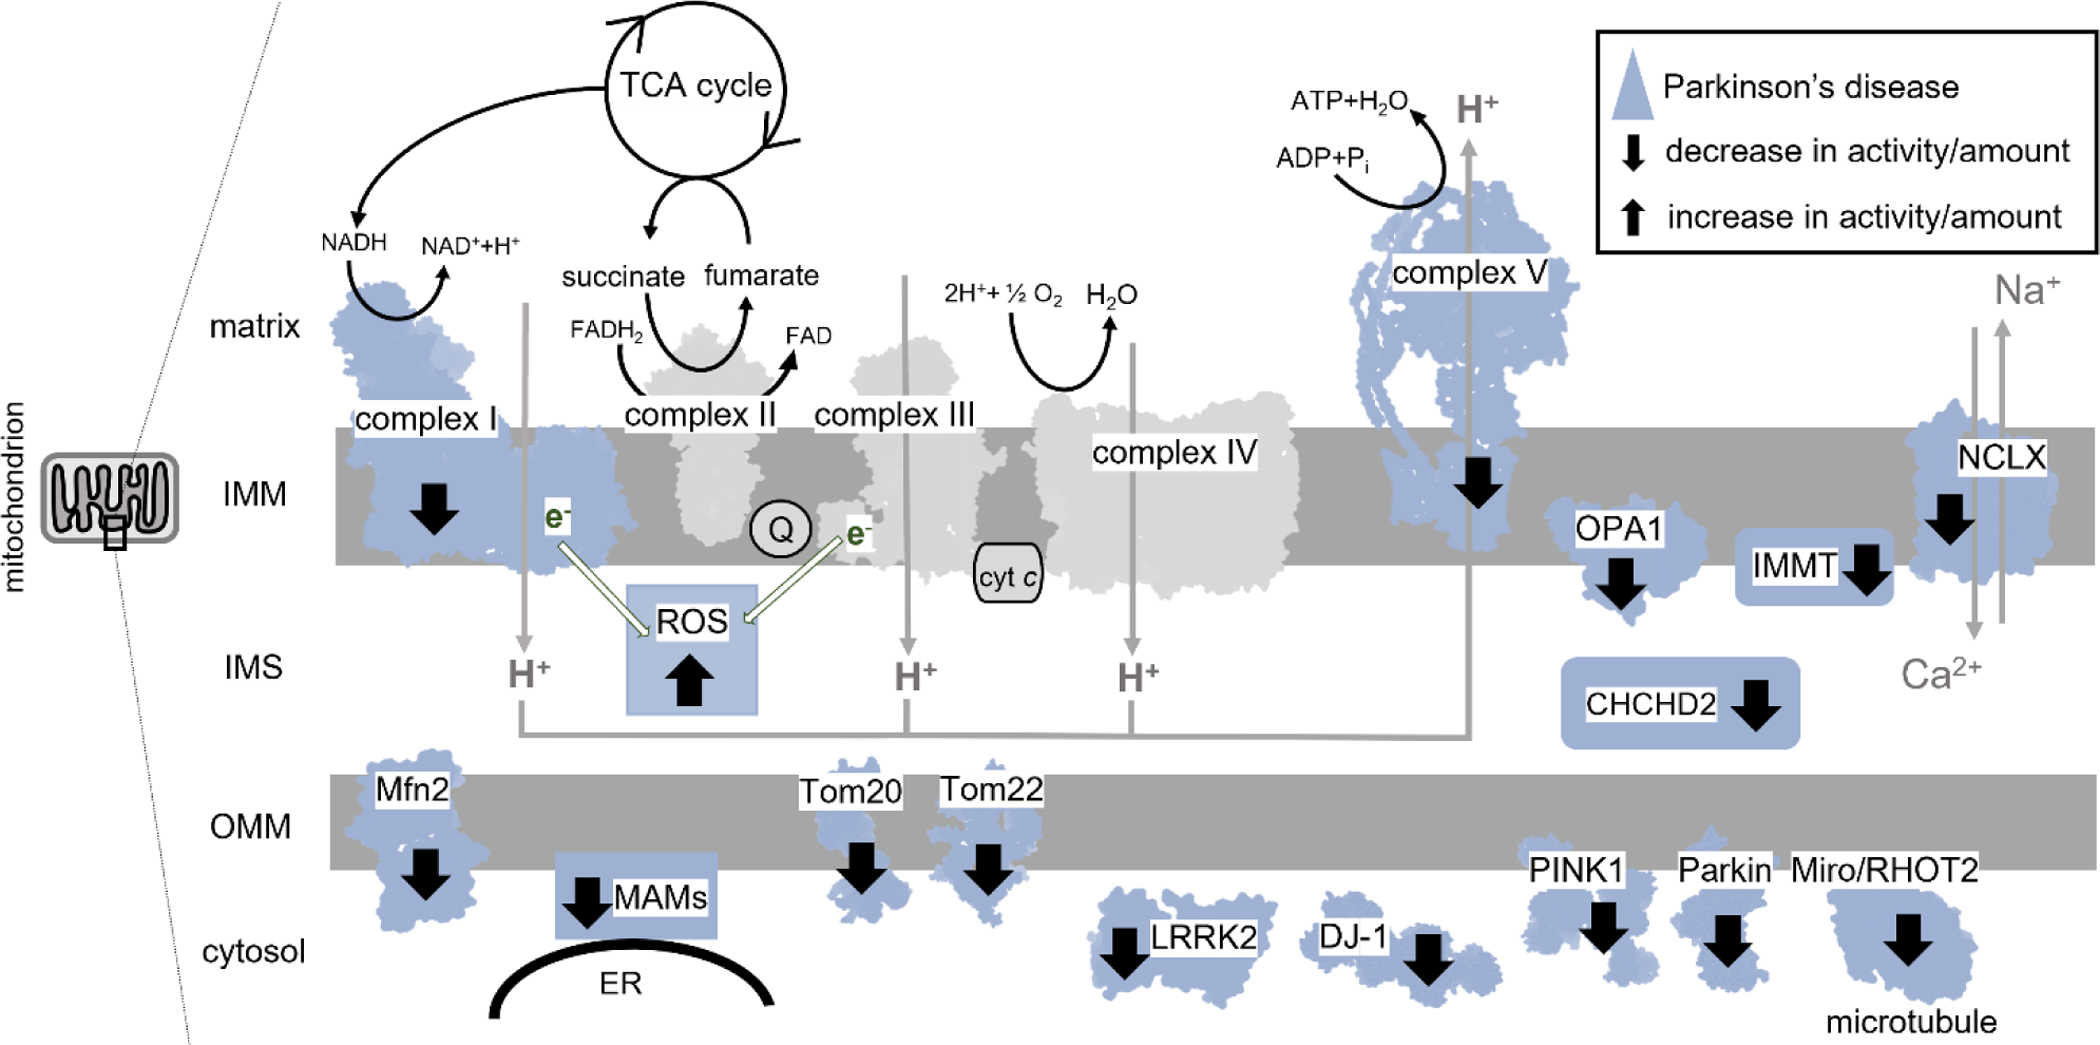
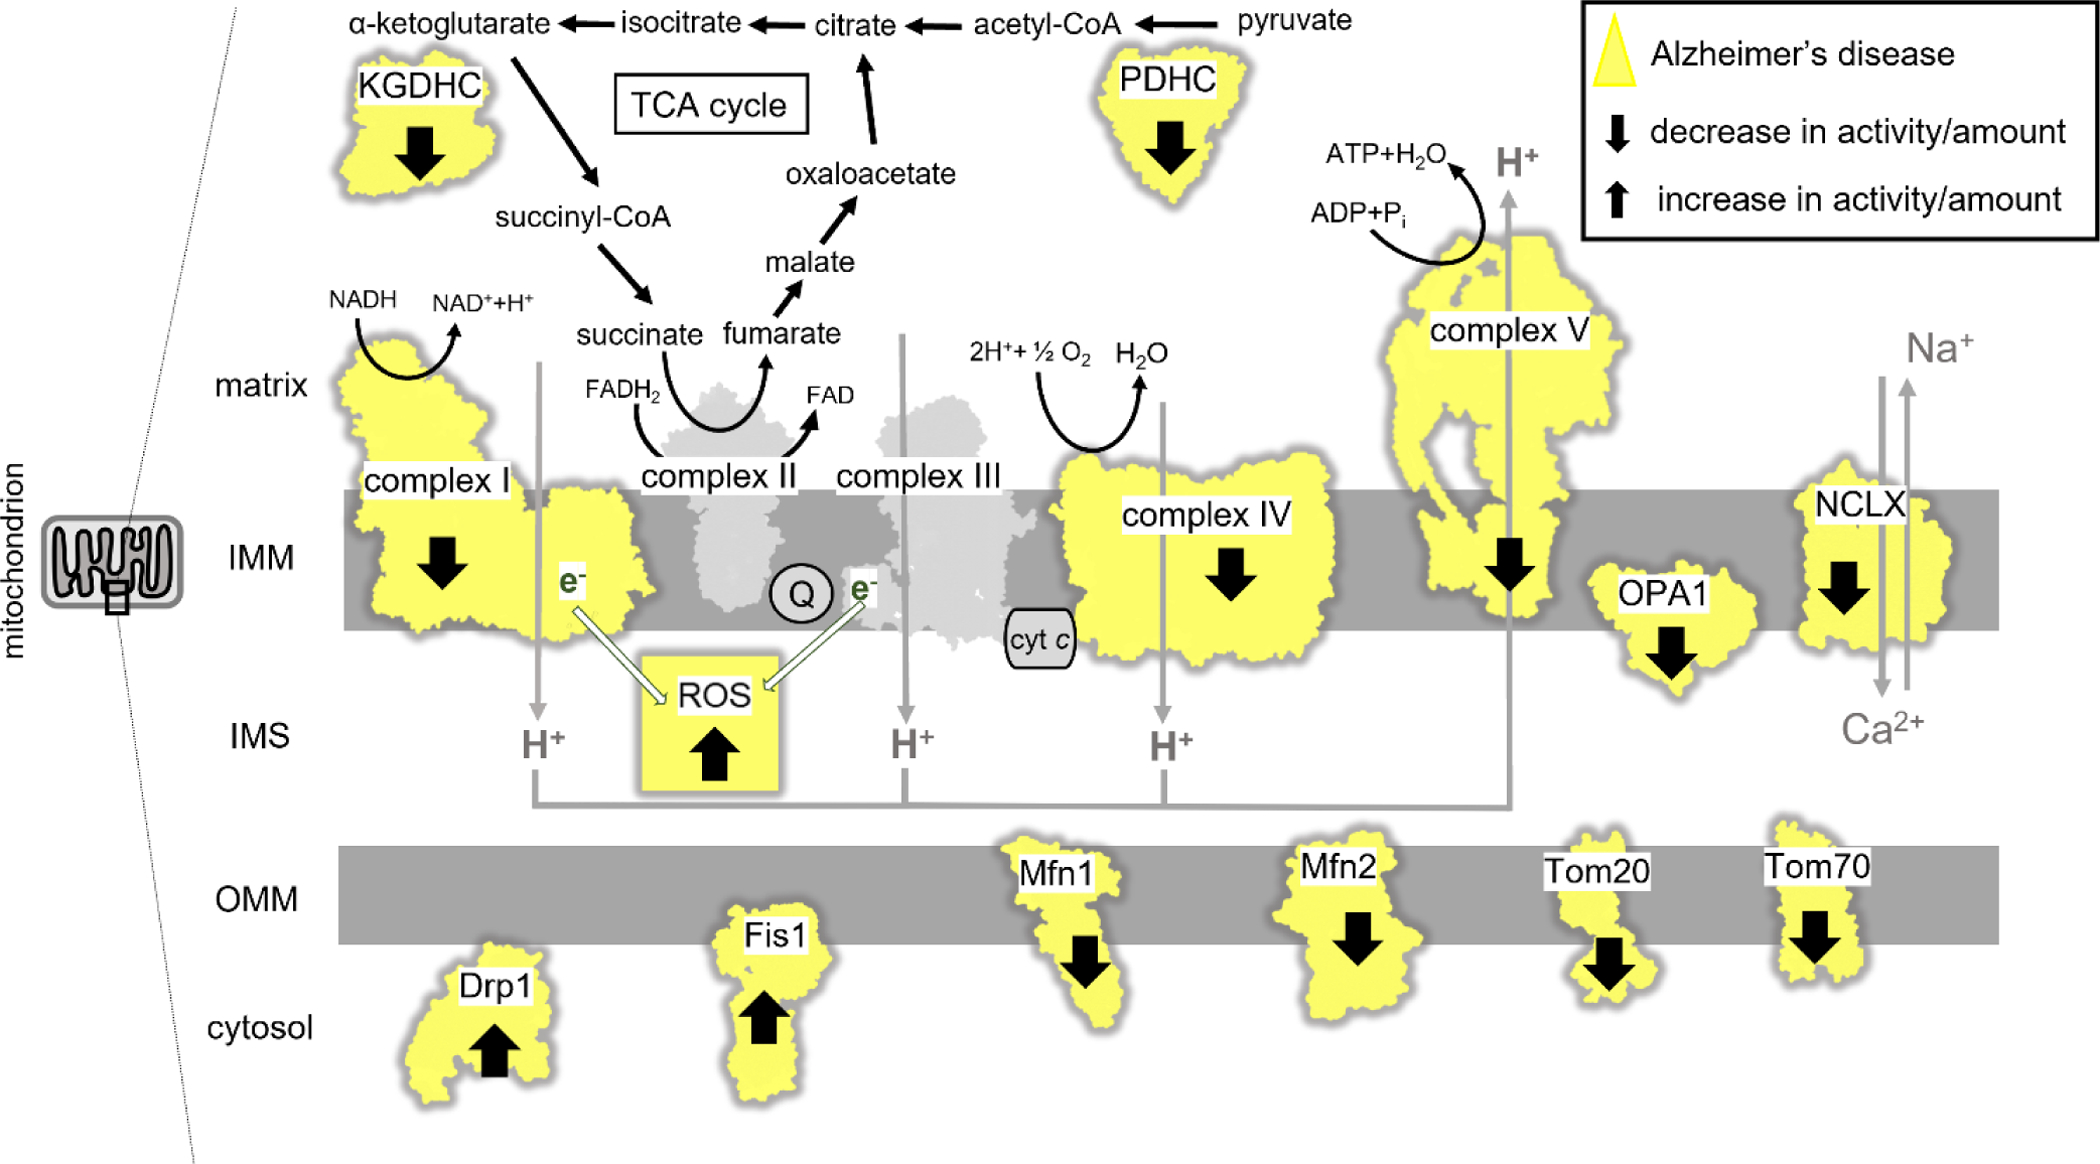
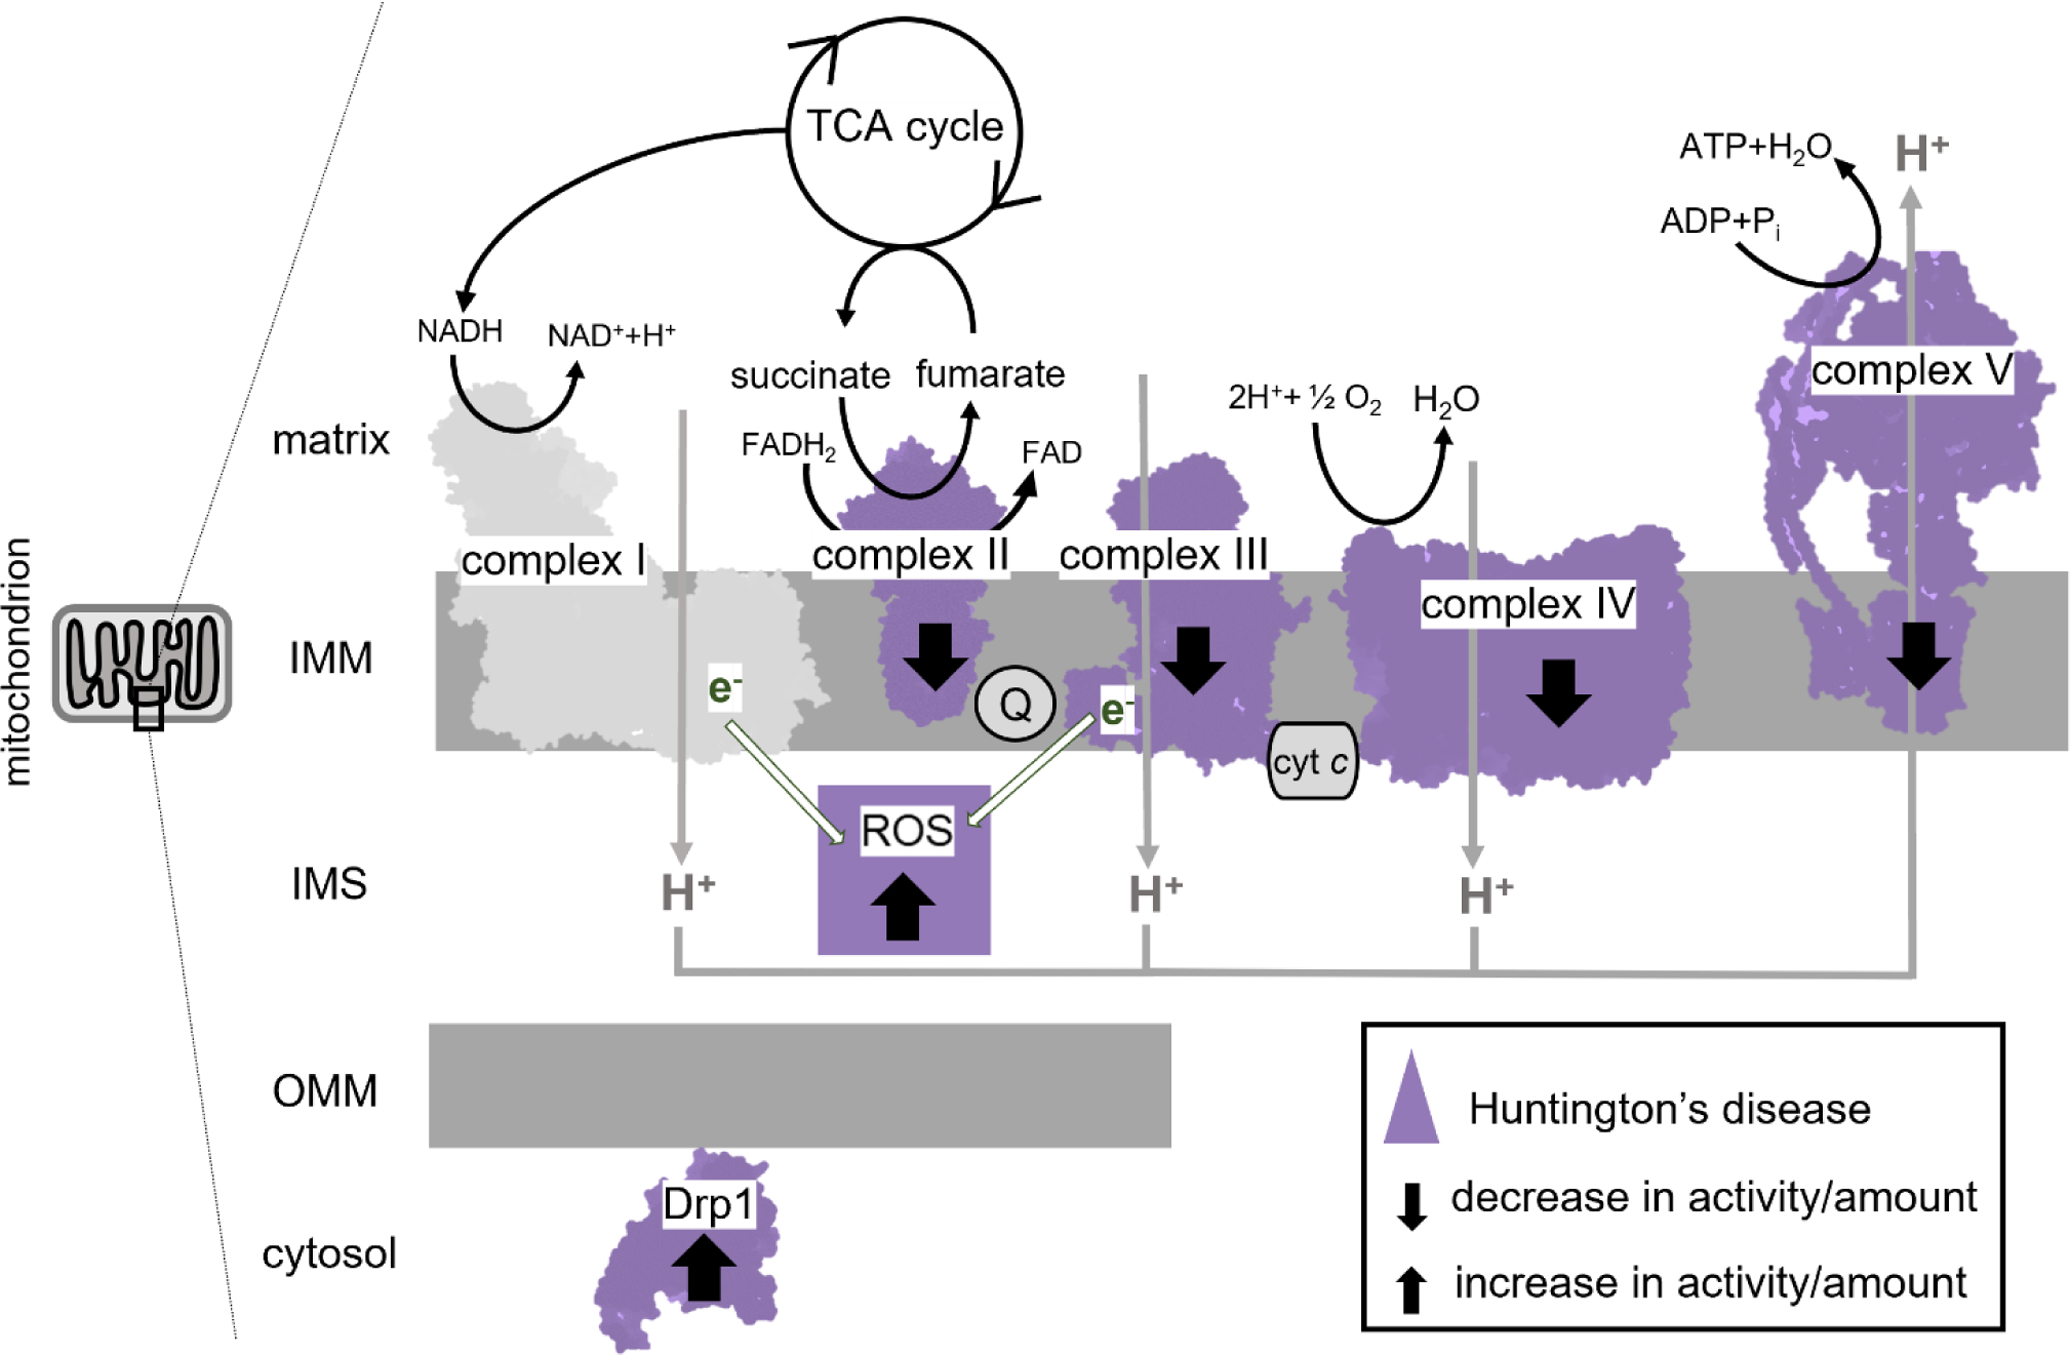
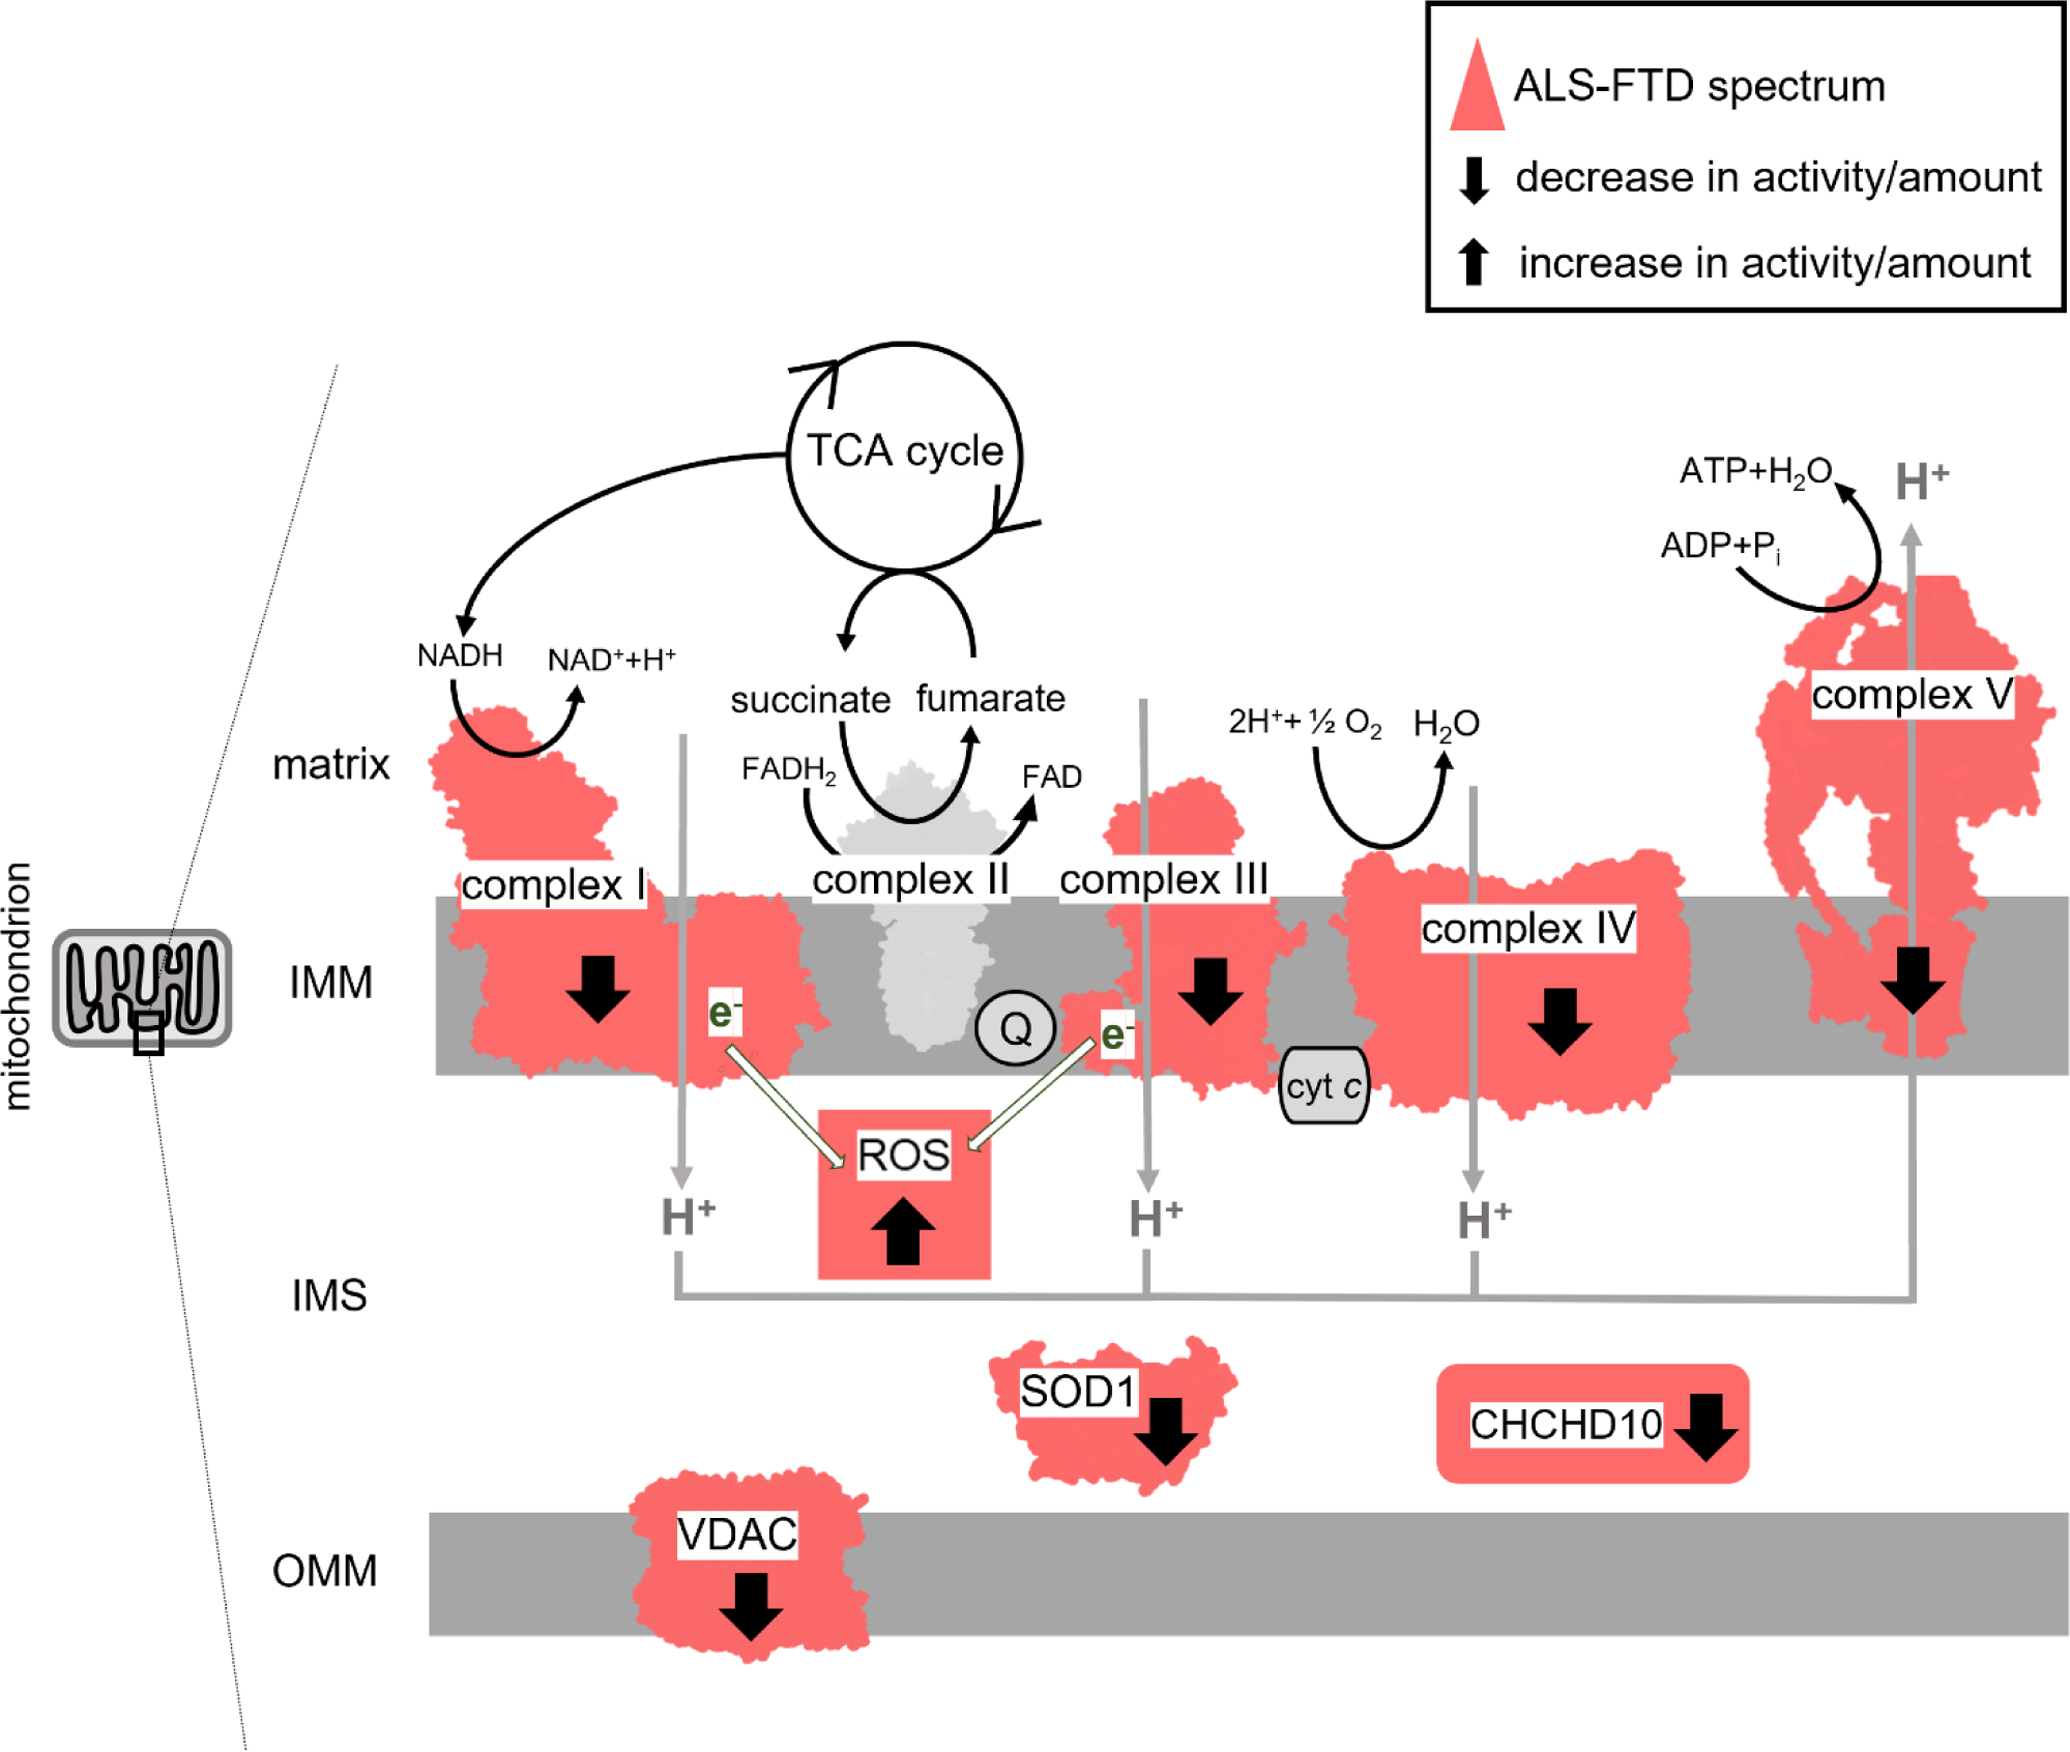
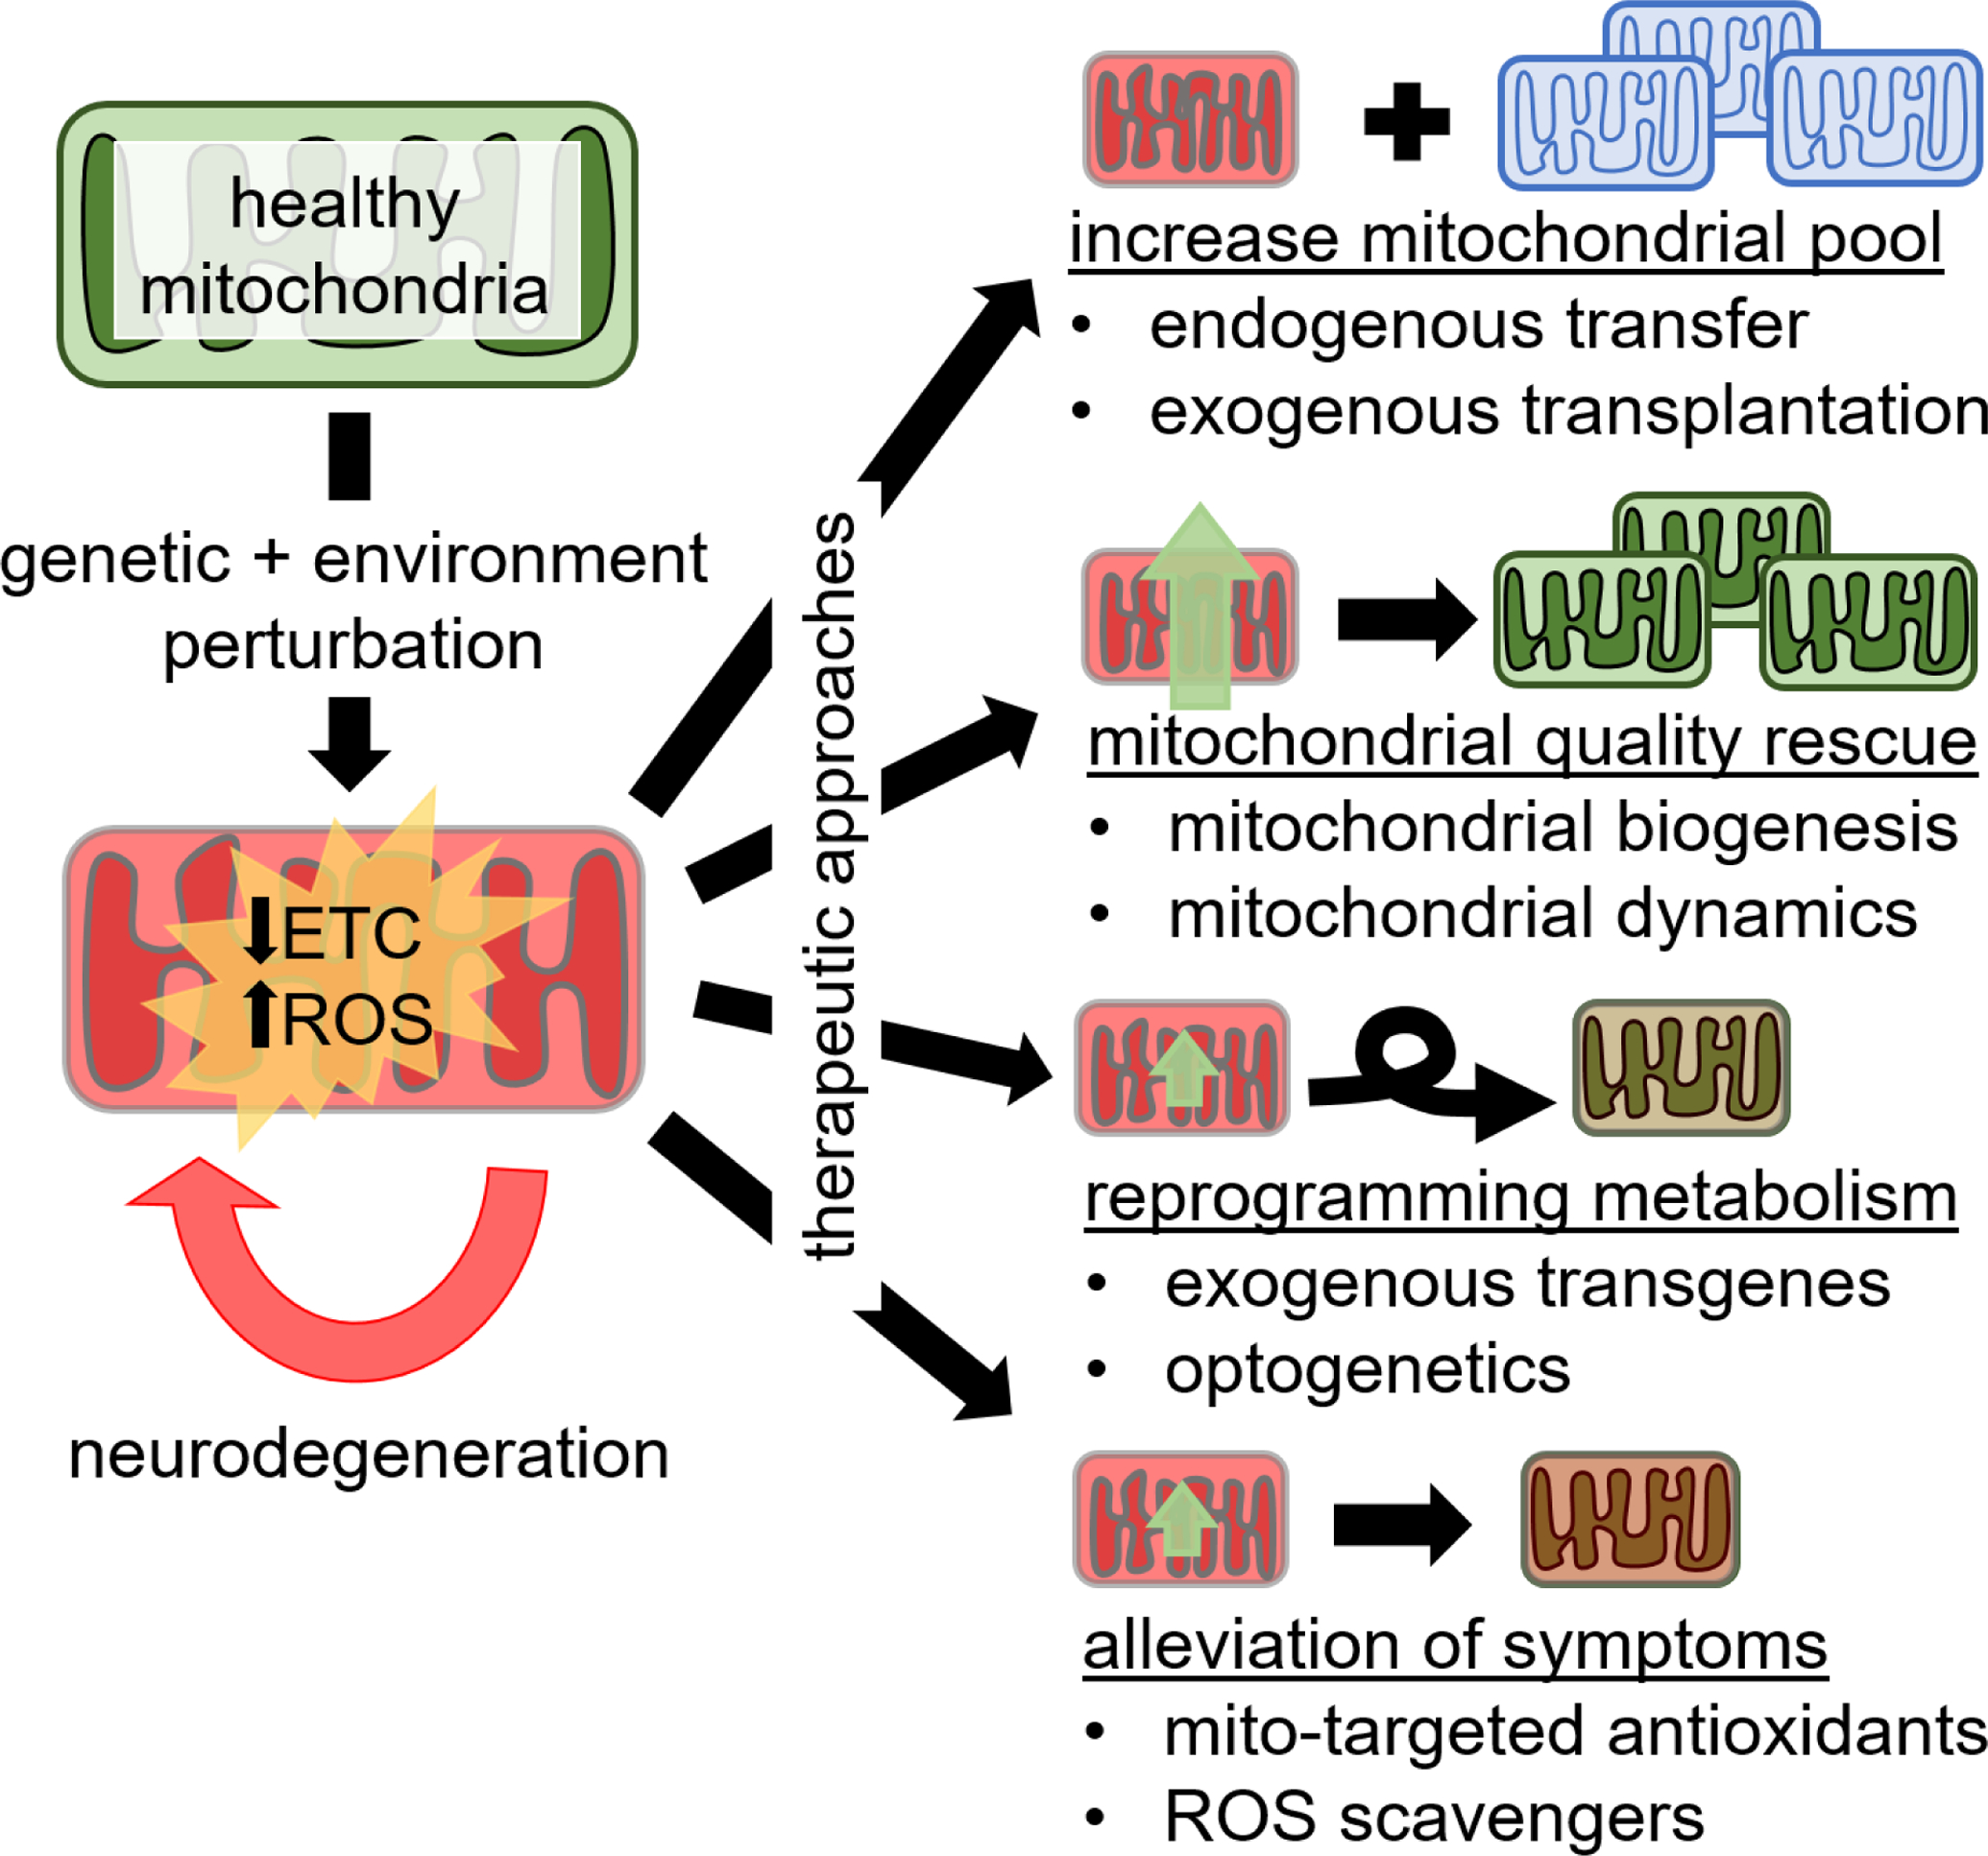
Mitochondria are essential for neuronal survival and mitochondrial dysfunction is a hallmark of neurodegeneration. The loss in mitochondrial energy production, oxidative stress, and changes in calcium handling are associated with neurodegenerative diseases; however, different sites and types of mitochondrial dysfunction are linked to distinct neuropathologies. Understanding the causal or correlative relationship between changes in mitochondria and neuropathology will lead to new therapeutic strategies. Here, we summarize the evidence of site-specific mitochondrial dysfunction and mitochondrial-related clinical trials for neurodegenerative diseases. We further discuss potential therapeutic approaches, such as mitochondrial transplantation, restoration of mitochondrial function, and pharmacological alleviation of mitochondrial dysfunction.
Keywords: Mitochondria-targeting therapeutics; Mitochondrial dysfunction; Neurodegeneration; Optogenetics; Transplantation.
Copyright © 2019 Elsevier B.V. and Mitochondria Research Society. All rights reserved. All rights reserved.
Conflict of interest statement
Figures
Similar articles
-
Targetable Pathways for Alleviating Mitochondrial Dysfunction in Neurodegeneration of Metabolic and Non-Metabolic Diseases.Int J Mol Sci. 2021 Oct 23;22(21):11444. doi: 10.3390/ijms222111444. Int J Mol Sci. 2021. PMID: 34768878 Free PMC article. Review.
-
Are oxidative stress and mitochondrial dysfunction the key players in the neurodegenerative diseases?Free Radic Res. 2012 Nov;46(11):1327-38. doi: 10.3109/10715762.2012.714466. Epub 2012 Aug 14. Free Radic Res. 2012. PMID: 22817279 Review.
-
Mitochondrial dysfunction and oxidative stress in neurodegenerative diseases.Nature. 2006 Oct 19;443(7113):787-95. doi: 10.1038/nature05292. Nature. 2006. PMID: 17051205 Review.
-
Mitochondrial biogenesis: pharmacological approaches.Curr Pharm Des. 2014;20(35):5507-9. doi: 10.2174/138161282035140911142118. Curr Pharm Des. 2014. PMID: 24606795
-
The Function of the Mitochondrial Calcium Uniporter in Neurodegenerative Disorders.Int J Mol Sci. 2017 Feb 10;18(2):248. doi: 10.3390/ijms18020248. Int J Mol Sci. 2017. PMID: 28208618 Free PMC article. Review.
Cited by
-
Scutellarin Rescued Mitochondrial Damage through Ameliorating Mitochondrial Glucose Oxidation via the Pdk-Pdc Axis.Adv Sci (Weinh). 2023 Nov;10(32):e2303584. doi: 10.1002/advs.202303584. Epub 2023 Sep 26. Adv Sci (Weinh). 2023. PMID: 37750289 Free PMC article.
-
Mitochondrial quality control alterations and placenta-related disorders.Front Physiol. 2024 Feb 8;15:1344951. doi: 10.3389/fphys.2024.1344951. eCollection 2024. Front Physiol. 2024. PMID: 38390447 Free PMC article. Review.
-
Mitochondrial Complex I and β-Amyloid Peptide Interplay in Alzheimer's Disease: A Critical Review of New and Old Little Regarded Findings.Int J Mol Sci. 2023 Nov 3;24(21):15951. doi: 10.3390/ijms242115951. Int J Mol Sci. 2023. PMID: 37958934 Free PMC article. Review.
-
All-optical spatiotemporal mapping of ROS dynamics across mitochondrial microdomains in situ.Nat Commun. 2023 Sep 27;14(1):6036. doi: 10.1038/s41467-023-41682-z. Nat Commun. 2023. PMID: 37758713 Free PMC article.
-
Mitochondrial energy state controls AMPK-mediated foraging behavior in C. elegans.Sci Adv. 2024 Apr 19;10(16):eadm8815. doi: 10.1126/sciadv.adm8815. Epub 2024 Apr 17. Sci Adv. 2024. PMID: 38630817 Free PMC article.
References
-
- Abrahams S, Goldstein LH, Simmons A, Brammer M, Williams SC, Giampietro V, Leigh PN, 2004. Word retrieval in amyotrophic lateral sclerosis: a functional magnetic resonance imaging study. Brain 127, 1507–1517. - PubMed
-
- Abyadeh M, Gupta V, Chitranshi N, Gupta V, Wu Y, Saks D, Wander Wall R, Fitzhenry MJ, Basavarajappa D, You Y, Salekdeh GH, Haynes PA, Graham SL, Mirzaei M, 2021. Mitochondrial dysfunction in Alzheimer’s disease - a proteomics perspective. Expert Rev Proteomics 18, 295–304. - PubMed
-
- Al Amir Dache Z, Otandault A, Tanos R, Pastor B, Meddeb R, Sanchez C, Arena G, Lasorsa L, Bennett A, Grange T, El Messaoudi S, Mazard T, Prevostel C, Thierry AR, 2020. Blood contains circulating cell-free respiratory competent mitochondria. FASEB J 34, 3616–3630. - PubMed
-
- Alavian KN, Dworetzky SI, Bonanni L, Zhang P, Sacchetti S, Mariggio MA, Onofrj M, Thomas A, Li H, Mangold JE, Signore AP, Demarco U, Demady DR, Nabili P, Lazrove E, Smith PJ, Gribkoff VK, Jonas EA, 2012. Effects of dexpramipexole on brain mitochondrial conductances and cellular bioenergetic efficiency. Brain Res 1446, 1–11. - PMC - PubMed
Publication types
MeSH terms
Substances
Grants and funding
LinkOut - more resources
Full Text Sources
Medical
