. 2022 Mar 3;185(5):896-915.e19.
doi: 10.1016/j.cell.2022.02.005. Epub 2022 Feb 9.

Respiratory mucosal delivery of next-generation COVID-19 vaccine provides robust protection against both ancestral and variant strains of SARS-CoV-2

Affiliations

Respiratory mucosal delivery of next-generation COVID-19 vaccine provides robust protection against both ancestral and variant strains of SARS-CoV-2

Sam Afkhami et al. Cell. .

Abstract

The emerging SARS-CoV-2 variants of concern (VOCs) threaten the effectiveness of current COVID-19 vaccines administered intramuscularly and designed to only target the spike protein. There is a pressing need to develop next-generation vaccine strategies for broader and long-lasting protection. Using adenoviral vectors (Ad) of human and chimpanzee origin, we evaluated Ad-vectored trivalent COVID-19 vaccines expressing spike-1, nucleocapsid, and RdRp antigens in murine models. We show that single-dose intranasal immunization, particularly with chimpanzee Ad-vectored vaccine, is superior to intramuscular immunization in induction of the tripartite protective immunity consisting of local and systemic antibody responses, mucosal tissue-resident memory T cells and mucosal trained innate immunity. We further show that intranasal immunization provides protection against both the ancestral SARS-CoV-2 and two VOC, B.1.1.7 and B.1.351. Our findings indicate that respiratory mucosal delivery of Ad-vectored multivalent vaccine represents an effective next-generation COVID-19 vaccine strategy to induce all-around mucosal immunity against current and future VOC.

Keywords: COVID-19; SARS-CoV-2; T cell immunity; adenoviral vector; animal models; chimpanzee adenoviral vector; human adenoviral vector; humoral immunity; intramuscular immunization; multi-valent vaccine; next-generation vaccines; respiratory mucosal immunity; respiratory mucosal immunization; trained innate immunity; variants of concern.


Conflict of interest statement

Declaration of interests B.D.L., F.S., and Z.X. are inventors on a US provisional patent application no. 63/222723, entitled “Novel COVID vaccine and method for delivery.” All other authors declare no competing interests.

Figures

None
Graphical abstract
Figure 1
Figure 1
Single-dose intranasal immunization leads to superior anti-spike protein humoral responses over intramuscular immunization (A) Transgene cassette diagram. (B) Western blot analysis of expression of S1-VSVG and N/RdRp protein from whole-cell lysates from A549 cells untransduced or transduced with Tri:HuAd or Tri:ChAd. GAPDH was used as a loading control for each condition. (C) Experimental schema. (D) Serum anti-spike IgG reciprocal endpoint antibody titers at 2 (red) and 4 (blue) weeks post-immunization. (E) Serum anti-RBD IgG reciprocal endpoint antibody titers at 2 (red) and 4 (blue) weeks post-immunization. (F) Reciprocal endpoint titer ratios of anti-spike IgG2a:IgG1 at 2 (red) and 4 (blue) weeks post-immunization. (G) Bar graph depicting serum neutralizing antibody responses 4 weeks post-immunization, measured by percent (%) inhibition with a surrogate virus neutralization test (sVNT). Green bar (+) indicates assay positive control. Gray bar (−) indicates assay negative control. (H) BAL anti-spike IgG reciprocal endpoint antibody titers at 4 weeks post-immunization. (I) Experimental schema. (J) Serum anti-spike (red) or anti-RBD (blue) IgG reciprocal endpoint antibody titers at 8 weeks post-immunization. (K) Bar graph depicting serum neutralizing antibody responses 8 weeks post-immunization, measured by percent (%) inhibition with a surrogate virus neutralization test (sVNT). Green bar (+) indicates assay positive control. Gray bar (−) indicates assay negative control. (L) Serum neutralizing antibody responses at 8 weeks post-immunization, measured by percent (%) neutralization utilizing a live SARS-CoV-2 microneutralization (MNT) assay. (M) BAL anti-spike IgG (left) or IgA (right) reciprocal endpoint antibody titers at 8 weeks post-immunization. (N) Bar graphs depicting the absolute number of class-switched IgG1+ RBD-specific B cells in the spleen (left) or lung (right) at 8 weeks post-immunization. Data presented in (D–H and J–N) represent mean ± SEM. Statistical analysis for (D, E, H, and J) were Kruskal-Wallis tests with Dunn’s multiple comparisons test. Statistical analysis for (G, K, and N) were two-tailed t tests. Data are from 2 pooled independent experiments, n = 3–12 mice/group. ns, not significant; ∗p < 0.05; ∗∗p < 0.01; ∗∗∗p < 0.001; ∗∗∗∗p < 0.0001. See also Figures S1, S2, and S3.
Figure S1
Figure S1
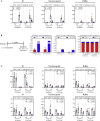
Acute safety assessment of intramuscularly or intranasally administered Tri:HuAd and Tri:ChAd COVID-19 vaccines, related to Figure 1 (A) Experimental schema. (B) Changes in body weight over 3 days post-vaccination. (C) Absolute number of neutrophils in the lung at 3 days post-immunization. (D) Cytokine levels in bronchoalveolar lavage fluids at 3 days post-immunization. (E) Serum levels of biomarkers for hepatotoxicity and nephrotoxicity at 3 days post-immunization. Data presented in (B, C, and E) represent mean ± SEM from n = 3–4 mice/group.
Figure S2
Figure S2
Characterization of immune responses following intramuscularly or intranasally administered HuAd- and ChAd-empty vectors, related to Figures 1, 2, and 3 (A) Experimental schema. (B) Serum anti-spike (red) or anti-RBD (blue) IgG reciprocal endpoint antibody titers at 4 weeks post-immunization. (C) Serum anti-nucleocapsid IgG responses based on optical density versus reciprocal serum dilutions following i.m. (red) or i.n. (blue) immunization with either Tri:HuAd or Tri:ChAd (top) or empty vector equivalents (bottom). (D) Bar graphs depicting absolute number of S1 (left), nucleocapsid (middle), or RdRp (right) specific IFN-γ+ CD8+ (top) or IFN-γ+ CD4+ (bottom) T cells in the BAL at 2 (red) and 4 (blue) weeks post-immunization following ex vivo stimulation with overlapping peptide pools. (E) Flow cytometric dot plots of CD44+ CD8+ T cells for CD69 and CD103 from the lung (left) or BAL (right) at 4 weeks post-immunization. Data presented in (B–E) represent mean ± SEM. Data are representative of 1–2 independent experiments, n = 3–9 mice/group.
Figure S3
Figure S3
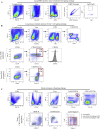
Flow cytometric gating strategies, related to Figures 1 and 3 (A) Gating strategy in this study used to distinguish antigen-specific, class-switched B cells. (B) Gating strategy in this study used to distinguish bona fide pulmonary tissue-resident memory CD8+ (top) or CD4+ (bottom) T cells. (C) Gating strategy in this study used to distinguish neutrophils, alveolar macrophages (AMs), and interstitial macrophages (IMs) from other major pulmonary myeloid cell populations. Examples shown are representative from BALB/c mice i.n. vaccinated with Tri:ChAd at 4 weeks post-immunization.
Figure 2
Figure 2
Single-dose intranasal immunization induces superior airway T cell responses over intramuscular immunization (A) Left, bar graphs depicting absolute number of S1-specific IFNγ+ CD8+ T cells in the BAL at 2 (red) and 4 (blue) weeks post-immunization. Right, representative flow cytometric dotplots of IFN-γ+ CD8+ T cells in the BAL following ex vivo stimulation with overlapping peptide pools for S1. (B) Bar graphs depicting multifunctional CD8+ T cell responses in the BAL as measured by production of IFN-γ, TNF-α, and/or IL-2 at 4 weeks post-immunization, following ex vivo stimulation with overlapping peptide pools for S1. (C) Stacked bar graph depicting the frequency of cytotoxic CD8+ T cells in the BAL as measured by Granzyme B production at 4 weeks post-immunization, following ex vivo stimulation with DMSO (red) or overlapping peptide pools for S1 (blue). (D–F) is the same as (A–C) but following stimulation with overlapping peptide pools for nucleocapsid. (G–I) is the same as (A–C) but following stimulation with overlapping peptide pools for RdRp. Data presented in (A–I) represent mean ± SEM. Statistical analysis were Mann-Whitney tests. Data are pooled from 2 independent experiments, n = 3–6 mice/group. ∗p < 0.05; ∗∗p < 0.01. See also Figures S2 and S4.
Figure S4
Figure S4
Comparison of antigen-specific CD4 and CD8 T cells in BAL and spleen following single-dose immunization with Tri:HuAd or Tri:ChAd vaccine, related to Figure 2 (A) Bar graphs depicting absolute number of S1 (left), nucleocapsid (middle), or RdRp (right) specific IFN-γ+ CD4+ T cells in the BAL at 2 (red) and 4 (blue) weeks post-immunization following ex vivo stimulation with overlapping peptide pools. (B) Left, Schema of vaccination regimen. BALB/c mice were intranasally (i.n.) vaccinated with a single dose of either Tri:HuAd or Tri:ChAd. Animals were sacrificed at 3 weeks post-immunization for immunological analysis. Bar graphs depicting frequency of IFN-γ+ CD4+ T cells (middle left), or IL4+ CD4+ T cells (middle right) following ex vivo stimulation with S1 overlapping peptide pools (red), or anti-CD3/CD28 (blue). Right, Ratio of IFNγ:IL-4 producing CD4+ T cells, based on data from middle panels. (C) Bar graphs depicting absolute number of S1 (left), nucleocapsid (middle), or RdRp (right) specific IFN-γ+ CD8+ (top) or IFN-γ+ CD4+ (bottom) T cells in the spleen at 2 (red) and 4 (blue) weeks post-immunization following ex vivo stimulation with overlapping peptide pools. Data presented in (A–C) represent mean ± SEM. Data are representative of 1 independent experiment, n = 3–4 mice/group.
Figure 3
Figure 3
Single-dose intranasal, but not intramuscular, immunization induces multifunctional respiratory mucosal tissue-resident memory T cells (A) Top: t-SNE maps were generated from concatenating CD3+ CD8+ CD4 gated lung mononuclear cells from 12 individual animals (3 per group of route/vaccine). Analysis was performed utilizing default FlowJo V.10 software settings. Bottom: overlay of populations arising after intramuscular (i.m., green) or intranasal (i.n., yellow) onto t-SNE maps. (B) Heatmap projections of CD44, CD69, CD103, or CD49a on t-SNE maps. Hashed circles indicate bona fide tissue-resident memory CD8+ T cells. (C) Overlap of populations arising after i.m. or i.n. Tri:HuAd (red) or i.m. or i.n. Tri:ChAd (blue). Hashed circles indicate two unique clusters of CD8+ T cells induced following i.n. immunization. (D) Bar graph depicting absolute number of tissue-resident memory CD8+ T cells in the lung at 8 weeks post-immunization. (E) Left: flow cytometric dot plots of CD44+ CD8+ T cells for CD69 and CD103 from the BAL at 8 weeks post-immunization. Right: histogram depicting expression of CD49a on CD69/CD103 double-positive CD44+ CD8+ T cells. (F) Bar graphs depicting absolute number of S1, nucleocapsid, or RdRp-specific IFN-γ+ CD8+ T cells in the BAL at 8 weeks post-immunization, following ex vivo stimulation with overlapping peptide pools for S1, nucleocapsid, or RdRp. (G) Sunburst plots depicting functionality (IFN-γ, TNF-α, and/or IL-2) of CD8+ T cells at 8 weeks post-immunization, following ex vivo stimulation with either S1, nucleocapsid, or RdRp peptide pools. Data presented in (D–F) represent mean ± SEM. Data are representative of 2 independent experiments, n = 3–6 mice/group. See also Figures S2, S3, and S5.
Figure S5
Figure S5
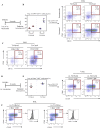
Single-dose intranasal immunization induces respiratory mucosal tissue-resident memory T cells, related to Figure 3 (A) Experimental schema. (B) Left: frequency of CD44+ CD8+ T cells in the lung. Right: flow cytometric dot plots of CD44+ CD8+ T cells for CD69 and CD103 from the lung at 8 weeks post-immunization. (C) Flow cytometric dot plots of CD44+ CD4+ T cells for CD69 and CD11a from the BAL at 8 weeks post-immunization. (D) Experimental schema. (E) Left: frequency of CD44+ CD8+ T cells in the lung. Right: flow cytometric dot plots of CD44+ CD8+ T cells for CD69 and CD103 from the lung at 4 weeks post-immunization. (F) Flow cytometric dot plots of CD44+ CD4+ T cells for CD69 and CD103 from the BAL at 4 weeks post-immunization. Histograms depicting expression of CD49a on CD69/CD103 double-positive CD44+ CD8+ T cells are shown. Data presented in (B, C, E, and F) represent mean ± SEM. Data are representative of 1 independent experiment, n = 3 mice/group.
Figure 4
Figure 4
Single-dose intranasal, but not intramuscular, immunization induces trained airway macrophages (A) Experimental schema. (B) Left, t-SNE maps were generated from concatenating CD45+ CD11b+/CD11c+ gated BAL mononuclear cells from 12 individual animals (3 per group of route/vaccine condition). Analysis was performed utilizing default FlowJo V.10 software settings. Right, heatmap projections of CD11c, CD11b, MHC II, Siglec-F, Ly6G, or Ly6C on t-SNE maps. Hashed circle indicates an MHC-II-high population. (C) Overlap of populations arising after i.m. or i.n. Tri:HuAd (red) or i.m. or i.n. Tri:ChAd (blue). Hashed circles indicate a unique MHC-II-high population induced following i.n. immunization. (D) MFI of MHC II expression on AM (left) and IM (right) in BAL at 8 weeks post-immunization. (E) Experimental schema. (F) Left, t-SNE maps were generated from concatenating CD45+ CD11b+/CD11c+ gated BAL mononuclear cells from 12 individual animals (3 per group of route/vaccine condition). Analysis was performed utilizing default FlowJo V.10 software settings. Right, heatmap projections of CD11c, CD11b, MHC II, Siglec-F, Ly6G, or Ly6C on t-SNE maps. Hashed circle indicates an MHC-II-high population. (G) Overlap of populations arising after i.n. Tri:HuAd (red) or Tri:ChAd (blue) or empty vector equivalent controls. Hashed circles indicate a unique MHC-II-high population induced following i.n. immunization with either Tri:HuAd or Tri:ChAd. (H) MFI of MHC II expression on AM (left) and IM (right) in BAL at 4 weeks post-immunization. Data presented in (D and H) represent mean ± SEM. Data are representative of 2 independent experiments, n = 3–6 mice/group. Statistical analysis for (D and H) were one-way ANOVA with Tukey’s multiple comparisons test. ∗∗p < 0.01; ∗∗∗p < 0.001; ∗∗∗∗p < 0.0001. Alveolar macrophage (AM), interstitial macrophage (IM), and median fluorescence intensity (MFI).
Figure 5
Figure 5
Intranasal, but not intramuscular, immunization provides potent B- and T-cell-dependent protection from SARS-CoV-2 infection (A) Experimental schema. (B) Changes in body weight over 2 weeks post-SARS-CoV-2 infection. (C) Viral burden (Log10TCID50) in the lung at 2 days post-SARS-CoV-2 MA10 infection. (D) Experimental schema. (E) Changes in body weight of unvaccinated BALB/c, T cell depleted BALB/c, or Jh−/− mice over 2 weeks post-SARS-CoV-2 infection. (F) Changes in body weight of i.n. Tri:ChAd-vaccinated BALB/c, T-cell-depleted BALB/c, or Jh−/− mice for 2 weeks post-SARS-CoV-2 infection. (G) Viral burden (Log10TCID50) in the lung of unvaccinated animals at 4 days post-infection. (H) Viral burden (Log10TCID50) in the lung of Tri:ChAd vaccinated animals at 4 days post-infection. (I) Experimental schemas. (J) Changes in body weight of over 2 weeks post-SARS-CoV-2 infection. Black circles indicate unvaccinated mice, blue circles indicate Tri:ChAd-vaccinated mice, red circles indicate Tri:ChAd-vaccinated mice with continuous T cell depletion, purple circles indicate Tri:ChAd-vaccinated mice with T cell depletion prior to infection. (K) Heatmap representing cumulative acute clinical observations: ruffled fur, lethargy/depression, and erratic/labored respiration. (L) Gross pathological changes from the lungs of vaccinated mice at 4 (left) and 14 (right) days post-infection. Hashed circles encompass areas of visible lung damage. (M) Viral burden (Log10TCID50) in the lung of animals at 4 days post-infection. Data presented in (B, C, E–H, J, and M) represent mean ± SEM. Data are representative of 1–2 independent experiments, n = 5 mice/group. Statistical analysis for (C, G, H, and M) were one-way ANOVA with Tukey’s multiple comparisons test. ns, not significant; ∗p < 0.05; ∗∗p < 0.01; ∗∗∗p < 0.001. See also Figures S6 and S7.
Figure S6
Figure S6
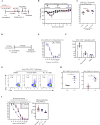
Assessment of intranasal administration of empty vector HuAd:EV and ChAd:EV following SARS-CoV-2 infection, related to Figure 5 (A–C) Representative histopathological images of lungs 14 days post-SARS-CoV-2 MA10 infection in animals intranasally (i.n.) vaccinated with either Tri:HuAd (B) or Tri:ChAd (C), in comparison with unvaccinated controls (A), as per Figure 5A. (D) Experimental schema. (E) Changes in body weight over 2 weeks post-SARS-CoV-2 infection. (F) Viral burden (Log10TCID50) in the lung at 4 days post-SARS-CoV-2 MA10 infection. Data presented in (E and F) represent mean ± SEM. Statistical analysis for (F) were one-way ANOVA with Tukey’s multiple comparisons test. Data in (E) are representative of 1 independent experiment, n = 5 mice/group. Data in (F) is pooled from 2 independent experiments, n = 10 mice per group. ns, not significant.
Figure S7
Figure S7
Assessment of B- and T-cell-dependent protection from SARS-CoV-2 infection following intranasal immunization with Tri:HuAd, and characterization of immunogenicity of intranasal immunization with Tri:ChAd vaccine in wild-type C57BL/6 or K18-hACE2 mice, related to Figures 5 and 6 (A) Experimental schema. (B) Changes in body weight of i.n. Tri:HuAd-vaccinated BALB/c, T-cell-depleted BALB/c, or Jh−/− mice for 2 weeks post-SARS-CoV-2 infection. (C) Viral burden (Log10TCID50) in the lung of Tri:HuAd vaccinated animals at 4 days post-infection. (D) Experimental schema. (E) Serum neutralizing antibody responses at 4 weeks post-immunization in C57BL/6 mice, measured by percent (%) neutralization utilizing a live SARS-CoV-2 microneutralization (MNT) assay. (F) Absolute number of antigen-specific IFNγ+ CD8+ T cells in the airway at 4 weeks post-immunization in C57BL/6 mice, following ex vivo stimulation with overlapping peptide pools for S1, nucleocapsid, or RdRp. (G) Flow cytometric dot plots showing frequencies of spike-specific IFN-γ+ CD8+ T cells in lung mononuclear cells at 4 weeks post-immunization in C57BL/6 mice, upon stimulation with either ancestral or variant SARS-CoV-2 spike protein at 4 weeks post-immunization. (H) MFI of MHC II expression on AM (left) and IM (right) in BAL at 4 weeks post-immunization in C57BL/6 mice. (I) Left, serum neutralizing antibody responses at 4 weeks post-immunization of K18-hACE2 mice, measured by percent (%) neutralization utilizing a live SARS-CoV-2 ancestral (red), B.1.1.7 (blue), or B.1.351 (purple) microneutralization (MNT) assay. Right, MNT50 values. Data presented in (B, C, and E–I) represent mean ± SEM. Statistical analysis for (C) was one-way ANOVA with Tukey’s multiple comparisons test. Statistical analysis for (H) was two-tailed t tests. Data are representative of 1 independent experiment, n = 3–5 mice/group. ∗p < 0.05.
Figure 6
Figure 6
Intranasal Tri:ChAd immunization protects against lethal challenge with SARS-CoV-2 variants of concern (A) Experimental schema. (B) Changes in body weight over 2 weeks post-ancestral SARS-CoV-2 infection. (C) Survival of mice post-ancestral SARS-CoV-2 SB3 infection. (D) Viral burden (Log10TCID50) in the lung at 4 days post-infection. (E) Changes in body weight over 2 weeks post-SARS-CoV-2 B.1.1.7 infection. (F) Survival of mice post-SARS-CoV-2 B.1.1.7 infection. (G) Changes in body weight over 2 weeks post-SARS-CoV-2 B.1.351 infection. (H) Survival of mice post-SARS-CoV-2 B.1.351 infection. (I) Viral burden (Log10TCID50) in the lung at 4 days post-B.1.1.7 or B.1.351 infection. (J) Viral burden (Log10TCID50) in the brain at 4 days post-B.1.1.7 or B.1.351 infection. Data presented in (B, D, E, G, I, and J) represent mean ± SEM. Statistical analysis for (D, I, and J) were one-way ANOVA with Tukey’s multiple comparisons test. Data in (B and C) are pooled from 2 independent experiments, n = 5–11 mice/group. Data in (D–J) are representative of 1 experiment, n = 5 mice/group. ns, not significant; ∗p < 0.05; ∗∗∗∗p < 0.0001. See also Figure S7.
Figure 7
Figure 7
Comparison of protective efficacy of ChAd-vectored trivalent vaccine with its bi-valent and mono-valent counterparts (A) Transgene cassette diagrams for bi-valent (Bi:ChAd, left) and mono-valent (Mono:ChAd, right) ChAd vaccines. (B) Experimental schema. (C) Changes in body weight over 2 weeks post-SARS-CoV-2 infection. (D) Viral burden (Log10TCID50) in the lung at 4 days post-SARS-CoV-2 MA10 infection. (E) Experimental schema. (F) Changes in body weight over 2 weeks post-SARS-CoV-2 B.1.351 infection (open circles: 1 surviving animal). (G) Viral burden (Log10TCID50) in the lung at 4 days post-B.1.351 infection. (H) Viral burden (Log10TCID50) in the brain at 4 days post-B.1.351 infection. (I) Experimental schema. (J) Changes in body weight over 2 weeks post-SARS-CoV-2 B.1.351 infection. (K) Gross pathological changes from the lungs of vaccinated mice at 4 days post-infection. Hashed circles encompass areas of visible lung damage. (L) Viral burden (Log10TCID50) in the lung at 4 days post-B.1.351 infection. Data presented in (C, D, F–H, J, and L) represent mean ± SEM. Statistical analysis for (D, G, H, and L) were one-way ANOVA with Tukey’s multiple comparisons test. Data in (C, D, F, G, and H) are pooled from 2 independent experiments, n = 3–11 mice/group. Data in (J–L) are representative of 1 experiment, n = 5 mice/group. ∗p < 0.05; ∗∗p < 0.01; ∗∗∗p < 0.001; ∗∗∗∗p < 0.0001.

Comment in

Similar articles

Cited by

References

    1. Abu-Raddad L.J., Chemaitelly H., Butt A.A. Effectiveness of the BNT162b2 COVID-19 vaccine against the B.1.1.7 and B.1.351 variants. N. Engl. J. Med. 2021;385:187–189. - PMC - PubMed
    1. Alter G., Yu J., Liu J., Chandrashekar A., Borducchi E.N., Tostanoski L.H., McMahan K., Jacob-Dolan C., Martinez D.R., Chang A., et al. Immunogenicity of Ad26.COV2.S vaccine against SARS-CoV-2 variants in humans. Nature. 2021;596:268–272. - PMC - PubMed
    1. Altmann D.M., Boyton R.J. SARS-CoV-2 T cell immunity: specificity, function, durability, and role in protection. Sci. Immunol. 2020;5:eabd6160. - PubMed
    1. Amanat F., Stadlbauer D., Strohmeier S., Nguyen T.H.O., Chromikova V., McMahon M., Jiang K., Arunkumar G.A., Jurczyszak D., Polanco J., et al. A serological assay to detect SARS-CoV-2 seroconversion in humans. Nat. Med. 2020;26:1033–1036. - PMC - PubMed
    1. Andreano E., Rappuoli R. SARS-CoV-2 escaped natural immunity, raising questions about vaccines and therapies. Nat. Med. 2021;27:759–761. - PubMed

Publication types

MeSH terms

Supplementary concepts