. 2022 Mar 7;221(3):e202106014.
doi: 10.1083/jcb.202106014. Epub 2022 Feb 18.

The core autophagy protein ATG9A controls dynamics of cell protrusions and directed migration

Affiliations

The core autophagy protein ATG9A controls dynamics of cell protrusions and directed migration

Daniele Campisi et al. J Cell Biol. .

Abstract

Chemotactic migration is a fundamental cellular behavior relying on the coordinated flux of lipids and cargo proteins toward the leading edge. We found here that the core autophagy protein ATG9A plays a critical role in the chemotactic migration of several human cell lines, including highly invasive glioma cells. Depletion of ATG9A protein altered the formation of large and persistent filamentous actin (F-actin)-rich lamellipodia that normally drive directional migration. Using live-cell TIRF microscopy, we demonstrated that ATG9A-positive vesicles are targeted toward the migration front of polarized cells, where their exocytosis correlates with protrusive activity. Finally, we found that ATG9A was critical for efficient delivery of β1 integrin to the leading edge and normal adhesion dynamics. Collectively, our data uncover a new function for ATG9A protein and indicate that ATG9A-positive vesicles are mobilized during chemotactic stimulation to facilitate expansion of the lamellipodium and its anchorage to the extracellular matrix.


Figures

None
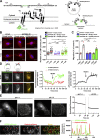
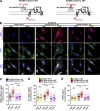
Graphical abstract
Figure S1.
Figure S1.
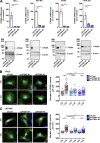
Validation of ATG9A knockdown. (A) The indicated cell lines were transfected with nontargeting siRNA (siCont) or one of the two siRNAs targeting ATG9A (siATG9A #1, siATG9A #2). Upper panel: RT-qPCR analysis of ATG9A mRNA levels. Data show means ± SEM (n = 4). Lower panel: Western blot analysis of ATG9A protein levels. The blot was cut, and the upper and the lower parts were probed with antibodies against ATG9A and β-actin, respectively. MM, molecular mass. (B and C) Effect of siRNA knockdown of ATG9A on autophagosome biogenesis in HeLa cells (B) or U87 MG cells (C). Cells were transfected with nontargeting siRNA (siCont) or one of the two siRNAs targeting ATG9A (siATG9A #1, siATG9A #2), together with a construct encoding the EGFP-LC3B protein (marker of autophagosomes). Transfected cells were placed in serum-free medium for 6 h, in the presence or absence of CQ (5 × 10⁻⁵ M), as indicated. Cells were fixed, and the number of autophagosomes (EGFP-LC3B fluorescent dots) per cell was quantified. Data represent means ± SEM (n = 140–221 cells per group; cells from independent experiments were color-coded. Scale bar, 20 µm. Statistical significance was evaluated using Mann–Whitney U test (A) or one-way ANOVA followed by Sidak post hoc test (B and C). *, P < 0.05; ***, P < 0.001.
Figure 1.
Figure 1.
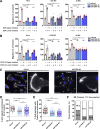
Depletion of ATG9A impairs chemotactic migration and the formation of F-actin–rich protrusions. (A) Effect of siRNA knockdown of ATG9A on chemotactic migration induced by EGF. HeLa cells (left), U87 MG cells (middle), and 42 MG cells (right) were transfected with nontargeting siRNA (siCont) or one of the two siRNAs targeting ATG9A (siATG9A #1, siATG9A #2). Transfected cells were loaded in the upper chamber of Transwells, with or without EGF (50 ng/ml) in the upper or lower chamber, as indicated. After 24 h, cells that migrated onto the lower surface of the membrane were fixed, stained, and counted. Data represent means and SEM (n = 6 Transwells). (B) Effect of siRNA knockdown of ATG9A on chemotactic migration induced by CXCL12. Experiment was performed as described in C, using CXCL12 (10−8 M), on HeLa cells (left), HEK 293 cells (middle), and 42 MG cells (right). (C) Representative epifluorescence images showing F-actin (rhodamine phalloidin labeling; gray levels) and nuclei (DAPI labeling; blue) of U87 MG cells transfected with the indicated siRNAs. Control cells generally develop large F-actin–rich lamellipodia (arrowheads), whereas ATG9A-depleted cells display smaller and irregular protrusions (arrowheads). Scale bars, 20 µm; magnified views, 5 µm. (D) Quantification of F-actin intensities, after background subtraction, in protrusions of U87 MG cells transfected with the indicated siRNAs. For each cell, values correspond to cumulated signal of all protrusions. Data represent means and SEM (n = 106–135 cells per group; cells from independent experiments were color-coded). (E) Percentage of the cell perimeter containing F-actin–rich protrusions, in U87 MG cells transfected with the indicated siRNAs. Data represent means and SEM (n = 209–219 cells per group; cells from independent experiments were color-coded). (F) Effect of siRNA knockdown of ATG9A on cell polarization of U87 MG cells (n = 212–226 cells per group; from three independent experiments). Statistical significance was evaluated using a one-way ANOVA followed by Tukey post hoc test. *, P < 0.05; ***, P < 0.001.
Figure 2.
Figure 2.
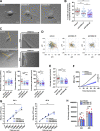
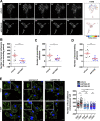
Depletion of ATG9A protein impairs the dynamics of cell protrusions and intrinsic cell speed. (A) Representative images from phase-contrast time-lapse sequences acquired from U87 MG cells transfected with nontargeting siRNA (siCont) or one of the two siRNAs targeting ATG9A (siATG9A #1, siATG9A #2). (B) Percentage of the cell perimeter occupied by ruffling protrusions (n = 94–106 cells per group; cells from independent experiments were color-coded). (C) Phase-contrast time-lapse sequences acquired from U87 MG cells transfected with nontargeting siRNA (siCont) or one of the two siRNAs targeting ATG9A (siATG9A #1 or siATG9A #2). Upper panels: Single images from representative sequences of U87 MG cells transfected with nontargeting siRNA (siCont) and siATG9A #2 (upper left; scale bar, 20 µm), and kymographs (upper right) generated from 1-pixel-wide lines drawn on the cell edges. The scale bars in the kymographs are 20 µm (horizontal) and 40 min (vertical). Lower panels: Quantification, from kymographs, of protrusion velocity (left), protrusion distance (middle), and protrusion persistence (right; n = 84–87 protrusions per group; cells from independent experiments were color-coded). (D) Cell trajectories over a 3-h period (one frame every 40 s) of randomly migrating U87 MG cells transfected with nontargeting siRNA (siCont, n = 101 cells) or siRNA targeting ATG9A (siATG9A #1, n = 88 cells; siATG9A #2, n = 97 cells). (E and F) Analysis of average cell speed (E) and mean square displacement (MSD; F), calculated from the cell trajectories presented in D. (G) Relative ATP levels from lysates of serial amounts of U87 MG cells transfected with nontargeting siRNA (siCont) or one of the two siRNAs targeting ATG9A (siATG9A #1, siATG9A #2). Analyses (n = 3 wells for each cell number) were performed at 24 h (left panel) or 48 h (right panel) after transfection. Results were normalized to that of cells transfected with nontargeting siRNA (2,500 cells). (H) Measurement of cell density at 24 and 48 h after transfection, from cells transfected with nontargeting siRNA (siCont) or one of the two siRNAs targeting ATG9A (siATG9A #1, siATG9A #2). Data represent means and SEM. Statistical significance was evaluated using one-way ANOVA followed by Tukey post hoc test (B, C, and E), two-way ANOVA followed by Dunnett post hoc test (F), two-way ANOVA followed by Bonferroni post hoc test (G), or one-way ANOVA followed by Sidak post hoc test (H). ***, P < 0.001.
Figure 3.
Figure 3.
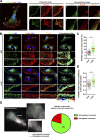
ATG9A-positive vesicles concentrate in F-actin–rich protrusions and display anterograde trafficking toward the leading edge. (A) Endogenous ATG9A localizes in F-actin–rich cell protrusions. Left: U87 MG cells colabeled for endogenous ATG9A (green), F-actin (rhodamine phalloidin, red) and nuclei (DAPI labeling, blue). Scale bar, 20 µm. Middle and right: Magnified views of cell presented on the left panel, showing protrusive (middle) and nonprotrusive (right) areas. Scale bar for magnified views, 10 µm. (B) Chemotactic stimulation with EGF increases peripheral localization of ATG9A. U87 MG cells were starved (30 min) in serum-free medium and incubated (30 min) with or without EGF (50 ng/ml), as indicated. Cells were fixed and labeled for endogenous ATG9A (green), F-actin (rhodamine phalloidin, red), and DAPI (nuclei, blue). For each condition, a merged image and an ATG9A/F-actin colocalization map are shown. The association of ATG9A with F-actin was representatively shown with Colocalization Colormap tool, where normalized mean deviation product (nMDP) shows the correlation between intensities of corresponding pixels. Scale bar, 20 µm; magnified views, 10 µm. (C) Quantification from images shown in B of the fraction of the ATG9A signal located in F-actin–rich protrusions. For each cell, values correspond to the cumulated signal of all protrusions (−EGF, n = 88 cells; +EGF, n = 89 cells; from two independent experiments). (D) Quantification from images shown in B of the ATG9A/F-actin colocalization score (Pearson coefficient) at the cell periphery, in an ROI 1.5-µm width from the cell membrane. Data represent means ± SEM (−EGF, n = 73 cells; +EGF, n = 74 cells; from two independent experiments). (E) ATG9A-mCherry–positive vesicles display anterograde trafficking toward the leading edge. Left: Map of all observed (5-min period) ATG9A-mCherry vesicle trajectories from a representative polarized U87 MG cell. Trajectories were color-coded and defined as anterograde (green) or retrograde (red), as a function of vesicle displacement relative to the cell centroid. Scale bar, 20 µm; magnified views, 10 µm. Right: Pie chart showing the percentage of ATG9A-mCherry vesicles displaying anterograde or retrograde movement in cell protrusions (total number of 87 trajectories, recorded from four U87 MG polarized cells). Statistical significance was evaluated using Mann–Whitney U test. ***, P < 0.001.
Figure S2.
Figure S2.
Structure and functional validation of ATG9A-pHluorin construct. (A) Left: Topology of human ATG9A protein, adapted from Guardia et al. (2020), displaying four transmembrane domains (α2, α6, α14, and α15) and two domains (α11 and α19) that are partially embedded in the membrane. The ATG9A-pHluorin fusion protein was produced by inserting the pHluorin sequence (depicted by a cartoon of GFP) into the first luminal domain, between amino acids Leu102 and His103 of the human sequence. Right: The pHluorin fluorescence is expected to be quenched at the acidic endosomal pH. Upon fusion of ATG9A-containing endosomes with the plasma membrane, pHluorin fluorescence will sharply increase at the contact of extracellular physiological pH. (B) Left: Validation of functional activity of ATG9A-pHluorin on autophagosome biogenesis. U87 MG cells were transfected with nontargeting siRNA (siCont) or siRNA targeting ATG9A (siATG9A #2; this siARN specifically targets endogenous ATG9A, without affecting the expression of recombinant ATG9A-pHluorin, due to the codon-optimization procedure of the recombinant sequence introducing several siRNA/target mRNA mismatches), together with an empty vector or the ATG9A-pHluorin construct and a construct encoding the mCherry-LC3B protein (marker of autophagosomes). Transfected cells were placed in serum-free DMEM for 6 h, in the presence or absence of CQ (5 × 10⁻⁵ M), as indicated. Cells were fixed, and the number of autophagosomes (mCherry-LC3B fluorescent dots) per cell was quantified. Data represent means and SEM (n = 85–111 cells per group; cells from independent experiments were color-coded). Scale bar, 20 µm. Note that the marked reduction of autophagosome biogenesis induced by the knockdown of endogenous ATG9A was totally rescued by overexpression of recombinant ATG9A-pHluorin, indicating that insertion of the pHluorin sequence within the IL1 loop of ATG9A does not preclude its pro-autophagic function. (C) Validation of functional activity of ATG9A-pHluorin on cell migration. U87 MG cells were transfected with nontargeting siRNA (siCont) or siRNA targeting ATG9A (siATG9A #2), together with an empty vector or the vector encoding ATG9A-pHluorin. Transfected cells were loaded in the upper chamber of Transwells, with or without EGF (50 ng/ml) in the lower chamber, as indicated. After 24 h, cells that migrated onto the lower surface of the membrane were fixed, stained, and counted. Data represent means and SEM (n = 5 Transwells). Note that inhibition of chemotactic migration induced by the knockdown of endogenous ATG9A was rescued by overexpression of recombinant ATG9A-pHluorin. (D) Validation of ATG9A-pHluorin topology. Representative U87 MG cell coexpressing ATG9A-pHluorin and ATG9A-mCherry was imaged by epifluorescence (one frame every 30 s) before and after treatment with BafA1 (100 nM), a selective inhibitor of the vacuolar-type ATPase, an essential proton pump for maintaining vesicular acidic pH. Left: Images extracted from the time-lapse sequence before (BafA1) and at the end (+BafA1; 1-h incubation) of BafA1 treatment. Scale bar, 20 µm. Middle: mCherry and pHluorin fluorescence signal intensities measured in the perinuclear area and plotted against time. Right: Analysis of the pHluorin/mCherry fluorescence intensity ratio, plotted against time. The increased ratio value following BafA1 treatment indicates dequenching of the pHluorin signal in endosomes, suggesting that the ATG9A-pHluorin fusion protein has the expected topology, with the pHluorin facing the vesicular lumen. (E) Left: Representative U87 MG cell expressing ATG9A-pHluorin recorded using TIRF microscopy (one frame every 390 ms), before (pH 7.4) and after (pH 5.5) acidification of the extracellular medium. Note that most ATG9A-pHluorin puncta rapidly dimmed after extracellular acidification, indicating that ATG9A-pHluorin proteins concentrating in these puncta are located at the plasma membrane, with the pHluorin facing the extracellular medium. Right: pHluorin fluorescence signal intensity measured before and after extracellular acidification and plotted against time. Scale bar, 20 µm; magnified views, 10 µm. (F) ATG9A static puncta colocalize with the endocytic marker clathrin. Left: Representative TIRF images extracted from a time-lapse sequence showing a U87 MG cell coexpressing ATG9A-pHluorin (green) and clathrin-mCherry (red). Note that ATG9A-pHluorin puncta frequently localize with clathrin (red arrowheads), suggesting that they likely represent ATG9A-pHluorin proteins trapped in forming endocytic structures. Right: Line profile plot indicates the fluorescence intensity distribution of green and red channels, through the white line shown in the merged image. Scale bar, 2 µm. Statistical significance was evaluated using one-way ANOVA followed by Tukey post hoc test (B and C). *, P < 0.05; ***, P < 0.001.
Figure 4.
Figure 4.
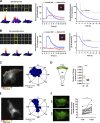
Exocytosis of ATG9A-positive vesicles is polarized toward the cell front and induced by chemotactic stimulation. (A) U87 MG cells expressing ATG9A-pHluorin were recorded (one frame every 390 ms) using TIRF microscopy. Upper left: Time-lapse sequence of a representative spreading event. Yellow circle indicates the rapid appearance of the pHluorin signal, likely due to de-acidification upon fusion pore opening. Arrows indicate diffusion of the fluorescence signal in areas of the plasma membrane surrounding the insertion sites. Scale bar, 1 µm. Bottom left: 3D fusion profiles of the indicated images (framed in yellow) from the time-lapse sequence. Middle: Normalized fluorescence intensities, from the analysis of 68 spreading events. For each event, measurements were performed in parallel into a central ROI (5 × 5 pixels; 0.64 × 0.64 µm) and a distant ROI (delimited by 13 × 13–pixel and 17 × 17–pixel squares). Data represent means and SEM. Right: Nonlinear regression analysis (single exponential decay) from the profile obtained in the central ROI, for the determination of spreading event half-life (2.8 s). (B) U87 MG cells expressing ATG9A-pHluorin were recorded as in A. Upper left: Time-lapse sequence of a representative nonspreading event. Scale bar, 1 µm. Bottom left: 3D fusion profiles of the indicated images (framed in yellow) from the time-lapse sequence. Middle: Normalized fluorescence intensities, from the analysis of 13 nonspreading events. For each event, measurements were performed in a central ROI and a distant ROI, as in A. Data represent means and SEM. Right: Nonlinear regression analysis (plateau followed by single exponential decay) from the profile obtained in the central ROI, for the determination of nonspreading event half-life (4 s). (C) Left: Map of all observed (n = 248) ATG9A-pHluorin fusion events from a representative, polarized U87 MG cell, during a 10-min time-lapse sequence. Scale bar, 20 µm. Right: Rose plot from the cell shown on the left, depicting the angular distribution of the fusion events relative to the cell centroid. (D) Quantification, from U87 MG cells displaying clear polarization with unique and large lamellipodia (n = 11 cells), of the number of fusion events occurring at a distance inferior (R1 region) or superior (R2 region) to 10 µm from the leading edge. For each cell, data were normalized to the areas of the respective regions. Data represent means and SEM. (E) Left: Map of all observed (n = 40) ATG9A-pHluorin fusion events from a representative, nonpolarized U87 MG cell, during a 10-min time-lapse sequence. Scale bar, 20 µm. Right: Rose plot from the cell shown on the left, depicting the angular distribution of the fusion events relative to the cell centroid. (F) Left: Representative U87 MG cell with projections of all observed ATG9A-pHluorin fusion events, during 1-min time-lapse sequences, before (−EGF) and 2-min after (+EGF) treatment with EGF (50 ng/ml). Scale bar, 20 µm. Right: Quantification of the effect of EGF, as depicted on the left, on the number ATG9A-pHluorin fusion events (n = 23 cells from three independent experiments; cells from independent experiments were color-coded). Statistical significance was evaluated using Mann–Whitney U test (D), paired t test (F), and Rayleigh test for fusion events distribution (C and E). ***, P < 0.001.
Figure S3.
Figure S3.
ATG9A-pHluorin signal at the cell periphery correlates with protrusive activity. (A) Time-lapse TIRF images of a U87 MG cell expressing ATG9A-pHluorin. The development of a large cell protrusion correlates with the appearance of a marked pHluorin signal at the leading edge. A magnified image of the leading edge (dashed rectangle) is presented in the lower right and shows numerous ATG9A-pHluorin positive vesicles (arrowhead). Scale bar, 20 µm; magnified view, 10 µm. (B) Left: TIRF image extracted from a time-lapse sequence of a U87 MG cell expressing ATG9A-pHluorin. Scale bar, 20 µm. Right: Kymographs were made from 10-pixel-wide lines (L1 and L2) indicated in the left image. The scale bars in the kymograph are 5 µm (horizontal) and 10 min (vertical). A clear ATG9A-pHluorin signal was observed near the cell edge during the formation of protrusions (arrowheads). The signal sharply decreased during protrusion collapses. (C) TIRF image of a U87 MG cell expressing mKate2 (red) and ATG9A-pHluorin (green). The mKate2 protein, diffusely expressed in the cytosol, was used to precisely delineate the cell edges. Scale bar, 20 µm. (D) Time-lapse montage of ROI 1 and ROI 2 shown in C. For each time-lapse, time 0 represents the time of appearance of ATG9A-pHluorin–positive vesicles (arrows) near to the cell edge. The position of the cell edge before the appearance of the ATG9A-pHluorin signal is marked by a dashed line. Scale bar, 5 µm. (E) Displacements of the cell edges shown in ROI 1 and 2 were plotted against time. The position of the cell edge 1 min before the appearance of the ATG9A-pHluorin signal was set at 0, and positive values in the y axis represent cell protrusion.
Figure S4.
Figure S4.
ATG9A protein regulates delivery of TGN46-positive post-Golgi carriers to cell protrusions. (A) Left: Representative U87 MG cell expressing ATG9A-mCherry (red) and colabeled for TGN46 (green) and nuclei (DAPI labeling, blue). Scale bar, 20 µm. Right: Magnified views of the cell presented on the left. Note that ATG9A colocalizes with TGN46 in typical TGN cisternae (upper panels) and at the cell membrane or vesicles close to the cell membrane (lower panels). Scale bar for magnified views, 5 µm. (B–E) Chemotactic stimulation induces redistribution of TGN46 and ATG9A-mCherry toward the cell membrane. (B) U87 MG cells expressing ATG9A-mCherry were starved (30 min) in serum-free medium and incubated (30 min) with or without EGF (50 ng/ml), as indicated. Cells were fixed and labeled for TGN46 (green) and nuclei (DAPI labeling, blue). Scale bar, 20 µm. (C) Quantification from images shown in B of the TGN46 and ATG9A-mCherry signals located in protrusions. For each cell, values correspond to the cumulated signal of all protrusions. (D) Quantification from images shown in B of the TGN46 and ATG9A-mCherry signals located in the perinuclear area. Data represent means ± SEM (n = 68 cells per group; cells from independent experiments were color-coded). (E) Cell-to-cell correlation between TGN46 and ATG9A-mCherry signals located in cell protrusions, in both untreated (black dots) and EGF-treated (red dots) cells. (F–H) EGF-induced redistribution of TGN46 to the cell protrusions depends on ATG9A. (F) U87 MG cells were transfected with nontargeting siRNA (siCont) or one of the two siRNA targeting ATG9A (siATG9A #1, siATG9A #2). Transfected cells were starved (30 min) in serum-free medium and incubated (30 min) with or without EGF (50 ng/ml), as indicated. Cells were fixed and labeled for TGN46 (green) and nuclei (DAPI labeling, blue). Scale bar, 20 µm. (G) Quantification from images shown in F of the TGN46 signal located in protrusions. (H) Quantification from images shown in F of the TGN46 signal located in the perinuclear area. Data represent means ± SEM (n = 104–113 cells per group; cells from independent experiments were color-coded). (I) Detection (left) and quantification (right), from cells treated as in F, of the number of cytosolic TGN46-positive vesicles. Data represent means ± SEM (n = 99–112 cells per group; cells from independent experiments were color-coded). Statistical significance was evaluated using Mann–Whitney U test (C and D), one-way ANOVA followed by Tukey post hoc test (G and I), or one-way ANOVA followed by Sidak post hoc test (H), **, P < 0.01; ***, P < 0.001.
Figure 5.
Figure 5.
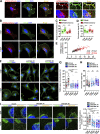
ATG9A protein regulates delivery of β1 integrin to cell protrusions. (A) U87 MG cells expressing ATG9A-mCherry were labeled for β1 integrin (green), TGN46 (white), and nuclei (DAPI labeling, blue). Scale bar, 20 µm. Note, from the magnified views on the right panels, that ATG9A-mCherry, β1 integrin, and TGN46 signals partially colocalize in tubular or vesicular structures (arrowheads) near the cell membrane or in the perinuclear area. Scale bar for magnified views, 6 µm. (B) U87 MG cells were transfected with nontargeting siRNA (siCont) or one of the two siRNAs targeting ATG9A (siATG9A #1, siATG9A #2). Transfected cells were starved (30 min) in serum-free medium, incubated (30 min) with or without EGF (50 ng/ml), fixed, and labeled for β1 integrin. Upper images: β1 integrin immunoreactive signal (false-color scale) in representative fields of each experimental group. Scale bar, 20 µm. Middle images: Polar distribution of the β1 integrin immunoreactive signal (false-color scale; Clock Scan plug-in) from the cell marked by an asterisk in the upper image. Lower panels: Radial intensity profile of the β1 integrin signal, from the cell centroid to the cell edge (Clock Scan plug-in). For each experimental group, profiles were normalized and averaged from 76–98 cells per group (two independent experiments). (C) Measurement of peripheral β1 integrin signal (signal located in the 80–100% interval of the cell radius, normalized to the total signal) from images shown in B. Cells from independent experiments were color-coded. (D) Validation of ATG5 knockdown. Western blot analysis of ATG5 protein levels from U87 MG cells transfected with nontargeting siRNA (siCont) or one of the two siRNAs targeting ATG5 (siATG5 #1, siATG5 #2). MM, molecular mass. Asterisk, nonspecific band. (E) U87 MG cells transfected with nontargeting siRNA (siCont) or one of the two siRNAs targeting ATG5 (siATG5 #1, siATG5 #2) were incubated with or without EGF, and distribution of the β1 integrin immunoreactive signal was analyzed and presented as in B. For each experimental group, profiles were normalized and averaged from 85–103 cells per group (two independent experiments). Scale bar, 20 µm. (F) Measurement of peripheral β1 integrin signal (signal located in the 80–100% interval of the cell radius, normalized to the total signal) from images shown in E. Cells from independent experiments were color-coded. Data represent means and SEM. Statistical significance was evaluated using one-way ANOVA followed by Tukey post hoc test (C and F). ***, P < 0.001.
Figure 6.
Figure 6.
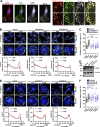
ATG9A regulates delivery of TGN46 and β1 integrin to the leading edge through its N-terminal AP sorting signal. (A) Left: Scheme depicting the topology of the ATG9A-mCherry fusion protein and the canonical AP sorting signal (8YQRLE12) located in the N-terminal cytosolic domain. Right: Scheme depicting the mutant ATG9A-mCherry protein, for which replacement of the critical tyrosine residue at position 8 by a phenylalanine abolishes AP binding (Zhou et al., 2017; Mattera et al., 2017). (B–E) Rescue experiments with wild-type and mutant ATG9A-mCherry proteins. (B) After depletion of endogenous ATG9A using interfering RNA (siATG9A #2), U87 MG cells were transfected with an empty vector, a vector encoding wild-type ATG9A-mCherry, or a vector encoding mutant ATG9A-mCherry Y8F. Transfected cells were starved (30 min) in serum-free medium and incubated (30 min) with or without EGF (50 ng/ml), as indicated. Cells were fixed and labeled for β1 integrin (green), TGN46 (white), and nuclei (DAPI, blue). Scale bar, 20 µm. (C) Quantification from images shown in B of the ATG9A-mCherry (wild-type or mutant) signal located in protrusions. (D) Quantification from images shown in B of the β1 integrin signal located in protrusions. (E) Quantification from images shown in B of the TGN46 signal located in protrusions. Data represent means and SEM (n = 60–63 cells per group; cells from independent experiments were color-coded). Statistical significance was evaluated using one-way ANOVA followed by Tukey post hoc test. ***, P < 0.001.
Figure 7.
Figure 7.
ATG9A protein regulates adhesion dynamics. (A–D) ATG9A depletion reduces intrinsic adhesion dynamics. (A) Representative live-cell TIRF images of U87 MG cells expressing PXN-EGFP together with the indicated siRNAs. Image sequences show adhesion changes over a 40-min period. Righthand panels: Color scale output generated from FAAS, representing early (blue) to late (red) adhesions. Scale bar, 20 µm. (B–D) FAAS output of the number of dynamic adhesions (B), assembling adhesions (C), and disassembling adhesions (D). Data represent means and SEM (siCont, n = 13 cells; siATG9A #2, n = 13 cells; from five independent experiments). (E) ATG9A depletion inhibits EGF-induced formation of adhesion complexes. U87 MG cells were transfected with the indicated siRNAs. After starvation (1 h) in serum-free DMEM, cells were treated (1 h) with or without EGF (50 ng/ml), fixed, and labeled with an anti-PXN antibody (green) and DAPI (nuclei, blue). The number of adhesion complexes was quantified for each cell. Data represent means and SEM (n = 144–158 cells per group; cells from independent experiments were color-coded). Scale bar, 20 µm; inset magnifications, 10 µm. Statistical significance was evaluated using Mann–Whitney U test (B–D) or one-way ANOVA followed by Sidak post hoc test (E). **, P < 0.01; ***, P < 0.001.
Figure S5.
Figure S5.
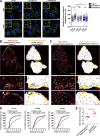
AT9A regulates the formation of adhesion complexes in HeLa cells. (A) Depletion of ATG9A protein inhibits EGF-induced formation of adhesion complexes in HeLa cells. HeLa cells were transfected with nontargeting siRNA (siCont) or one of the two siRNAs targeting ATG9A (siATG9A #1, siATG9A #2). After starvation (1 h) in serum-free medium, cells were treated (1 h) with or without EGF (50 ng/ml), fixed, and labeled with an anti-PXN antibody (green) and nuclei (DAPI labeling, blue). The number of adhesion complexes was quantified for each cell. Data represent means ± SEM (n = 125–131 cells per group; cells from independent experiments were color-coded). Scale bar, 20 µm; inset magnification, 10 µm. Statistical significance was evaluated using one-way ANOVA followed by Sidak post hoc test. ***, P < 0.001. (B–E) ATG9A-positive vesicles target adhesion sites in HeLa cells. HeLa cells expressing PXN-mCherry and ATG9A-pHluorin were recorded using live-cell TIRF microscopy. (B) Left: Distribution of all observed ATG9A-pHluorin fusion events during the recording period (crosses), overlaid on the PXN-mCherry signal (red). Right: Derived synthetic image depicting the ventral cell surface area (white), the PXN-positive adhesion complexes (orange, automated detection using ImageJ), and the ATG9A-pHluorin fusion events (crosses). Note the promiscuity between the adhesion complexes and the fusion events in the magnified view. Scale bar, 20 µm; magnified views, 5 µm. (C) Left: Map of randomly simulated fusion events (crosses), overlaid on the PXN-mCherry signal (red). Right: Derived synthetic image depicting the ventral cell surface area (white), the PXN-positive adhesion complexes (orange) and the simulated fusion events (crosses). Scale bar, 20 µm; magnified views, 5 µm. (D) Cumulative frequency charts, from the cells shown in B (cell #1 and cell #2) and one other representative cell (cell #3), demonstrating the difference in distance to focal adhesions (FA) between real ATG9A-pHluorin fusion events (black line) and simulated events (red line). (E) Quantification of the mean distance to the centroid of closest focal adhesion for real ATG9A-pHluorin events or simulated events (n = 8 cells, for a total number of 1,297 events). Data represent means ± SEM. Statistical significance was evaluated using one-way ANOVA followed by Sidak post hoc test (A) and Mann–Whitney U test (E). ***, P < 0.001.
Figure 8.
Figure 8.
ATG9A-positive vesicles target adhesion sites. U87 MG cells expressing PXN-mCherry and ATG9A-pHluorin were recorded using live-cell TIRF microscopy. (A) Left: Distribution of all observed ATG9A-pHluorin fusion events during the recording period (crosses), overlaid on the PXN-mCherry signal (red). Right: Derived synthetic image depicting the ventral cell surface area (white), the PXN-positive adhesion complexes (orange, automated detection using ImageJ), and the ATG9A-pHluorin fusion events (crosses). Scale bar, 20 µm; magnified views, 10 µm. (B) Left: Map of randomly simulated fusion events (crosses), overlaid on the PXN-mCherry signal (red). Right: Derived synthetic image depicting the ventral cell surface area (white), the PXN-positive adhesion complexes (orange), and the simulated fusion events (crosses). Scale bar, 20 µm; magnified views, 10 µm. (C) Cumulative frequency charts, from the cell shown in A (cell #1) and two other representative cells (cells #2 and #3), demonstrating the difference in distance to focal adhesions (FA) between real ATG9A-pHluorin fusion events (black line) and simulated events (red line). (D) Quantification of the mean distance to the centroid of closest focal adhesion for real ATG9A-pHluorin events or simulated events (n = 8 cells, for a total number of 365 events). Statistical significance was evaluated using Mann–Whitney U test. ***, P < 0.001.

Similar articles

Cited by

References

    1. Abdul Rahim, S.A., Dirkse A., Oudin A., Schuster A., Bohler J., Barthelemy V., Muller A., Vallar L., Janji B., Golebiewska A., and Niclou S.P.. 2017. Regulation of hypoxia-induced autophagy in glioblastoma involves ATG9A. Br. J. Cancer. 117:813–825. 10.1038/bjc.2017.263 - DOI - PMC - PubMed
    1. Adelmann-Grill, B.C., Wach F., Cully Z., Hein R., and Krieg T.. 1990. Chemotactic migration of normal dermal fibroblasts towards epidermal growth factor and its modulation by platelet-derived growth factor and transforming growth factor-beta. Eur. J. Cell Biol. 51:322–326. - PubMed
    1. Alabi, A.A., and Tsien R.W.. 2013. Perspectives on kiss-and-run: Role in exocytosis, endocytosis, and neurotransmission. Annu. Rev. Physiol. 75:393–422. 10.1146/annurev-physiol-020911-153305 - DOI - PubMed
    1. Banting, G., and Ponnambalam S.. 1997. TGN38 and its orthologues: Roles in post-TGN vesicle formation and maintenance of TGN morphology. Biochim. Biophys. Acta Mol. Cell Res. 1355:209–217. 10.1016/S0167-4889(96)00146-2 - DOI - PubMed
    1. Berginski, M.E., Vitriol E.A., Hahn K.M., and Gomez S.M.. 2011. High-resolution quantification of focal adhesion spatiotemporal dynamics in living cells. PLoS One. 6:e22025. 10.1371/journal.pone.0022025 - DOI - PMC - PubMed

Publication types