Review
. 2022 Mar 23;122(6):6719-6748.
doi: 10.1021/acs.chemrev.1c00774. Epub 2022 Feb 18.

Conformational Dynamics of Intrinsically Disordered Proteins Regulate Biomolecular Condensate Chemistry

Affiliations
Review

Conformational Dynamics of Intrinsically Disordered Proteins Regulate Biomolecular Condensate Chemistry

Anton Abyzov et al. Chem Rev. .

Abstract

Motions in biomolecules are critical for biochemical reactions. In cells, many biochemical reactions are executed inside of biomolecular condensates formed by ultradynamic intrinsically disordered proteins. A deep understanding of the conformational dynamics of intrinsically disordered proteins in biomolecular condensates is therefore of utmost importance but is complicated by diverse obstacles. Here we review emerging data on the motions of intrinsically disordered proteins inside of liquidlike condensates. We discuss how liquid-liquid phase separation modulates internal motions across a wide range of time and length scales. We further highlight the importance of intermolecular interactions that not only drive liquid-liquid phase separation but appear as key determinants for changes in biomolecular motions and the aging of condensates in human diseases. The review provides a framework for future studies to reveal the conformational dynamics of intrinsically disordered proteins in the regulation of biomolecular condensate chemistry.


Conflict of interest statement

The authors declare no competing financial interest.

Figures

Figure 1
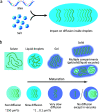
Figure 1
Liquid–liquid phase separation of intrinsically disordered proteins into liquidlike droplets and condensates. (a) Schematic representation of LLPS of IDPs. (b) Fluorescence micrograph of liquidlike droplets of the intrinsically disordered protein tau, which plays an important role in Alzheimer’s disease. In the interior of the droplets, the concentration of tau is very high. Fluorescence micrograph courtesy of Dr. Adriana Savastano [German Center for Neurodegenerative Diseases (DZNE)].
Figure 2
Figure 2
Translational diffusion in FUS LC droplets. Left panel: differential interference contrast (upper row) and fluorescence images of FUS LC droplets (lower row) before and after photobleaching. Droplets contained 0.01% FUS LC labeled with Alexa-488 at residue 86 mutated to cysteine. A 2.5 μm region inside an ∼8 μm diameter droplet was bleached. Right panel: fluorescence recovery curve after photobleaching and halftime of signal recovery. Reprinted with permission from Molecular Cell, Volume 60, Issue 2, Burke, K. A.; Janke, A. M.; Rhine, C. L.; Fawzi, N. L. Residue-by-Residue View of In Vitro FUS Granules that Bind the C-Terminal Domain of RNA Polymerase II, pages 231–241 (ref (83)). Copyright 2015 Elsevier.
Figure 3
Figure 3
Variations in translational diffusion inside droplets due to the presence of cofactors and maturation. (a) Cofactors, such as RNA and salt, can slow down or speed up the diffusion inside droplets. (b) Translational diffusion inside droplets is attenuated when compared to the protein in the bulk solute and is further restricted upon maturation of droplets into gel-like and solid states. In some cases, multiple compartments appear in droplets upon maturation, i.e., vacuoles containing protein in the liquid state with fast diffusion, that are surrounded by the protein in the gel or even the solid-like phase.
Figure 4
Figure 4
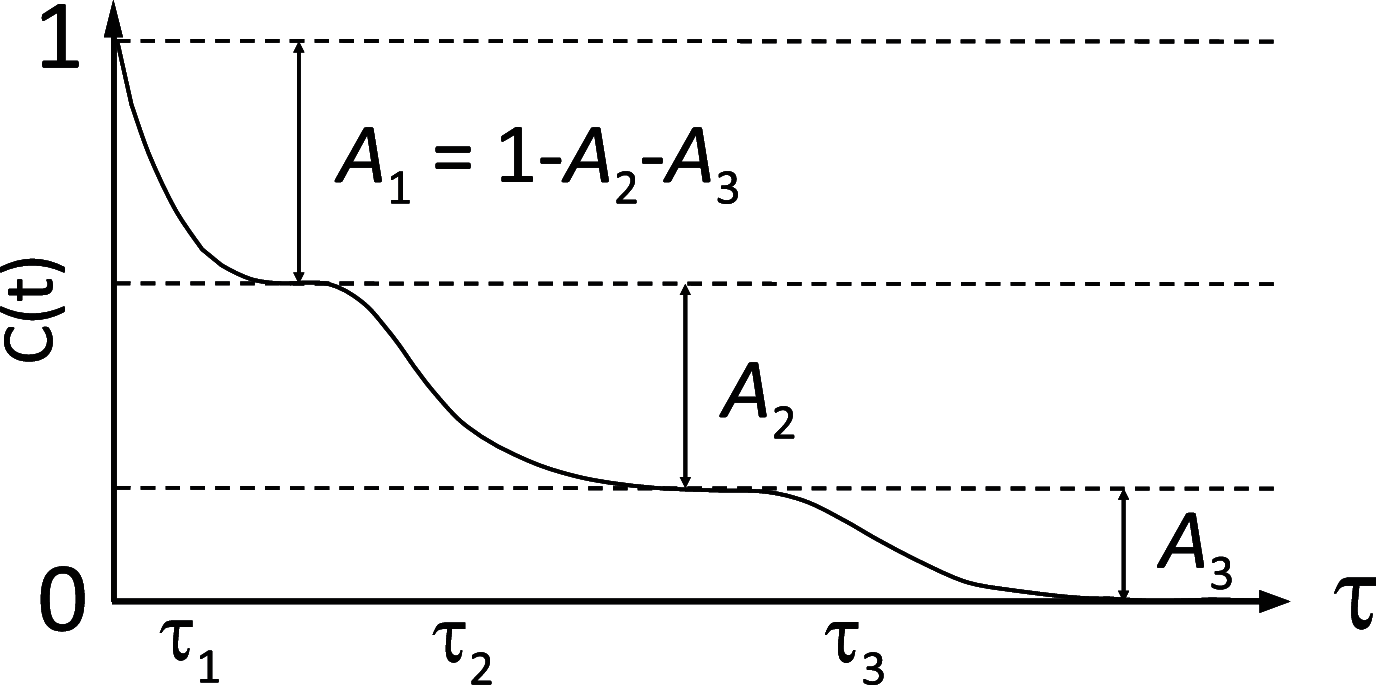
Approximation of the autocorrelation function of IDPs with three exponential components. The fastest component starts at the origin of the correlation function, where it is equal to 1.0. The intermediate and slow components start at lower levels defined by the exponential decay of the previous, faster mode. The sum of the three contributions is equal to 1.0. For example, if the intermediate motional mode has a big amplitude, its contribution to relaxation (A2) will be large. The slow component will therefore start from a level that is already close to zero (A3 = 1 – A2A1) and the sensitivity of the whole correlation function to slow motions will be decreased.
Figure 5
Figure 5
Physical origin of picosecond-to-nanosecond time scale motions in IDPs. The fastest mode reports on the librational motions of the 15N–1H bond vector, the intermediate mode reports on the local backbone dihedral angle sampling, and the slow mode reports on the chain motions., Adapted with permission from the Journal of American Chemical Society, Volume 138, Issue 19, Abyzov, A.; Salvi, N.; Schneider, R.; Maurin, D.; Ruigrok, R. W. H.; Jensen, M. R.; Blackledge, M. Identification of Dynamic Modes in an Intrinsically Disordered Protein Using Temperature-Dependent NMR Relaxation, pages 6240–6251 (ref (135)). Copyright 2016 American Chemical Society.
Figure 6
Figure 6
IDP chain motions probed by NMR relaxometry. (a) Protein proton relaxation rates are dependent on IDP chain length. Collective rates of a 30-residue N-terminal fragment of α-synuclein (red squares) and of 441-residue human tau protein htau40 (blue diamonds). The fit with one correlation time for htau40 is shown as a dotted line and with two correlation times as a solid line. (b) τR values predicted by HYCUD for the 441-residue htau40 protein. An atomic effective radius (AER) of 3.3 Å was used. Blue line with diamonds: τR values predicted for different 14-residue fragments. Dashed blue line and blue box: τR averaged over all fragments and standard deviation of the average value. Dashed red line and red box: τR calculated from relaxation dispersion data and standard deviation of the average value. HYCUD predicts a bell-shaped sequence profile of τR values, with the average predicted τR value matching that obtained experimentally. Adapted with permission from ref (128). Copyright 2014 American Chemical Society.
Figure 7
Figure 7
Variants of fluorescence correlation spectroscopy. PET-FCS (left panel) probes chain conformational dynamics through the contact (distance <10 Å) formation rate between a fluorophore and a quencher (typically, an aromatic residue or another dye). FRET-FCS (middle panel) describes chain conformational dynamics by correlating the intensities of donor and acceptor fluorophores. Depending on the distance between dyes (should be in the 10–100 Å range), FRET between donor and acceptor dyes occurs more or less efficiently, and we observe acceptor instead of donor fluorescence. Polarization-resolved FCS (Pol-FCS, right panel) probes chain reorientational dynamics by correlating donor fluorescence after excitation by polarized light. The efficiency of photon absorption by the donor depends on its orientation relative to the light polarization direction.
Figure 8
Figure 8
Chain dynamics of the disordered N-terminal TAD domain of p53 probed by PET-FCS. (a) Sequence of the N-terminal TAD domain of p53. Color bars: four regions (“loops”), of which the dynamics were probed. Each loop contains a tryptophan on one end and a fluorescent dye on the other end. The first two loops (13–23 and 23–31) comprise the MDM2 binding site. (b) Rates of loop closure for each loop, in free p53-TAD (darker colors) or with bound MDM2 (lighter colors). The number of kinetic components varied depending on the loop and was influenced by MDM2 binding. Adapted with permission from ref (156). Copyright 2011 American Chemical Society.
Figure 9
Figure 9
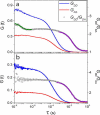
FRET-FCS fluorescence correlation curves describing dynamics of the disordered cyclin-dependent kinase inhibitor Sic1 in Tris buffer (a), pH 7.4, and in Milli-Q water (b). The green line indicates an exponential decay fit in the nanosecond range; purple lines in the millisecond range. Adapted with permission from the Journal of Physical Chemistry B, Volume 118, Issue 15, Liu, B.; Chia, D.; Csizmok, V.; Farber, P.; Forman-Kay, J. D.; Gradinaru, C. C. The Effect of Intrachain Electrostatic Repulsion on Conformational Disorder and Dynamics of the Sic1 Protein, pages 4088–4097 (ref (157)). Copyright 2014 American Chemical Society.
Figure 10
Figure 10
IDP dynamics probed in living cells by nsFCS. (a) Illustration of a HeLa cell with injected fluorescently labeled ProTα. (b) Relative diffusion times (τd) and (c) relative τr values obtained in buffer, in HeLa cells cytosol without and with hyperosmotic stress. The fence indicates the total range of τr values, the white line indicates the median value, the black line indicates the mean value, and the colored box indicates the range between the first and the third quartile. The statistical significance of differences between mean values was verified by the Kolmogorow–Smirnow test (**P < 0.01, ***P < 0.001). Adapted with permission from ref (113). Copyright 2021 John Wiley & Sons.
Figure 11
Figure 11
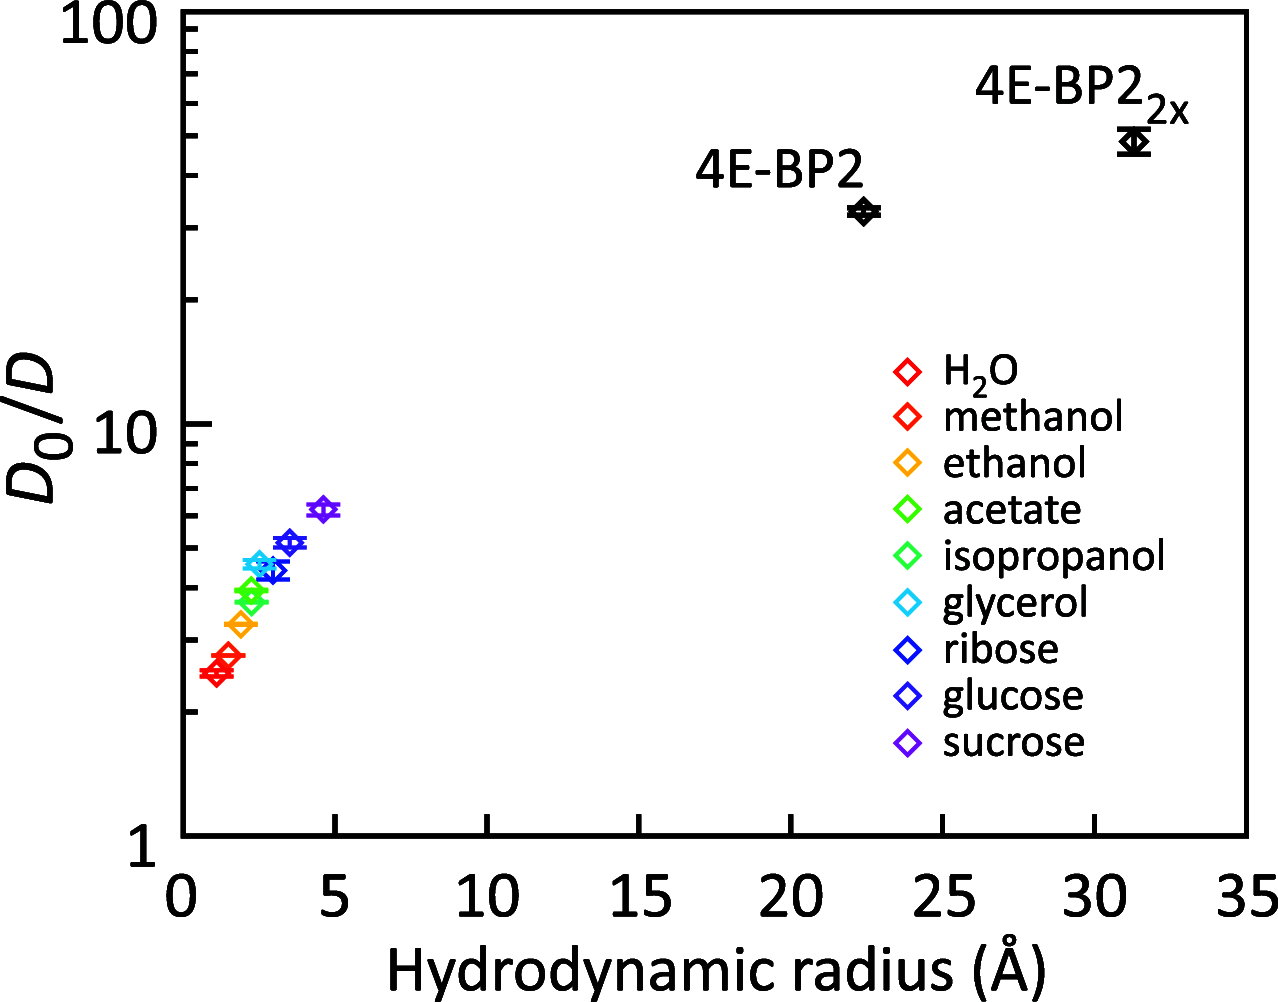
Slowing of translational diffusion of probes of different size in Ddx4 condensates relative to the buffer.D0 is the translational diffusion coefficient in the buffer and D the diffusion coefficient in the Ddx4 condensate. The D0/D ratio increases with probe size, indicating a length scale dependency of condensate viscosity. Adapted with permission from ref (81). Copyright 2017 National Academy of Sciences under CC-BY license.
Figure 12
Figure 12
Changes in 15N spin relaxation rates in the FUS LC domain upon LLPS. (a) Amino acid composition of the FUS LC domain. Residues were categorized by their structural tendencies according to ref (173). (b) Cartoon representation of the condensate of the FUS LC domain in an NMR tube. (c) Residue-specific R2 and R1 rates as well as 15N–1H heteronuclear NOE values in the phase-separated (red) and dispersed (blue) state at 25 °C, 19.98 T. LLPS-induced changes in the 15N spin relaxation rates are consistent with slower local backbone sampling and chain dynamics inside the condensate. Figure 12c was adapted with permission from ref (83). Copyright 2015 Elsevier Inc.
Figure 13
Figure 13
Changes in 15N spin relaxation rates in the LC domain of hnRNPA2 upon LLPS. (a,b) Amino acid composition of the LC domain of hnRNPA2. Residue structural tendencies reported as in ref (173). (c) Residue-specific R2 and R1 rates as well as 15N–1H heteronuclear NOE values in the LC domain of hnRNPA2 in the phase-separated (red) and dispersed (blue) states at 65 °C, 19.98 T. Measured values are consistent with slower local backbone sampling in the condensate. However, the R2 relaxation rate values, which were measured at 65 °C, are likely influenced by the fast amide hydrogen exchange at this high temperature, i.e., they do not exclusively report on IDP dynamics. Figure 13c was adapted with permission from ref (84). Copyright 2018 Elsevier.
Figure 14
Figure 14
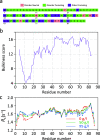
15N R1 relaxation in the intrinsically disordered N-terminal domain of MKK4. (a) Amino acid sequence of the N-terminal domain of MKK4. Amino acid-specific structural tendencies reported as in ref (173). (b) Amino acid bulkiness along the sequence (calculated with a window size of seven residues). (c) Residue-specific R1 relaxation rates at different concentrations of the molecular crowding agent dextran (in mg/mL). Adapted with permission from ref (172). Copyright 2019 American Chemical Society. R1 rates increase with viscosity for the highly flexible N-terminal region (first ∼25 residues) but decrease for residues 55–80.
Figure 15
Figure 15
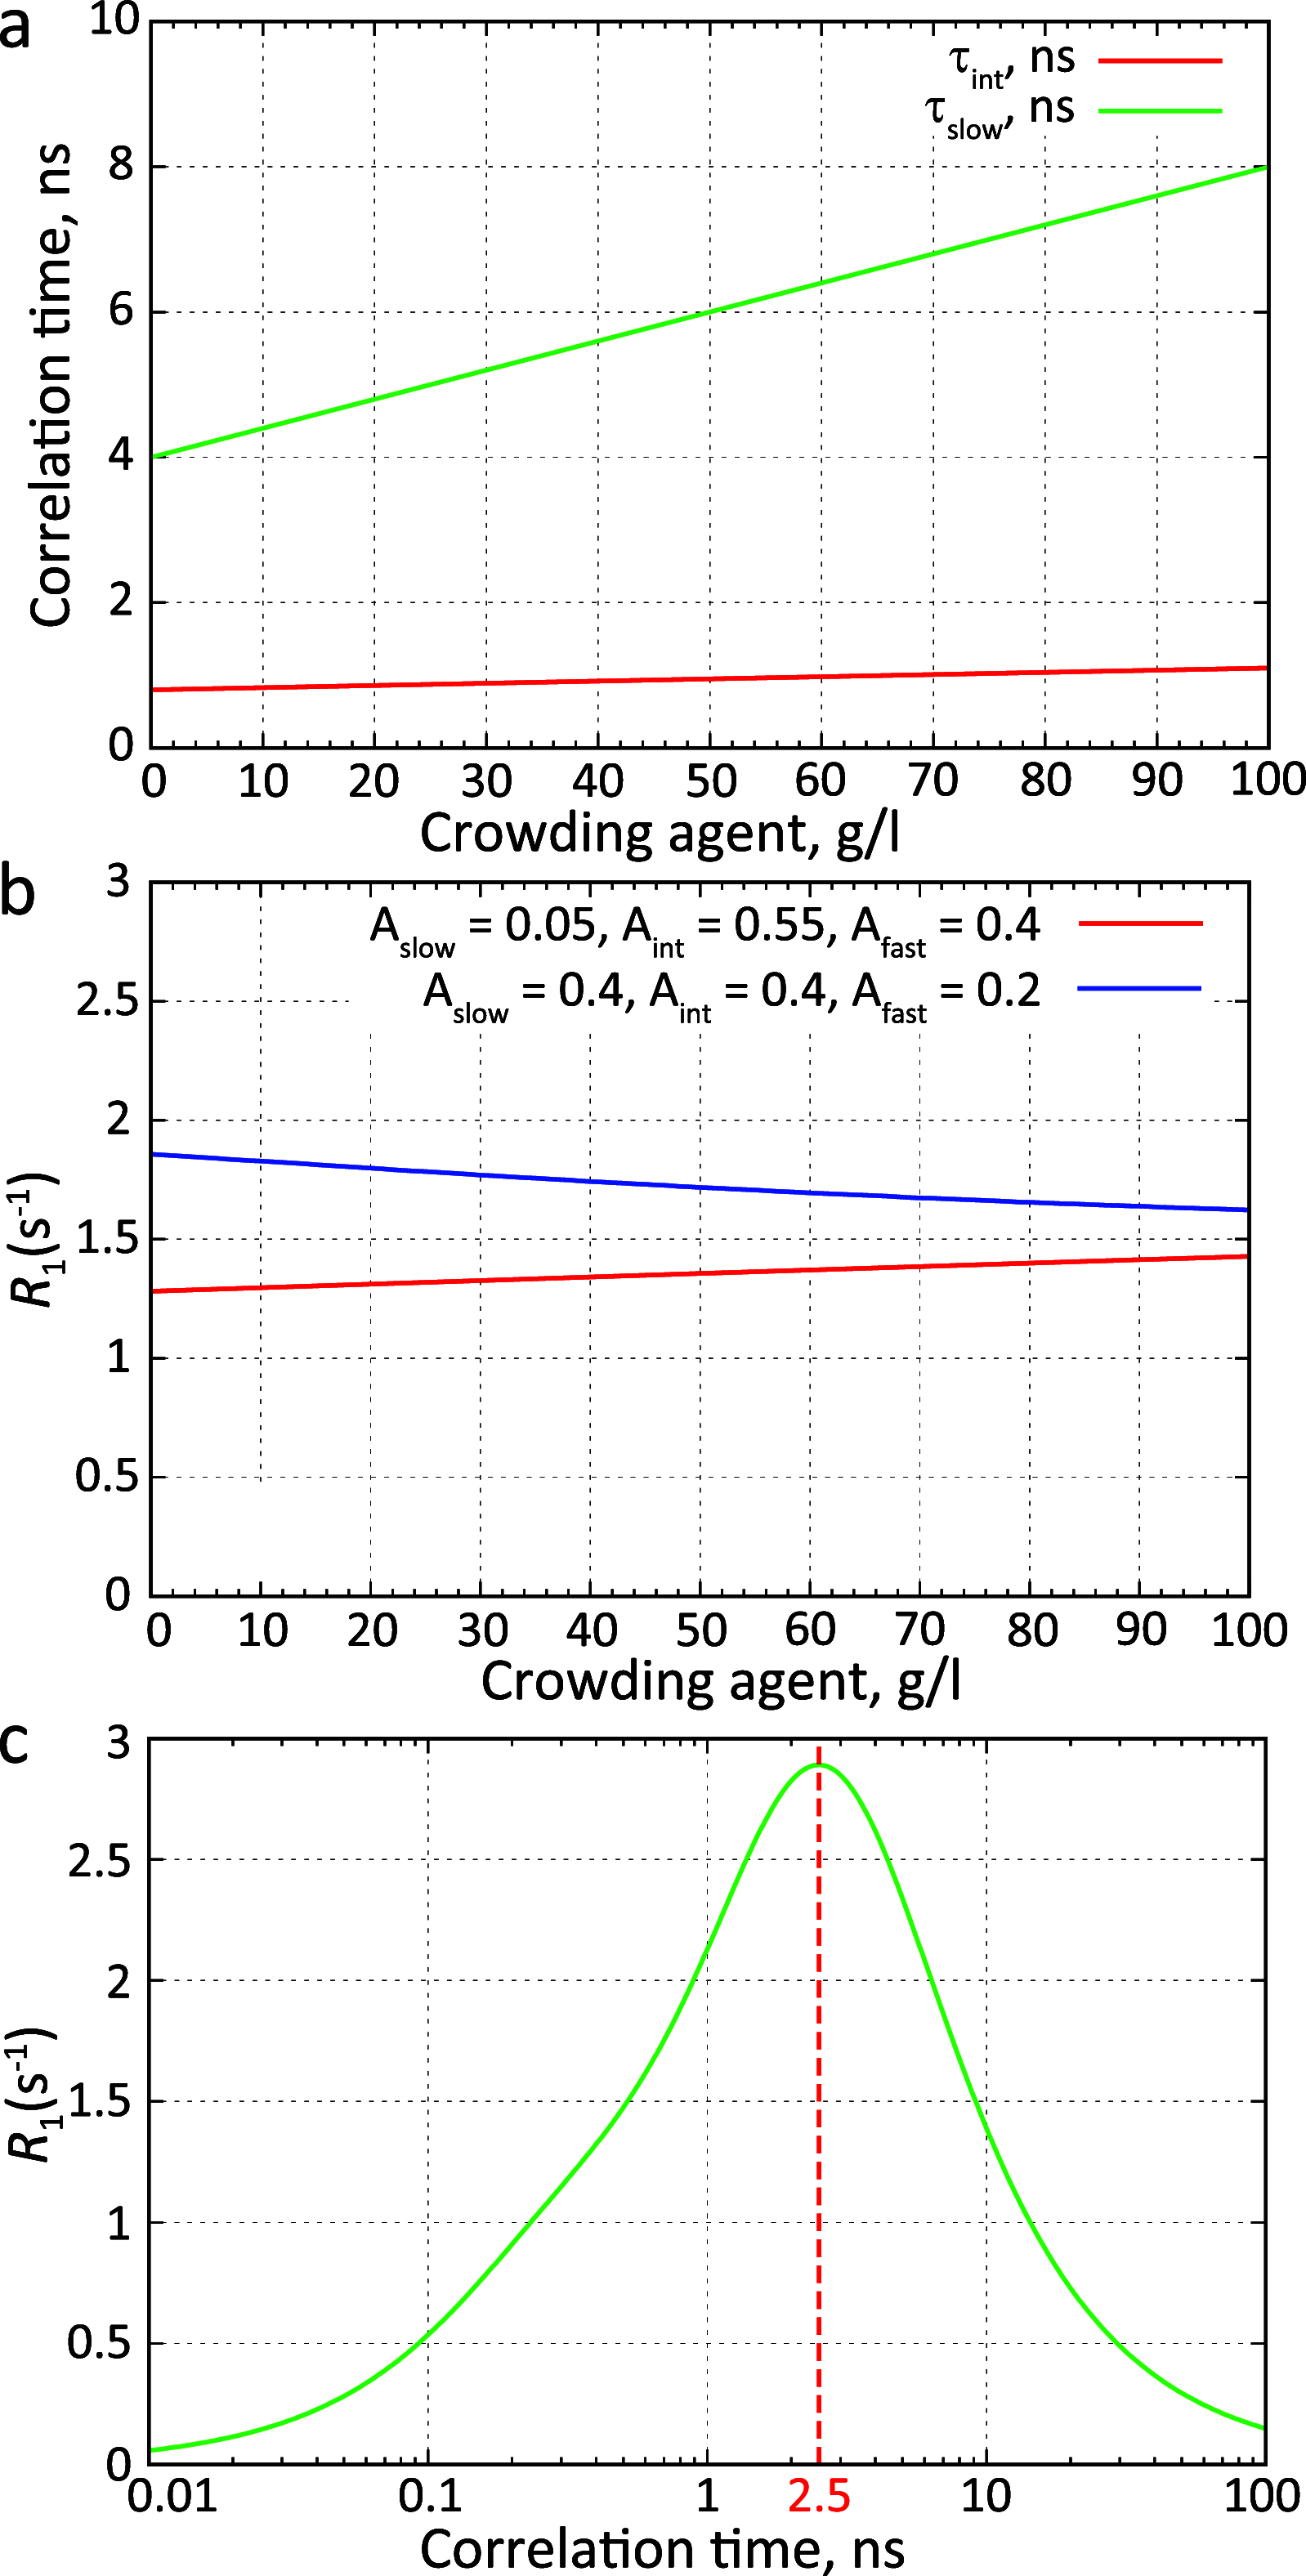
Crowding, chain flexibility, and R1 spin relaxation. (a) Dependence of motional modes on the concentration of a crowding agent. The intermediate component with the characteristic time τint is characteristic for local backbone motions. Slower chain motions are represented by the motional component with the correlation time τslow. (b) R1 spin relaxation rates at different concentrations of a crowding agent for more rigid (blue) or more flexible IDP chains (red). Relaxation rates were calculated using an autocorrelation function modeled as a sum of three exponentially decaying components (Figure 4 and eqs 1 and 7 in ref (135)). (c) Dependence of the R1 spin relaxation rate on the correlation time. For fast correlation times, the R1 rate increases, reaches a maximum at ≈2.5 ns, and decreases for slower correlation times. The relaxation rate was calculated using an autocorrelation function with a single exponentially decaying component. The field was 14.1 T. The correlation time of the fastest component (τfast) was set to 50 ps; the chemical shift anisotropy tensor was axially symmetric with anisotropy σ – σ = −170 ppm; the N–H internuclear distance was 1.02 Å.
Figure 16
Figure 16
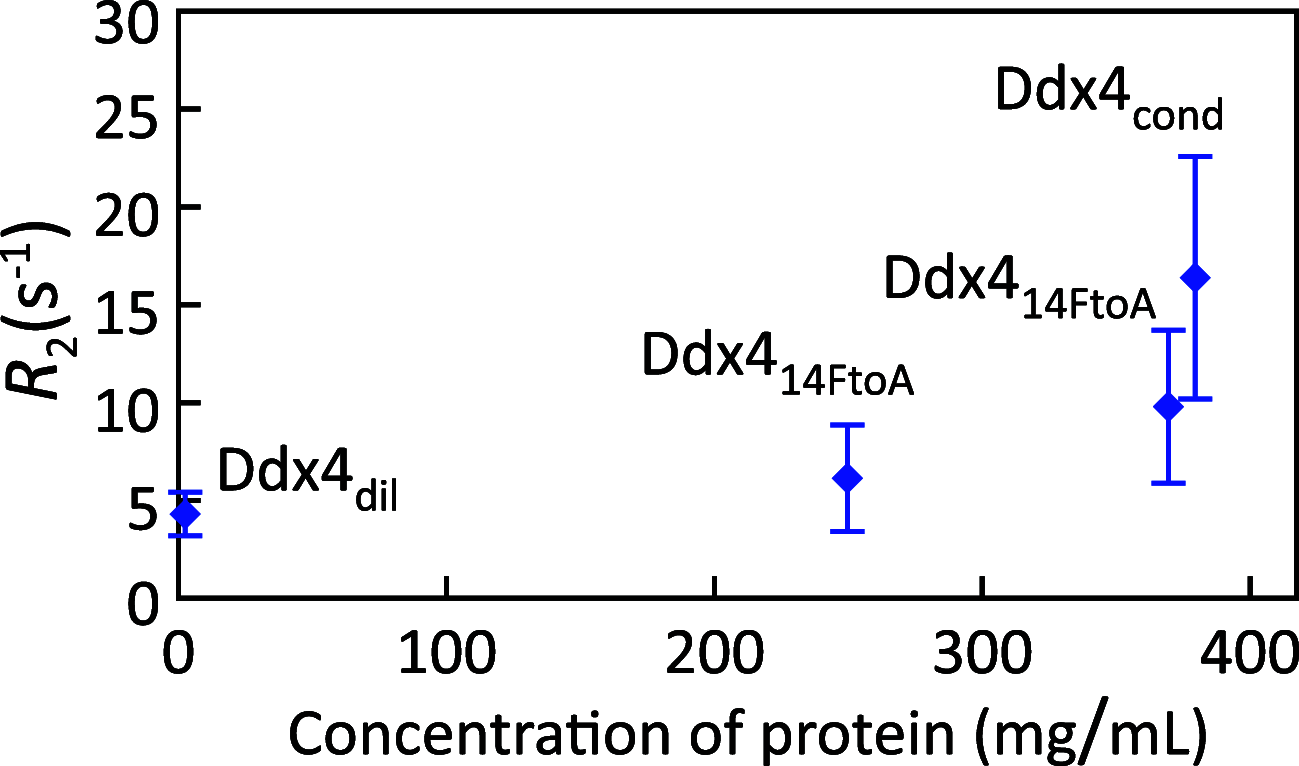
15N R2 relaxation rates in the intrinsically disordered N-terminal domain of Ddx4, in the dilute phase (Ddx4dil) and in the condensed phase (Ddx4cond). To mimic the high condensate viscosity, a mutant of Ddx4 (Ddx414FtoA) was created, in which 14 phenylalanine residues were mutated to alanine. This mutant can reach concentrations close to those observed inside the condensate (380 mg/mL) but does not phase separate. Relaxation rates were measured in Ddx414FtoA concentrated to 250 and 370 mg/mL (concentrations determined from absorption at 280 nm). The difference in R2 values observed for Ddx414FtoA at 370 mg/mL and Ddx4cond at 380 mg/mL were attributed to the influence of intermolecular contacts in Ddx4cond that mediate phase separation.
Figure 17
Figure 17
Cartoon representation of a protein chain illustrating the stickers-and-spacers model. Some residues or groups of residues, which are often aromatic or contain aromatic residues and facilitate cross-linking between different protein molecules in condensates, act as “stickers”. Residues between “stickers” are called “spacers”, which modulate the formation of the contacts between “stickers”.
Figure 18
Figure 18
IDP dynamics probed by fluorescence anisotropy and electron paramagnetic resonance (EPR) spectroscopy. (a) Cartoon representation of a MTSL nitroxide spin label used in EPR spectroscopy (left) and of a fluorescein fluorophore (right) used in fluorescence anisotropy measurements. Both methods measure the dynamics of the probe covalently attached to an IDP chain, and its own rotational mobility relative to IDP backbone may contribute to the apparent dynamic parameters of the IDP chain. (b) Fluorescence anisotropy decay curves in the solution of monomeric human tau K18 (0 h) and in droplets 48 h and 72 h after phase separation (left panel). Correlation times of slow and fast components and the amplitude of the fast component obtained by a biexponential fit of decay curves (right panel). Reprinted with permission from the Journal of Physical Chemistry Letters, Volume 10, Issue 14, Majumdar, A.; Dogra, P.; Maity, S.; Mukhopadhyay, S. Liquid–Liquid Phase Separation Is Driven by Large-Scale Conformational Unwinding and Fluctuations of Intrinsically Disordered Protein Molecules, pages 3929–3936 (ref (87)). Copyright 2019 American Chemical Society.
Figure 19
Figure 19
Dynamics in the tau fragment Δtau187 probed by continuous-wave EPR spectroscopy. (a) X-band continuous wave EPR spectra measured in monomeric Δtau187 solution and in the condensate formed by complex coacervation of Δtau187 with RNA (tau187-RNA CC) at different times of incubation at room temperature. Measured EPR profiles (solid line) were fitted with single-component simulation (dashed line). (b) Rotational correlation times obtained from EPR simulations. Adapted from ref (191) under the terms of the CC-BY 4.0 license.
Figure 20
Figure 20
Conformational exchange between the ground state and an excited state of Ddx4 in a condensate. χ2 values of pE (excited state population) and kex (exchange rate) fit of R relaxation dispersion profiles. Optimal values (pE = 29.7%, kex = 17.7 s–1) are indicated by the white circle. Reprinted with permission from the Journal of the American Chemical Society, Volume 140, Issue 6, Yuwen, T.; Brady, J. P.; Kay, L. E. Probing Conformational Exchange in Weakly Interacting, Slowly Exchanging Protein Systems via Off-Resonance R Experiments: Application to Studies of Protein Phase Separation, pages 2115–2126 (ref (89)). Copyright 2018 American Chemical Society.
Figure 21
Figure 21
Molecular dynamics simulations of the phase-separated FUS LC. Adapted with permission from ref (233). Copyright 2020 American Chemical Society. (a) Simulated (in all-atom simulation) and experimentally determined density profiles of FUS LC. (b) Simulated (in all-atom simulation) protein self-diffusion coefficient of FUS LC in the slab along the z-axis as a function of the lag time. The dashed line indicates the experimentally determined value.
Figure 22
Figure 22
Physico-chemistry of the environment inside membraneless compartments influences IDP dynamics and biochemical reactions with their partners. (a) Molecular crowding and intermolecular interactions that promote liquid–liquid phase separations are expected to slow IDP chain motions in condensates. (b) The free energy landscape of the coupled folding and binding in IDPs may be represented as a conformational funnel. Different interaction mechanisms, such as induced fit or conformational selection, can be seen as different trajectories along this energy landscape. The reaction can follow multiple trajectories simultaneously, with their relative weights being defined by the shape of the funnel, which may be altered inside membraneless compartments. The presence of macromolecular crowding was, for example, suggested to favor conformational selection-type interactions over induced fit-type interactions., Adapted in part from ref (60) under the terms of the CC-BY 4.0 license.

Similar articles

Cited by

References

    1. Alberts B.Molecular Biology of the Cell; Garland Science, 2017; pp 8–9.
    1. Alberti S.; Gladfelter A.; Mittag T. Considerations and Challenges in Studying Liquid-Liquid Phase Separation and Biomolecular Condensates. Cell 2019, 176, 419–434. 10.1016/j.cell.2018.12.035. - DOI - PMC - PubMed
    1. Nott T. J.; Craggs T. D.; Baldwin A. J. Membraneless Organelles Can Melt Nucleic Acid Duplexes and Act as Biomolecular Filters. Nat. Chem. 2016, 8, 569–575. 10.1038/nchem.2519. - DOI - PubMed
    1. Klein I. A.; Boija A.; Afeyan L. K.; Hawken S. W.; Fan M.; Dall’Agnese A.; Oksuz O.; Henninger J. E.; Shrinivas K.; Sabari B. R.; et al. Partitioning of Cancer Therapeutics in Nuclear Condensates. Science 2020, 368, 1386–1392. 10.1126/science.aaz4427. - DOI - PMC - PubMed
    1. Poudyal R. R.; Guth-Metzler R. M.; Veenis A. J.; Frankel E. A.; Keating C. D.; Bevilacqua P. C. Template-Directed RNA Polymerization and Enhanced Ribozyme Catalysis inside Membraneless Compartments Formed by Coacervates. Nat. Commun. 2019, 10, 490.10.1038/s41467-019-08353-4. - DOI - PMC - PubMed

Publication types

MeSH terms

Substances