. 2022 Feb 18;79(3):135.
doi: 10.1007/s00018-022-04129-0.

METTL3 promotes oxaliplatin resistance of gastric cancer CD133+ stem cells by promoting PARP1 mRNA stability

Affiliations

METTL3 promotes oxaliplatin resistance of gastric cancer CD133+ stem cells by promoting PARP1 mRNA stability

Huafu Li et al. Cell Mol Life Sci. .

Abstract

Oxaliplatin is the first-line regime for advanced gastric cancer treatment, while its resistance is a major problem that leads to the failure of clinical treatments. Tumor cell heterogeneity has been considered as one of the main causes for drug resistance in cancer. In this study, the mechanism of oxaliplatin resistance was investigated through in vitro human gastric cancer organoids and gastric cancer oxaliplatin-resistant cell lines and in vivo subcutaneous tumorigenicity experiments. The in vitro and in vivo results indicated that CD133+ stem cell-like cells are the main subpopulation and PARP1 is the central gene mediating oxaliplatin resistance in gastric cancer. It was found that PARP1 can effectively repair DNA damage caused by oxaliplatin by means of mediating the opening of base excision repair pathway, leading to the occurrence of drug resistance. The CD133+ stem cells also exhibited upregulated expression of N6-methyladenosine (m6A) mRNA and its writer METTL3 as showed by immunoprecipitation followed by sequencing and transcriptome analysis. METTTL3 enhances the stability of PARP1 by recruiting YTHDF1 to target the 3'-untranslated Region (3'-UTR) of PARP1 mRNA. The CD133+ tumor stem cells can regulate the stability and expression of m6A to PARP1 through METTL3, and thus exerting the PARP1-mediated DNA damage repair ability. Therefore, our study demonstrated that m6A Methyltransferase METTL3 facilitates oxaliplatin resistance in CD133+ gastric cancer stem cells by Promoting PARP1 mRNA stability which increases base excision repair pathway activity.

Keywords: Chemotherapy resistance; DNA repair; Digestive system tumors; Epigenetic modulation.


Conflict of interest statement

No potential conflicts of interest were disclosed.

Figures
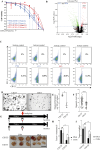
Fig. 1
Fig. 1
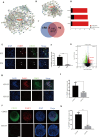
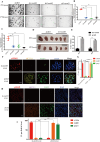
CD133+ cells are main cells responsible for oxaliplatin-resistance in human primary gastric cancer-patient derived organoids. A Compared with PT3 and PT4, PT1 and PT2 have obvious tolerance to oxaliplatin. The abscissa represents the concentration of oxaliplatin, and the ordinate represents cell viability. B The statistical significance of the fold change in gene expression (x-axis, log2 transformation) between oxaliplatin-resistant (PT1 and PT2) and sensitive (PT3 and PT4) populations (n = 3) determined by RNA sequencing (y-axis, log2 transformation) volcano map. FC, fold change; padj, adjust the p value for false discovery rate. Red dots indicate differentially expressed genes with padj < 0.05 of PT1 and PT2. Green dots indicate differentially expressed genes with padj < 0.05 of PT3 and PT4. C Flow cytometry analysis and comparison of CD133+ cells in PT1, PT2, PT3, and PT4 organoids. Isotype is no antibody control. The abscissa represents CD133, and the ordinate represents cells. D Representative images of organoid culture based on cells sorted by flow cytometry. The scale represents 200 μm. E Number of organoids in (D) after organoid formation. F Size of organoids in (D) after organoid formation. G A representative image of size change of tumor post BALB/C NUDE mice implantation with a dose of Oxaliplatin with its vehicle. The scale represents 1 cm. H Statistics of tumor volume after tumorigenesis in (G). I Statistics of tumor quality after tumorigenesis in (G). PT1 gastric cancer (GC) patient 1. PT2 GC patient 2. PT3 GC patient 3. PT4 GC patient 4. OXA Oxaliplatin. CON Solvent group. *p < 0.05, **p < 0.01, ***p < 0.001
Fig. 2
Fig. 2
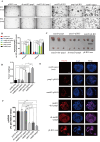
PARP1 is the central gene of CD133+ cells responsible for oxaliplatin resistance in gastric cancer. A Compared with PT3 and PT4 tumors, the protein interaction network diagram of STING database of mRNA differential expression in PT1 and PT2 tumors. The edges represent protein–protein associations. Cambridge Blue: from the curatorial database. Violet: measured experimentally. Green: The Jean community. Red: gene fusion. Blue: Co-occurrence of genes. Reseda: text mining. Black: Common expression. Clove: protein homology. B STING database CD133+ and CD133− tumor mRNA differentially expressed protein interaction network diagram. The edges represent protein–protein associations. Cambridge Blue: from the curatorial database. Violet: measured experimentally. Green: The Jean community. Red: gene fusion. Blue: co-occurrence of genes. Reseda: text mining. Black: common expression. Clove: protein homology. C There are 3 common core genes in (A) and (B), including PARP1, KLHL42 and REV3L. D Comparison of LOG2 (P value) and LOG2 (Fold change) of two gene sets in core genes of (C). E CD133 and PARP1 immunofluorescence staining of PT2 and PT4 tumor. Scale bar: 20 μm. F Proportion of PARP1+ cells in tumor in (E). G RNA-seq (n = 3) measures the fold change (y-axis, log2 transformation) and statistical significance (y-axis, log2 transformation) of gene expression (x-axis, log2 transformation) between CD133+ and CD133− cells populations. FC: fold change. Padj: adjust the p value for false discovery rate. The red dots represent the significantly differentially expressed genes of CD133− with padj < 0.05. Green dots indicate differentially expressed genes with CD133+ padj < 0.05. PROM1 (log2FC = 5.40, P = 0.0047), PARP1 (log2FC = 1.10, P = 0.000589). H Representative images of PARP1 and CD133 levels stained by immunofluorescence in CD133+ and CD133− tumors. The scale represents 20 μm. I Proportion of PARP1+ cells in tumor in (H). J Representative images of PARP1 and CD133 levels stained by immunofluorescence CD133+ and CD133− organoids. The scale represents 20 μm. K Proportion of PARP1 + cells in organoids in (J). *p < 0.05, **p < 0.01, ***p < 0.001
Fig. 3
Fig. 3
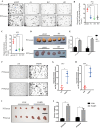
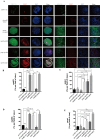
PARP1 is required for Oxaliplatin resistance development. (A) Organoid formation assay (organoid number) of PT1 and PT2 organoids treat with oxaliplatin following PARP1 knockdown using shRNAs 1–3 The scale represents 200 μm. (B, C) Number of organoids in A after organoid formation. PT1 organoids treat with oxaliplatin 35 μm/L. PT2 organoids treat with oxaliplatin 65 μm/L. (D) Representative image of the tumors. Scale bar, 1 cm. (E) The weight of the subcutaneous grafts at the end point after injection of 10,000 cells (n = 3 biologically independent animals). (F) Organoid formation assay (organoid number) of PT3 and PT4 organoids treat with oxaliplatin following PARP1 overexpression. The scale represents 200 μm. (G, H) Number of organoids in F after organoid formation. PT3 organoids treat with oxaliplatin 2 μm/L. PT4 organoids treat with oxaliplatin 4 μm/L. (I) Representative image of the tumors. Scale bar, 1 cm. (J) The weight of the subcutaneous grafts at the end point after injection of 10,000 cells (n = 3 biologically independent animals). * p < 0.05, ** p < 0.01, *** p < 0.001
Fig. 4
Fig. 4
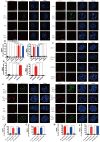
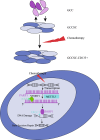
PARP1 can mediate oxaliplatin resistance through base excision repair. A Representative images of γ-H2AX and XRCC1 levels stained by immunofluorescence of PT1, PT1 OXA, PT2, PT2 OXA, PT3, PT3 OXA, PT4, PT4 OXA organoids. The scale represents 20 μm. B Proportion of γ-H2AX + and XRCC1 + cells in organoids in (A). C Representative images of γ-H2AX and XRCC1 levels stained by immunofluorescence CD133 ± and CD133 ± OXA organoids. The scale represents 20 μm. D Proportion of γ-H2AX + and XRCC1 + cells in organoids in (C). E Representative images of γ-H2AX and XRCC1 levels stained by immunofluorescence PT1 pLKO, PT1 sh-parp1, PT2 pLKO, PT2 sh-parp1, PT3 con, PT3 parp1, PT4 con, PT4 parp1 organoids. The scale represents 20 μm. F, G Proportion of γ-H2AX + cells and XRCC1 + in organoids in (E). * p < 0.05, ** p < 0.01, *** p < 0.001. H, I Proportion of γ-H2AX+ cells and XRCC1+ in PDX in (E)
Fig. 5
Fig. 5
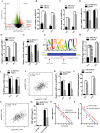
N6-Methyladenosine METTL3 maintains expression of PARP1 in CD133+ gastric cancer stem cells. A RNA-seq measures the statistical significance (y-axis, log2 transformation) volcano plot of the fold change of gene expression (x-axis, log2 transformation) between CD133+ and CD133− cells populations. FC, fold change; padj, adjust the p value for false discovery rate. Red dots indicate significantly differentially expressed genes of CD133+ with padj < 0.05. The green dots indicate a significant difference between padj < 0.05 and CD133- gene expression. The m6A genes of METTL3 and YTDHF1 are highly expressed in CD133+ . B m6A quantitative analysis showed the percentage of m6A content in CD133+ and CD133−. C m6A quantitative analysis showed the percentage of m6A content in PT1 and PT2 organoid transfected with METTL3 overexpression. D m6A quantitative analysis showed the percentage of m6A content in PT1 and PT2 organoid transfected with METTL3 knockdown. E, F RT-PCR indicated the PARP1 mRNA in the transfection of METTL3 knockdown or METTL3 Overexpression. G Schematic diagram demonstrated the m6A motif of METTL3 and the m6A site in the 3’-UTR of PARP1 mRNA (near stop codon). H, I MeRIP-qPCR indicated the PARP1 mRNA enrichment precipitated by m6A antibody. J Correlation analysis by Spearman’s rank correlation coefficient (GEPIA, http://gepia.cancer-pku.cn/) showed the correlation within METTL3 and PARP1 in the GC tissue specimens. K RT-PCR demonstrated the PARP1 mRNA expression in PT1 and PT2 organoid transfected with YTHDF1 Knock down. L RNA immunoprecipitation (RIP)-PCR indicated the direct binding within YTHDF1 and PARP1 mRNA. M Correlation analysis by Spearman’s rank correlation coefficient showed the positive correlation within PARP1 expression and YTHDF1 in the GC tissue specimens. N RIP-qPCR indicated the enrichment of HK2 mRNA in PT1 and PT2 organoid, using anti-YTHDF1 antibody, with METTL3 knockdown. O, P RNA decay rate followed by RT-PCR assay demonstrated the PARP1 mRNA half-lives upon the METTL3 knockdown and YTHDF1 knockdown. Data were detected at indicated timepoint with actinomycin D (Act D, 5 μg/mL) treatment. *p < 0.05, **p < 0.01, ***p < 0.001
Fig. 6
Fig. 6
METTL3 knockdown significantly reduced oxaliplatin tolerance in drug-resistant GC. A Organoid formation assay (organoid number) of PT1 and PT2 organoids following METTL3 knockdown using shRNAs 1–3 The scale represents 200 μm. B, C Number of organoids in (A) after organoid formation. PT1 organoids treat with oxaliplatin 35 μm/L. PT2 organoids treat with oxaliplatin 65 μm/L. D Representative image of the tumors. Scale bar, 1 cm. E The weight of the subcutaneous grafts at the end point after injection of 10,000 cells (n = 3 biologically independent animals). F Representative images of γ-H2AX, PARP1, METTL3 levels stained by immunofluorescence METTL3 knockdown organoids. The scale represents 20 μm. G Proportion of γ-H2AX, PARP1, METTL3 + cells in organoids in (F). H Representative images of γ-H2AX, PARP1, METTL3 levels stained by immunofluorescence METTL3 knockdown tumor. The scale represents 200 μm. I Proportion of γ-H2AX, PARP1, METTL3 + cells in tumor in (H). *p < 0.05, **p < 0.01, ***p < 0.001
Fig. 7
Fig. 7
N6-Methyladenosine METTL3 maintains the function of PARP1 in oxaliplatin resistance. A Organoid formation assay (organoid number) of PT3 and PT4 organoids following METTL3 knockdown and PARP1 overexpression, PARP1 knockdown and METTL3 overexpression, METTL3 overexpression, PARP1 overexpression, METTL3 overexpression and PARP1 overexpression. The scale represents 200 μm. B Number of organoids in (A) after organoid formation. PT3 organoids treat with oxaliplatin 8 μmol/L. PT2 organoids treat with oxaliplatin 8 μmol/L. C Representative image of the tumors. Scale bar, 1 cm. D The weight of the subcutaneous grafts at the end point after injection of 20,000 cells (n = 3 biologically independent animals). E Representative images of γ-H2AX levels stained by immunofluorescence of organoids of METTL3 and PARP1 overexpressions, PARP1 overexpression, METTL3 overexpression, METTL3 overexpression and PARP1 knockdown, METTL3 knockdown and PARP1 overexpression. The scale represents 20 μm. F Proportion of γ-H2AX + cells in organoids in (E). * p < 0.05, ** p < 0.01, *** p < 0.001
Fig. 8
Fig. 8
N6-Methyladenosine METTL3 maintains the expression of PARP1. A Representative images of PARP1 and METTL3 levels stained by immunofluorescence of organoids of METTL3 overexpression, PARP1 overexpression, METTL3 overexpression and PARP1 overexpression in organoid and tumor. The scale represents 20 μm of organoid. The scale represents 200 μm of tumor. B Proportion of METTL3 + cells in organoids in (A). C Proportion of PARP1 + cells in organoids in (A). D Proportion of METTL3 + cells in tumor in (A). E Proportion of PARP1 + cells in tumor in (D). * p < 0.05, ** p < 0.01, *** p < 0.001
Fig. 9
Fig. 9
The schematic model of METTL3 in regulating PARP1 mediated oxaliplatin resistance through DNA damage repair

Similar articles

Cited by

References

    1. Arnold M, Ferlay J, van Berge Henegouwen MI, Soerjomataram I. Global burden of oesophageal and gastric cancer by histology and subsite in 2018. Gut. 2020;69(9):1564–1571. doi: 10.1136/gutjnl-2020-321600. - DOI - PubMed
    1. Zong L, Abe M, Seto Y, Ji J. The challenge of screening for early gastric cancer in China. Lancet (London, England) 2016;388(10060):2606. doi: 10.1016/S0140-6736(16)32226-7. - DOI - PubMed
    1. Boku N, Ryu MH, Kato K, Chung HC, Minashi K, Lee KW, et al. Safety and efficacy of nivolumab in combination with S-1/capecitabine plus oxaliplatin in patients with previously untreated, unresectable, advanced, or recurrent gastric/gastroesophageal junction cancer: interim results of a randomized, phase II trial (ATTRACTION-4) Ann Oncol Off J Eur Soc Med Oncol. 2019;30(2):250–258. doi: 10.1093/annonc/mdy540. - DOI - PMC - PubMed
    1. Harada K, Sakamoto N, Ukai S, Yamamoto Y, Pham QT, Taniyama D, et al. Establishment of oxaliplatin-resistant gastric cancer organoids: importance of myoferlin in the acquisition of oxaliplatin resistance. Gastric Cancer 2021. - PubMed
    1. Wang VM, Ferreira RMM, Almagro J, Evan T, Legrave N, Zaw Thin M, et al. CD9 identifies pancreatic cancer stem cells and modulates glutamine metabolism to fuel tumour growth. Nat Cell Biol. 2019;21(11):1425–1435. doi: 10.1038/s41556-019-0407-1. - DOI - PMC - PubMed

MeSH terms