Translational profiling of mouse dopaminoceptive neurons reveals region-specific gene expression, exon usage, and striatal prostaglandin E2 modulatory effects
- PMID: 35177825
- PMCID: PMC10009708
- DOI: 10.1038/s41380-022-01439-4
Translational profiling of mouse dopaminoceptive neurons reveals region-specific gene expression, exon usage, and striatal prostaglandin E2 modulatory effects
Abstract
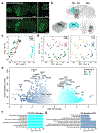
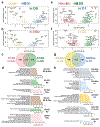
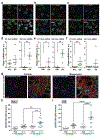
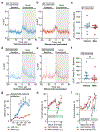
Forebrain dopamine-sensitive (dopaminoceptive) neurons play a key role in movement, action selection, motivation, and working memory. Their activity is altered in Parkinson's disease, addiction, schizophrenia, and other conditions, and drugs that stimulate or antagonize dopamine receptors have major therapeutic applications. Yet, similarities and differences between the various neuronal populations sensitive to dopamine have not been systematically explored. To characterize them, we compared translating mRNAs in the dorsal striatum and nucleus accumbens neurons expressing D1 or D2 dopamine receptor and prefrontal cortex neurons expressing D1 receptor. We identified genome-wide cortico-striatal, striatal D1/D2 and dorso/ventral differences in the translating mRNA and isoform landscapes, which characterize dopaminoceptive neuronal populations. Expression patterns and network analyses identified novel transcription factors with presumptive roles in these differences. Prostaglandin E2 (PGE2) was a candidate upstream regulator in the dorsal striatum. We pharmacologically explored this hypothesis and showed that misoprostol, a PGE2 receptor agonist, decreased the excitability of D2 striatal projection neurons in slices, and diminished their activity in vivo during novel environment exploration. We found that misoprostol also modulates mouse behavior including by facilitating reversal learning. Our study provides powerful resources for characterizing dopamine target neurons, new information about striatal gene expression patterns and regulation. It also reveals the unforeseen role of PGE2 in the striatum as a potential neuromodulator and an attractive therapeutic target.
© 2022. The Author(s), under exclusive licence to Springer Nature Limited.
Conflict of interest statement
Conflict of interest
The authors declare no conflicts of interest.
Figures


Similar articles
-
Dopamine D1 or D2 receptor-expressing neurons in the central nervous system.Addict Biol. 2018 Mar;23(2):569-584. doi: 10.1111/adb.12512. Epub 2017 Apr 24. Addict Biol. 2018. PMID: 28436559 Free PMC article.
-
CK2 Oppositely Modulates l-DOPA-Induced Dyskinesia via Striatal Projection Neurons Expressing D1 or D2 Receptors.J Neurosci. 2017 Dec 6;37(49):11930-11946. doi: 10.1523/JNEUROSCI.0443-17.2017. Epub 2017 Nov 2. J Neurosci. 2017. PMID: 29097596 Free PMC article.
-
D1 and D2 dopamine receptor gene expression in the rat striatum: sensitive cRNA probes demonstrate prominent segregation of D1 and D2 mRNAs in distinct neuronal populations of the dorsal and ventral striatum.J Comp Neurol. 1995 May 8;355(3):418-26. doi: 10.1002/cne.903550308. J Comp Neurol. 1995. PMID: 7636023
-
Differential striatal spine pathology in Parkinson's disease and cocaine addiction: a key role of dopamine?Neuroscience. 2013 Oct 22;251:2-20. doi: 10.1016/j.neuroscience.2013.07.011. Epub 2013 Jul 16. Neuroscience. 2013. PMID: 23867772 Free PMC article. Review.
-
Molecular effects of dopamine on striatal-projection pathways.Trends Neurosci. 2000 Oct;23(10 Suppl):S64-70. doi: 10.1016/s1471-1931(00)00019-7. Trends Neurosci. 2000. PMID: 11052222 Review.
Cited by
-
Adult-specific Reelin expression alters striatal neuronal organization: implications for neuropsychiatric disorders.Front Cell Neurosci. 2023 Apr 20;17:1143319. doi: 10.3389/fncel.2023.1143319. eCollection 2023. Front Cell Neurosci. 2023. PMID: 37153634 Free PMC article.
-
Operant Training for Highly Palatable Food Alters Translating Messenger RNA in Nucleus Accumbens D2 Neurons and Reveals a Modulatory Role of Ncdn.Biol Psychiatry. 2024 May 15;95(10):926-937. doi: 10.1016/j.biopsych.2023.08.006. Epub 2023 Aug 12. Biol Psychiatry. 2024. PMID: 37579933
-
Excessive self-grooming, gene dysregulation and imbalance between the striosome and matrix compartments in the striatum of Shank3 mutant mice.Front Mol Neurosci. 2023 Mar 16;16:1139118. doi: 10.3389/fnmol.2023.1139118. eCollection 2023. Front Mol Neurosci. 2023. PMID: 37008785 Free PMC article.
-
Low Dopamine D2 Receptor Expression Drives Gene Networks Related to GABA, cAMP, Growth and Neuroinflammation in Striatal Indirect Pathway Neurons.Biol Psychiatry Glob Open Sci. 2022 Sep 8;3(4):1104-1115. doi: 10.1016/j.bpsgos.2022.08.010. eCollection 2023 Oct. Biol Psychiatry Glob Open Sci. 2022. PMID: 37881572 Free PMC article.
-
DNA methylation and hydroxymethylation characterize the identity of D1 and D2 striatal projection neurons.Commun Biol. 2022 Dec 1;5(1):1321. doi: 10.1038/s42003-022-04269-w. Commun Biol. 2022. PMID: 36456703 Free PMC article.
References
-
- Bjorklund A, Dunnett SB. Dopamine neuron systems in the brain: an update. Trends Neurosci 2007; 30(5): 194–202. - PubMed
-
- Gerfen CR, Engber TM, Mahan LC, Susel Z, Chase TN, Monsma FJ Jr. et al. D1 and D2 dopamine receptor-regulated gene expression of striatonigral and striatopallidal neurons. Science 1990; 250: 1429–1432. - PubMed
-
- Tecuapetla F, Jin X, Lima SQ, Costa RM. Complementary Contributions of Striatal Projection Pathways to Action Initiation and Execution. Cell 2016; 166(3): 703–715. - PubMed
-
- Beaulieu JM, Gainetdinov RR. The physiology, signaling, and pharmacology of dopamine receptors. Pharmacol Rev 2011; 63(1): 182–217. - PubMed
-
- Santana N, Mengod G, Artigas F. Quantitative analysis of the expression of dopamine D1 and D2 receptors in pyramidal and GABAergic neurons of the rat prefrontal cortex. Cereb Cortex 2009; 19(4): 849–860. - PubMed
Publication types
MeSH terms
Substances
Grants and funding
- BB/P013384/1/BB_/Biotechnology and Biological Sciences Research Council/United Kingdom
- BB/P013406/1/BB_/Biotechnology and Biological Sciences Research Council/United Kingdom
- BB/P013414/1/BB_/Biotechnology and Biological Sciences Research Council/United Kingdom
- P30 DA018343/DA/NIDA NIH HHS/United States
- R21 DA040454/DA/NIDA NIH HHS/United States
LinkOut - more resources
Full Text Sources
Molecular Biology Databases

