. 2022 Mar;24(3):327-339.
doi: 10.1038/s41556-022-00847-6. Epub 2022 Feb 17.

Spatial organization of transcribed eukaryotic genes

Affiliations

Spatial organization of transcribed eukaryotic genes

Susanne Leidescher et al. Nat Cell Biol. 2022 Mar.

Abstract

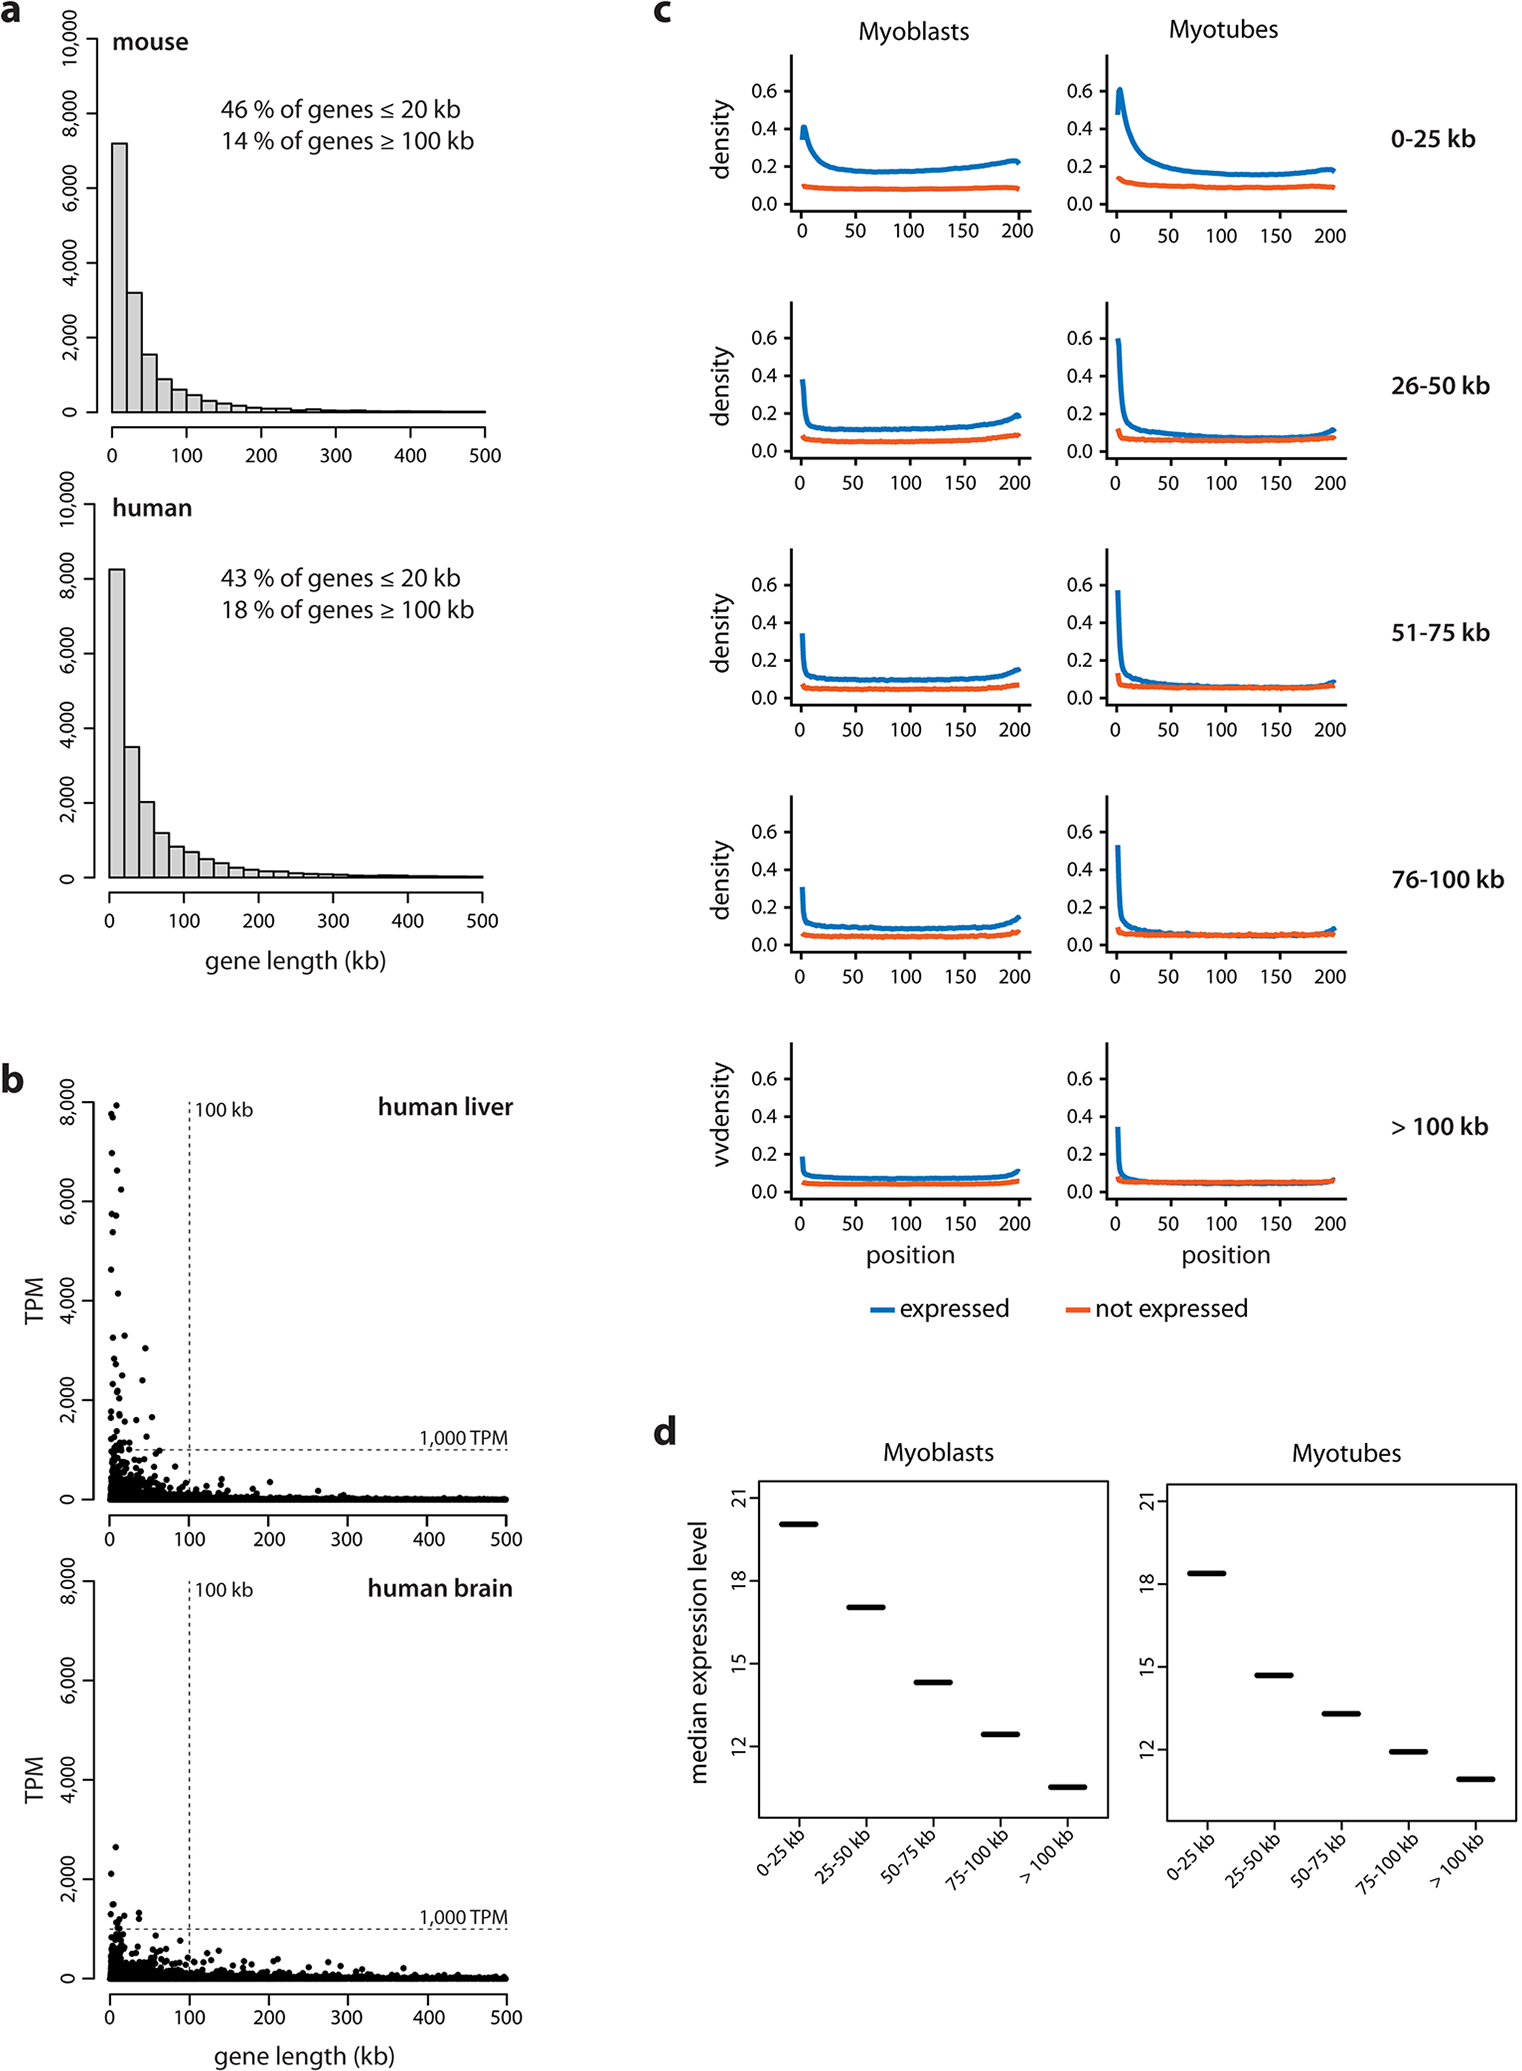
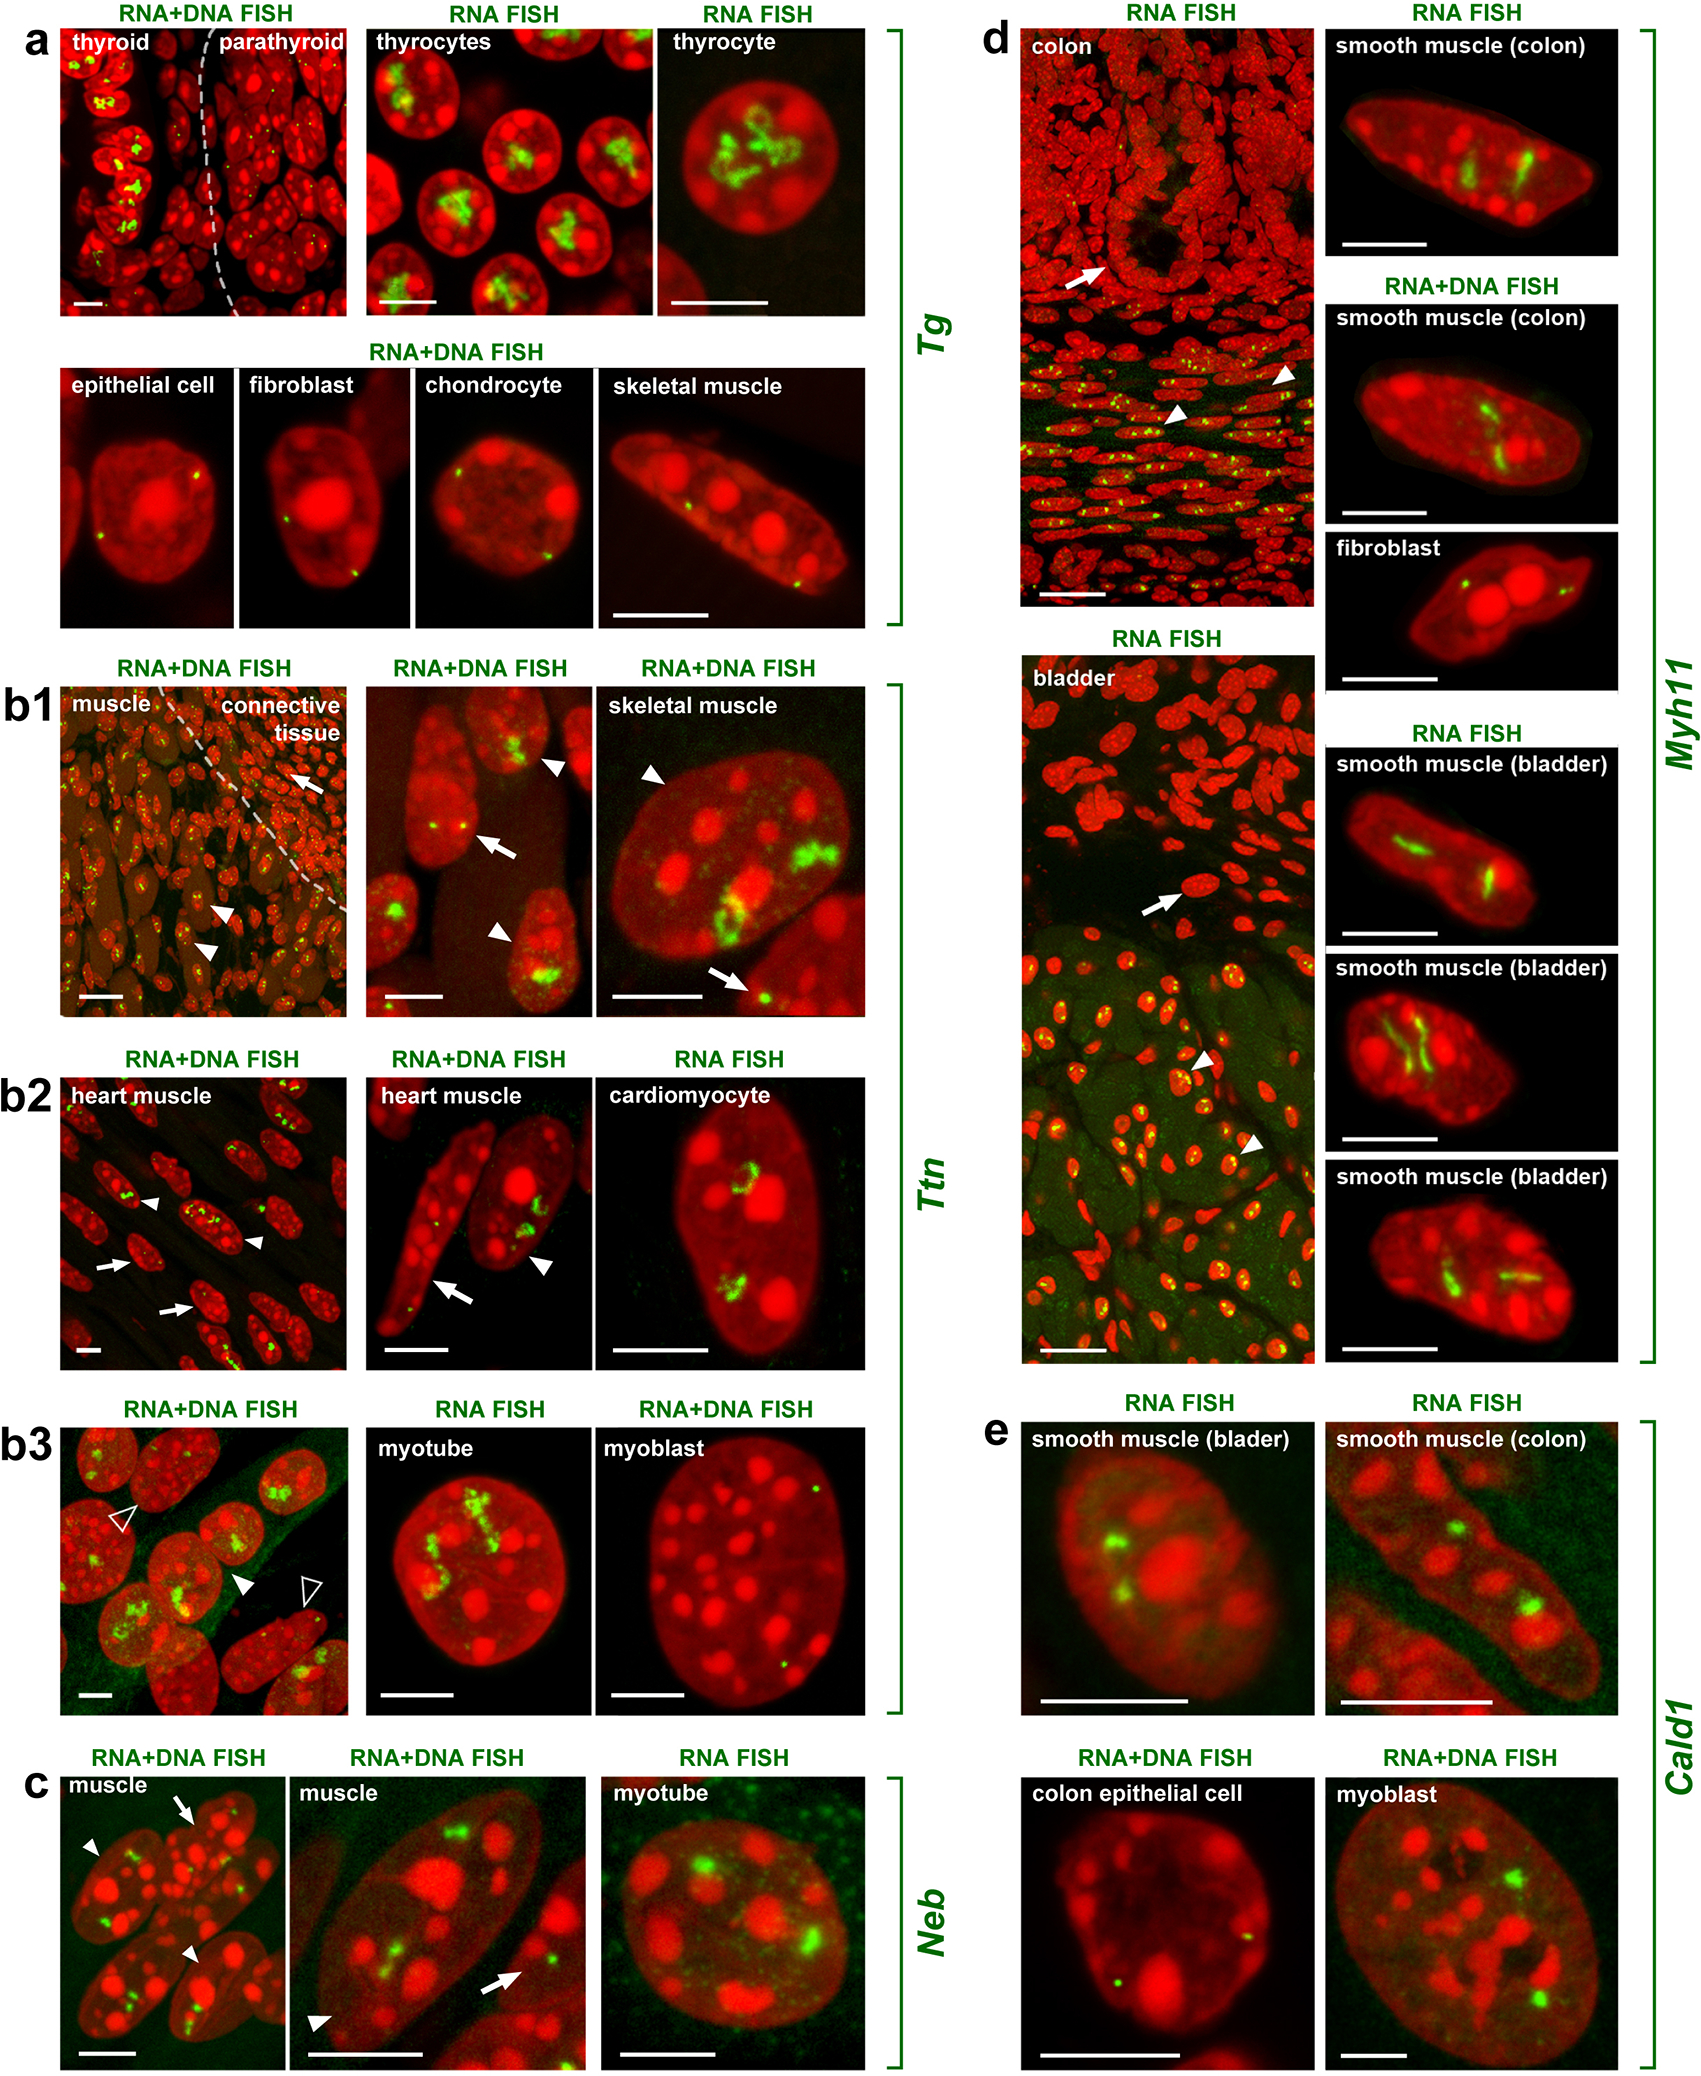
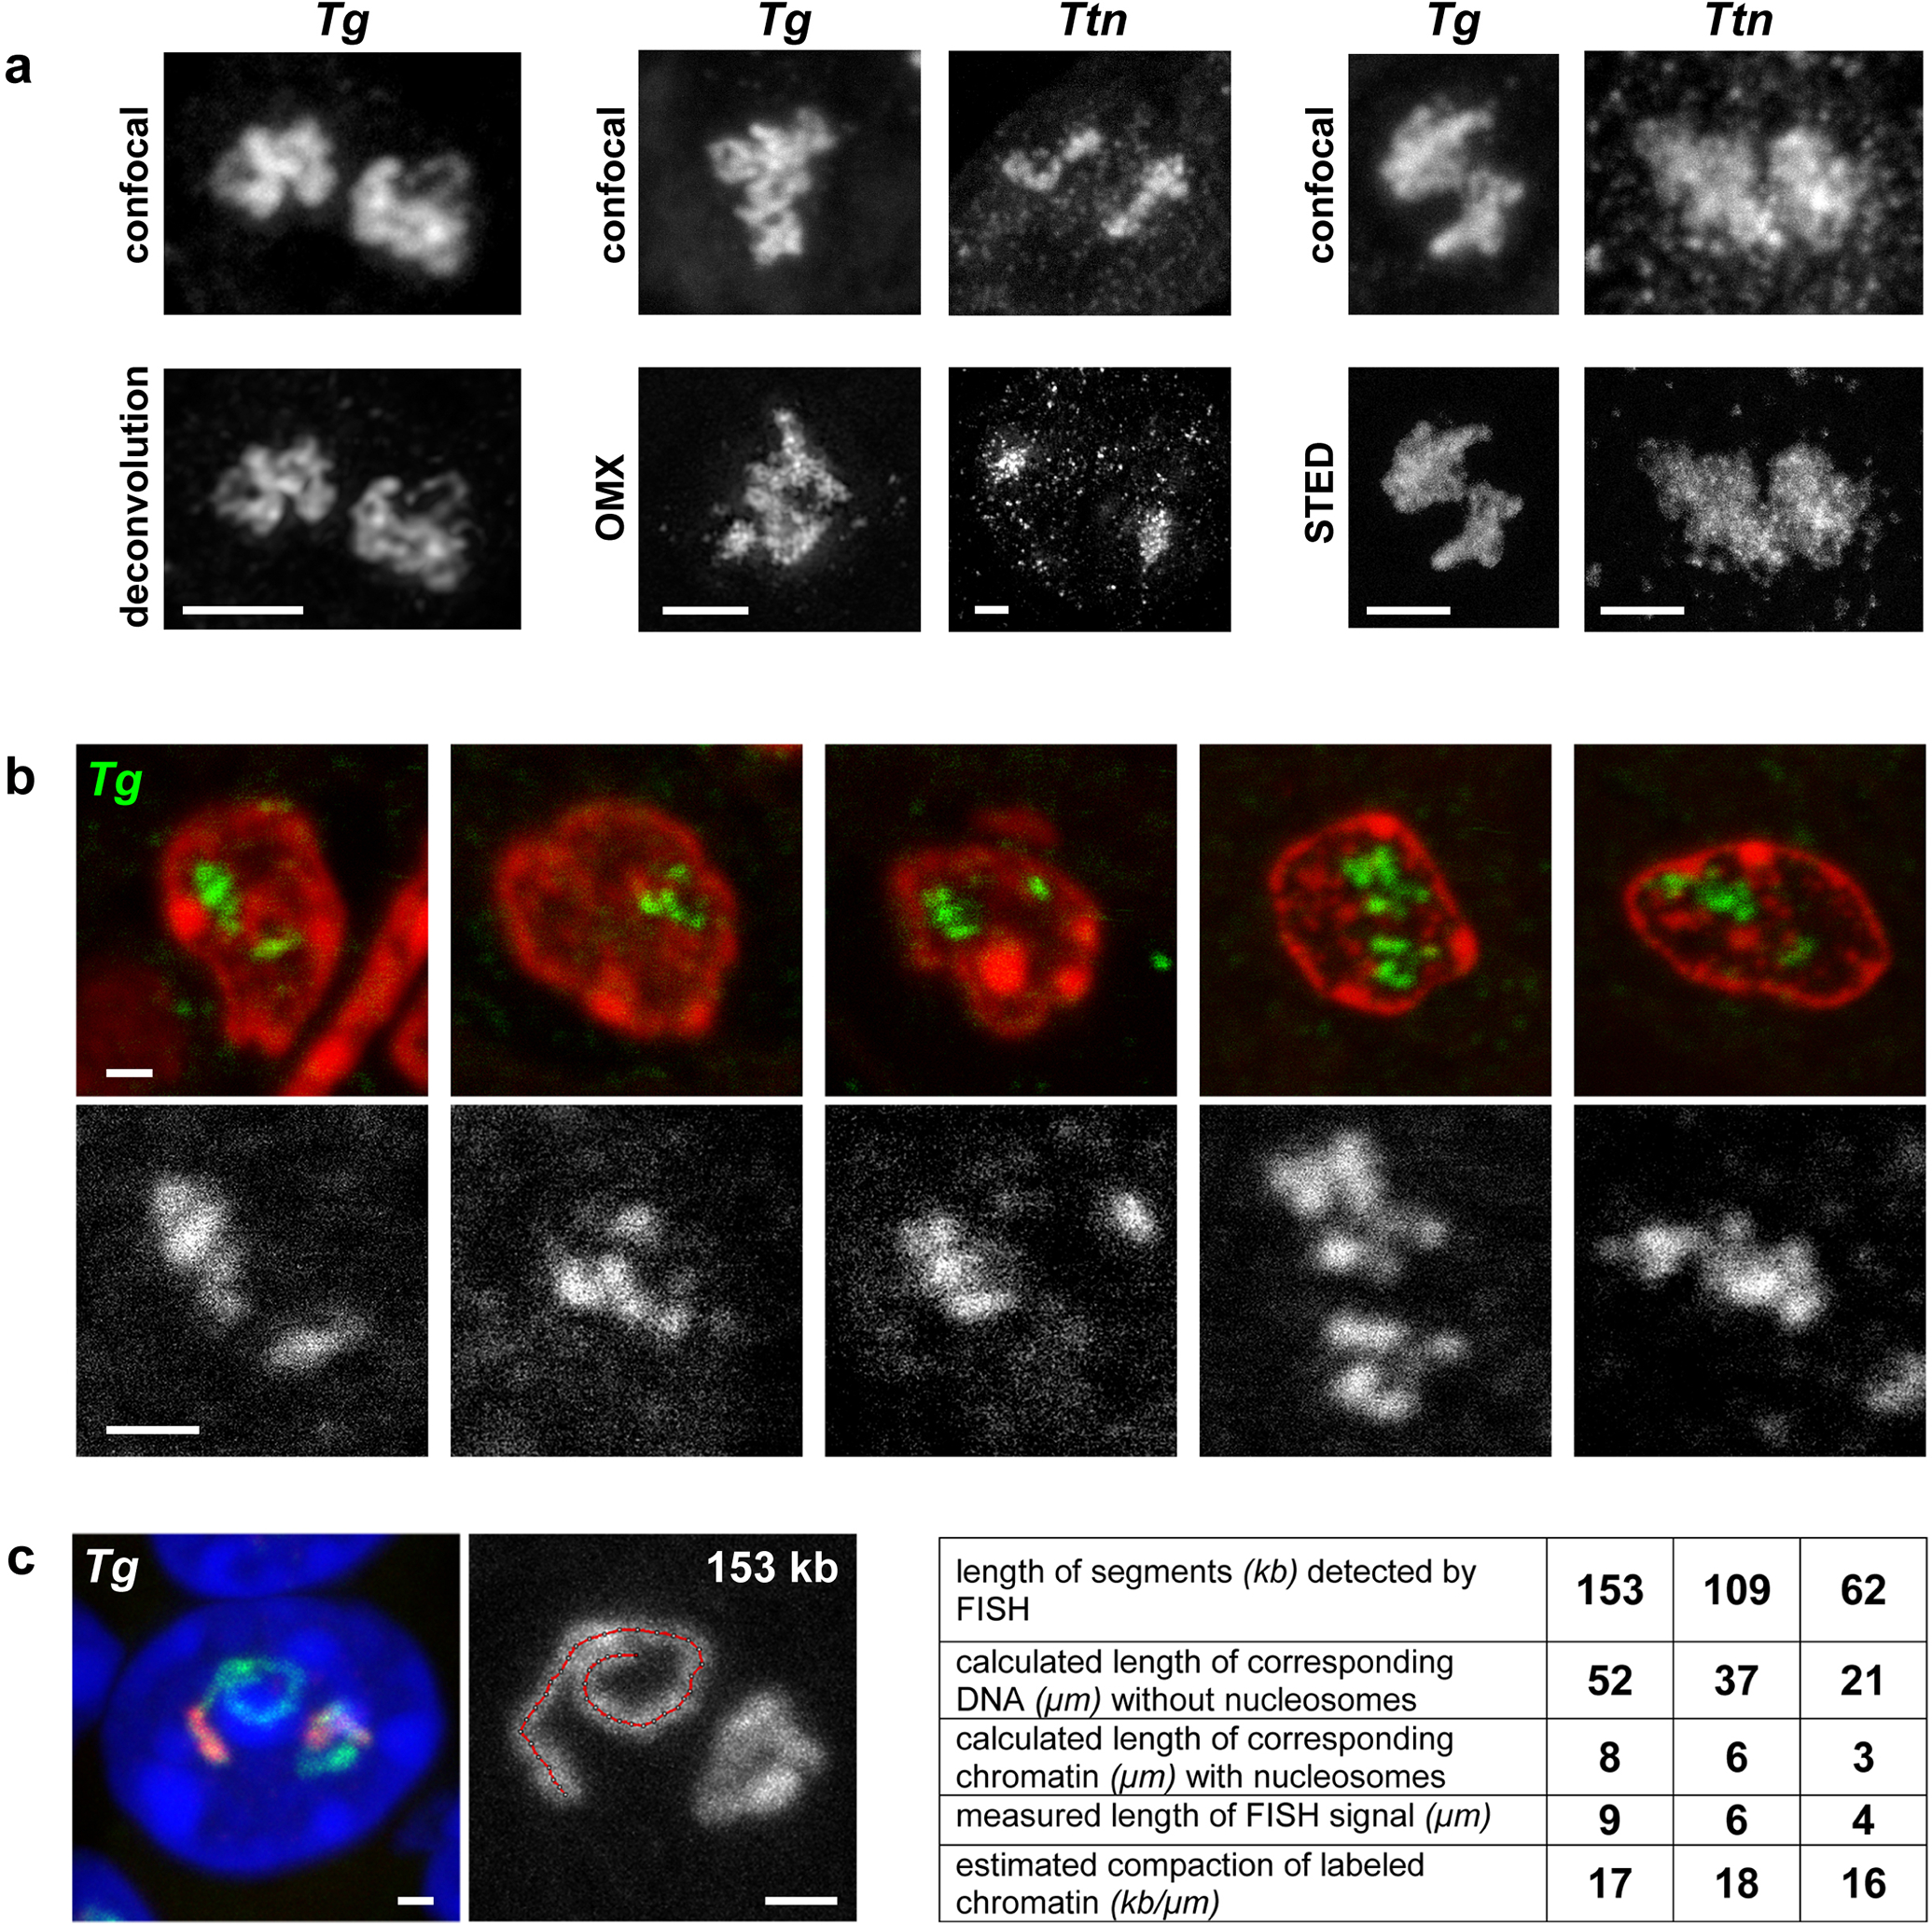
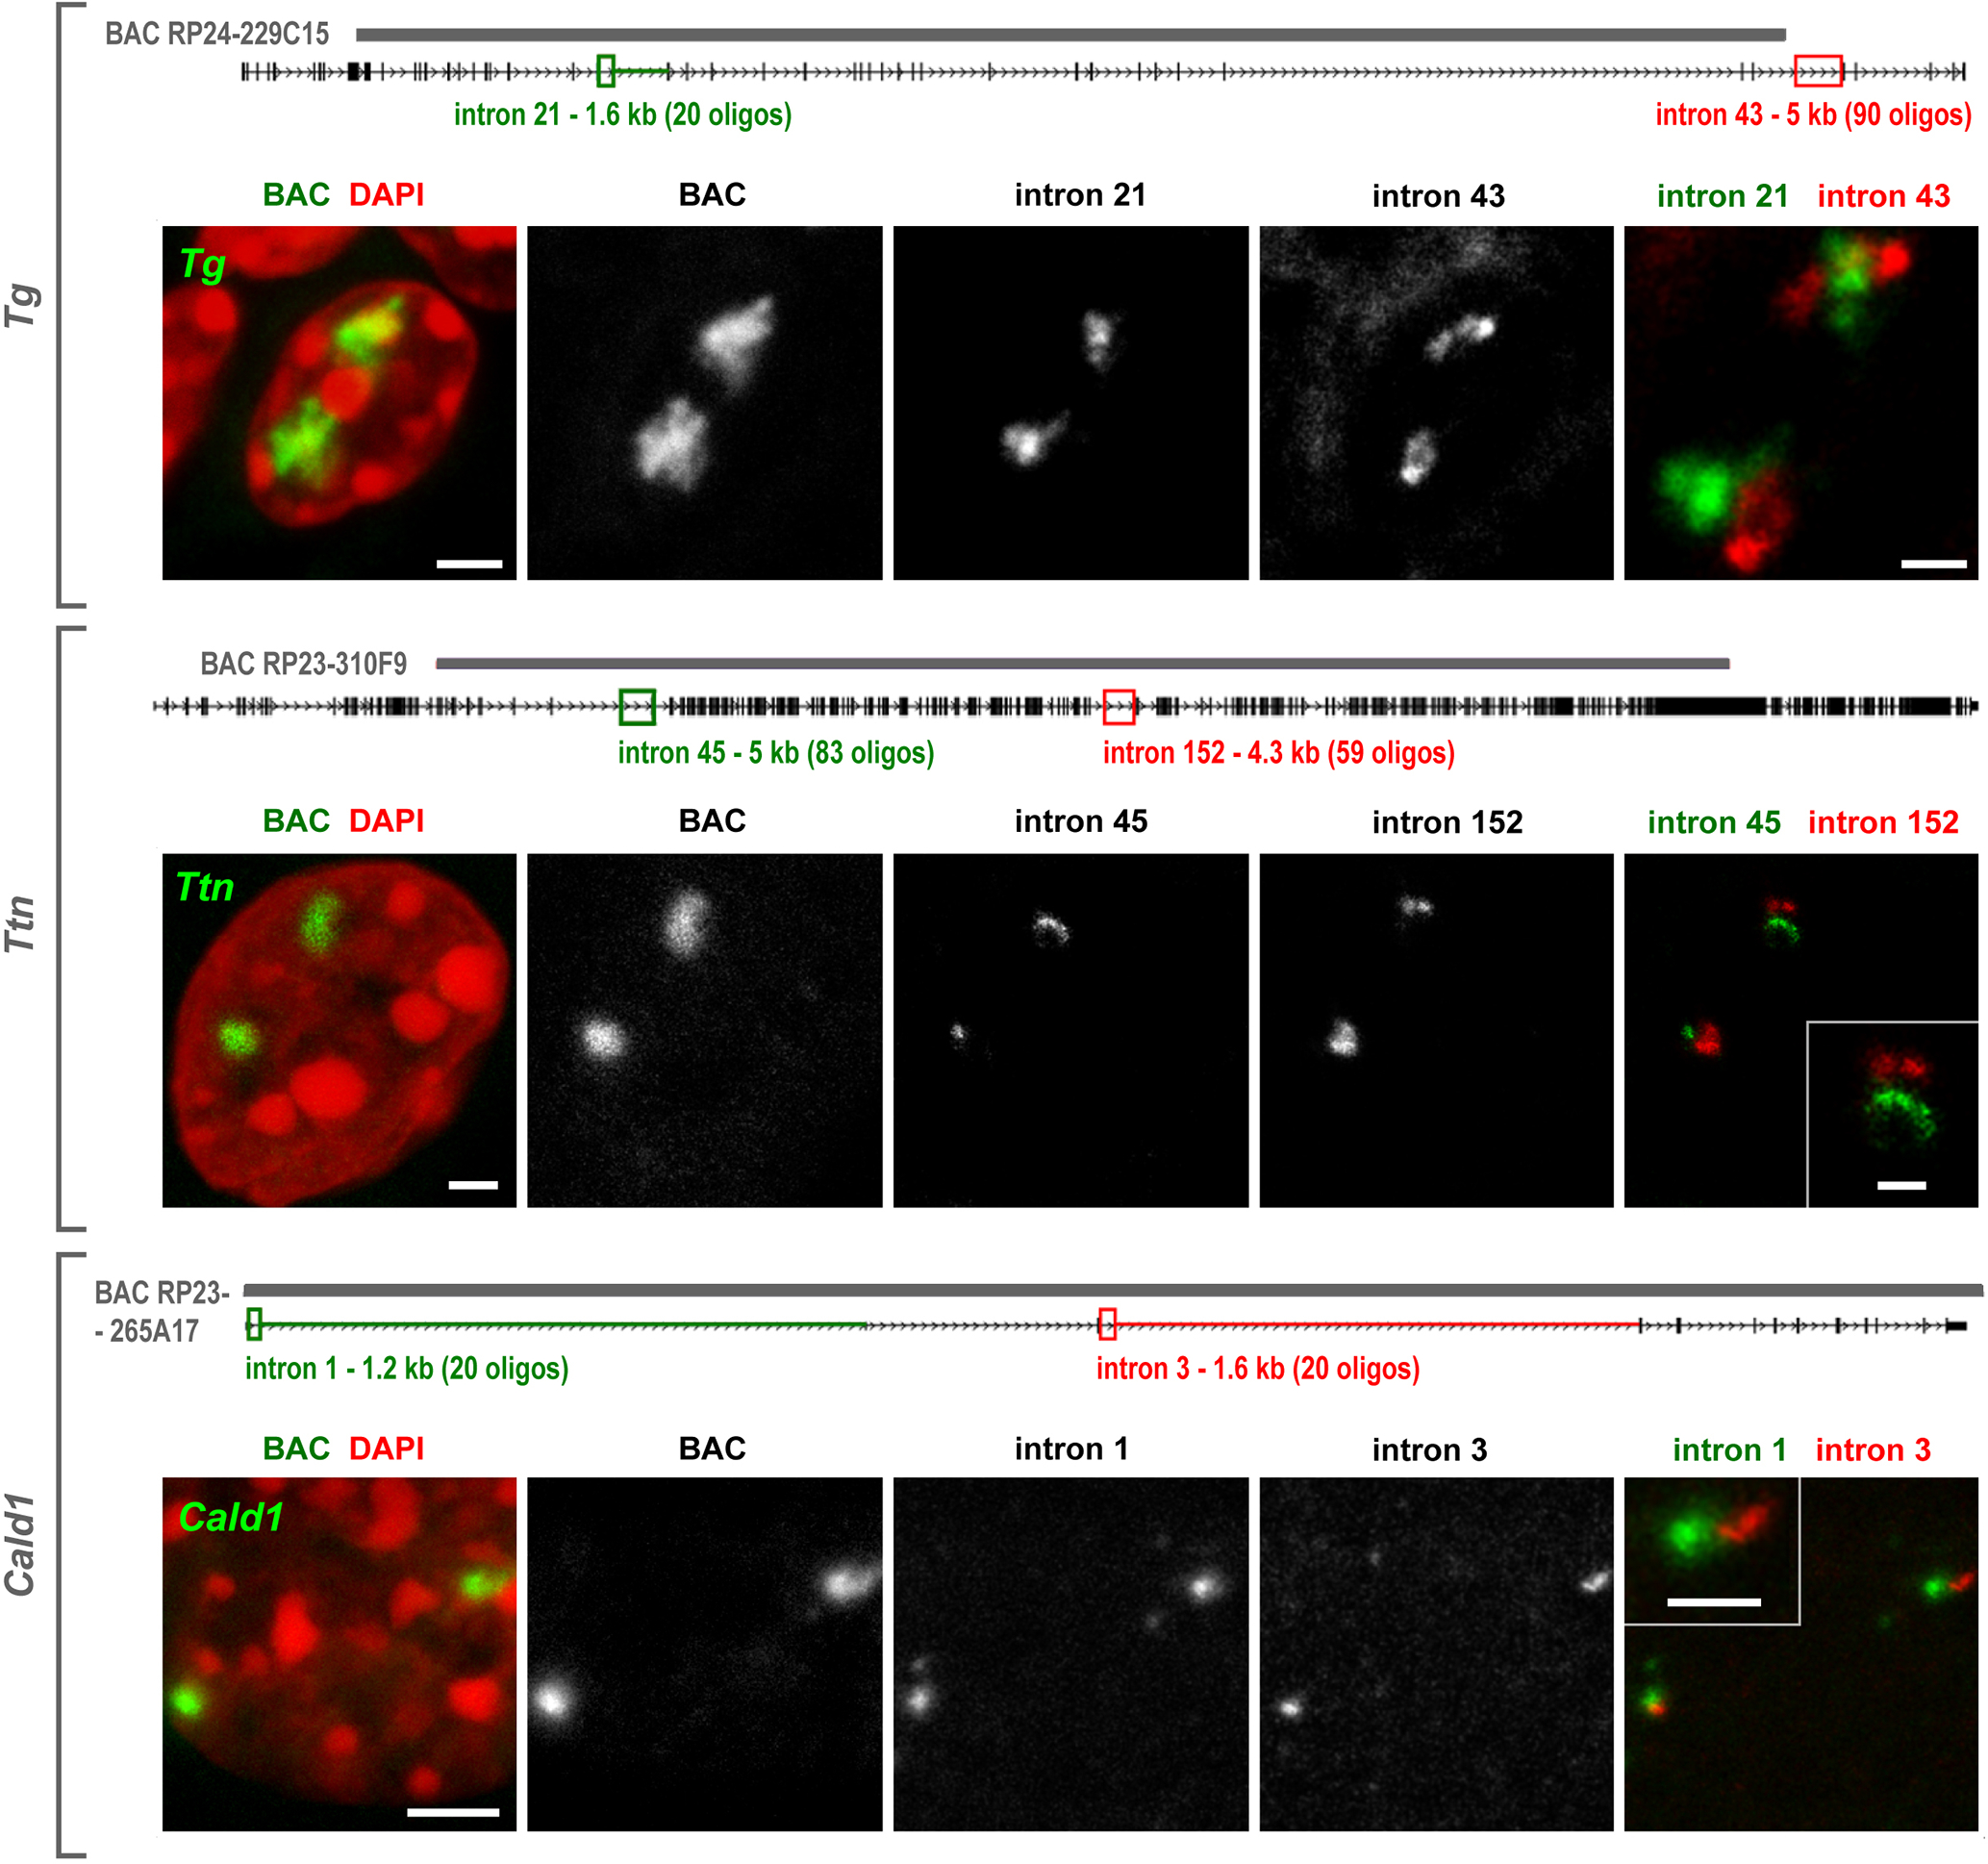
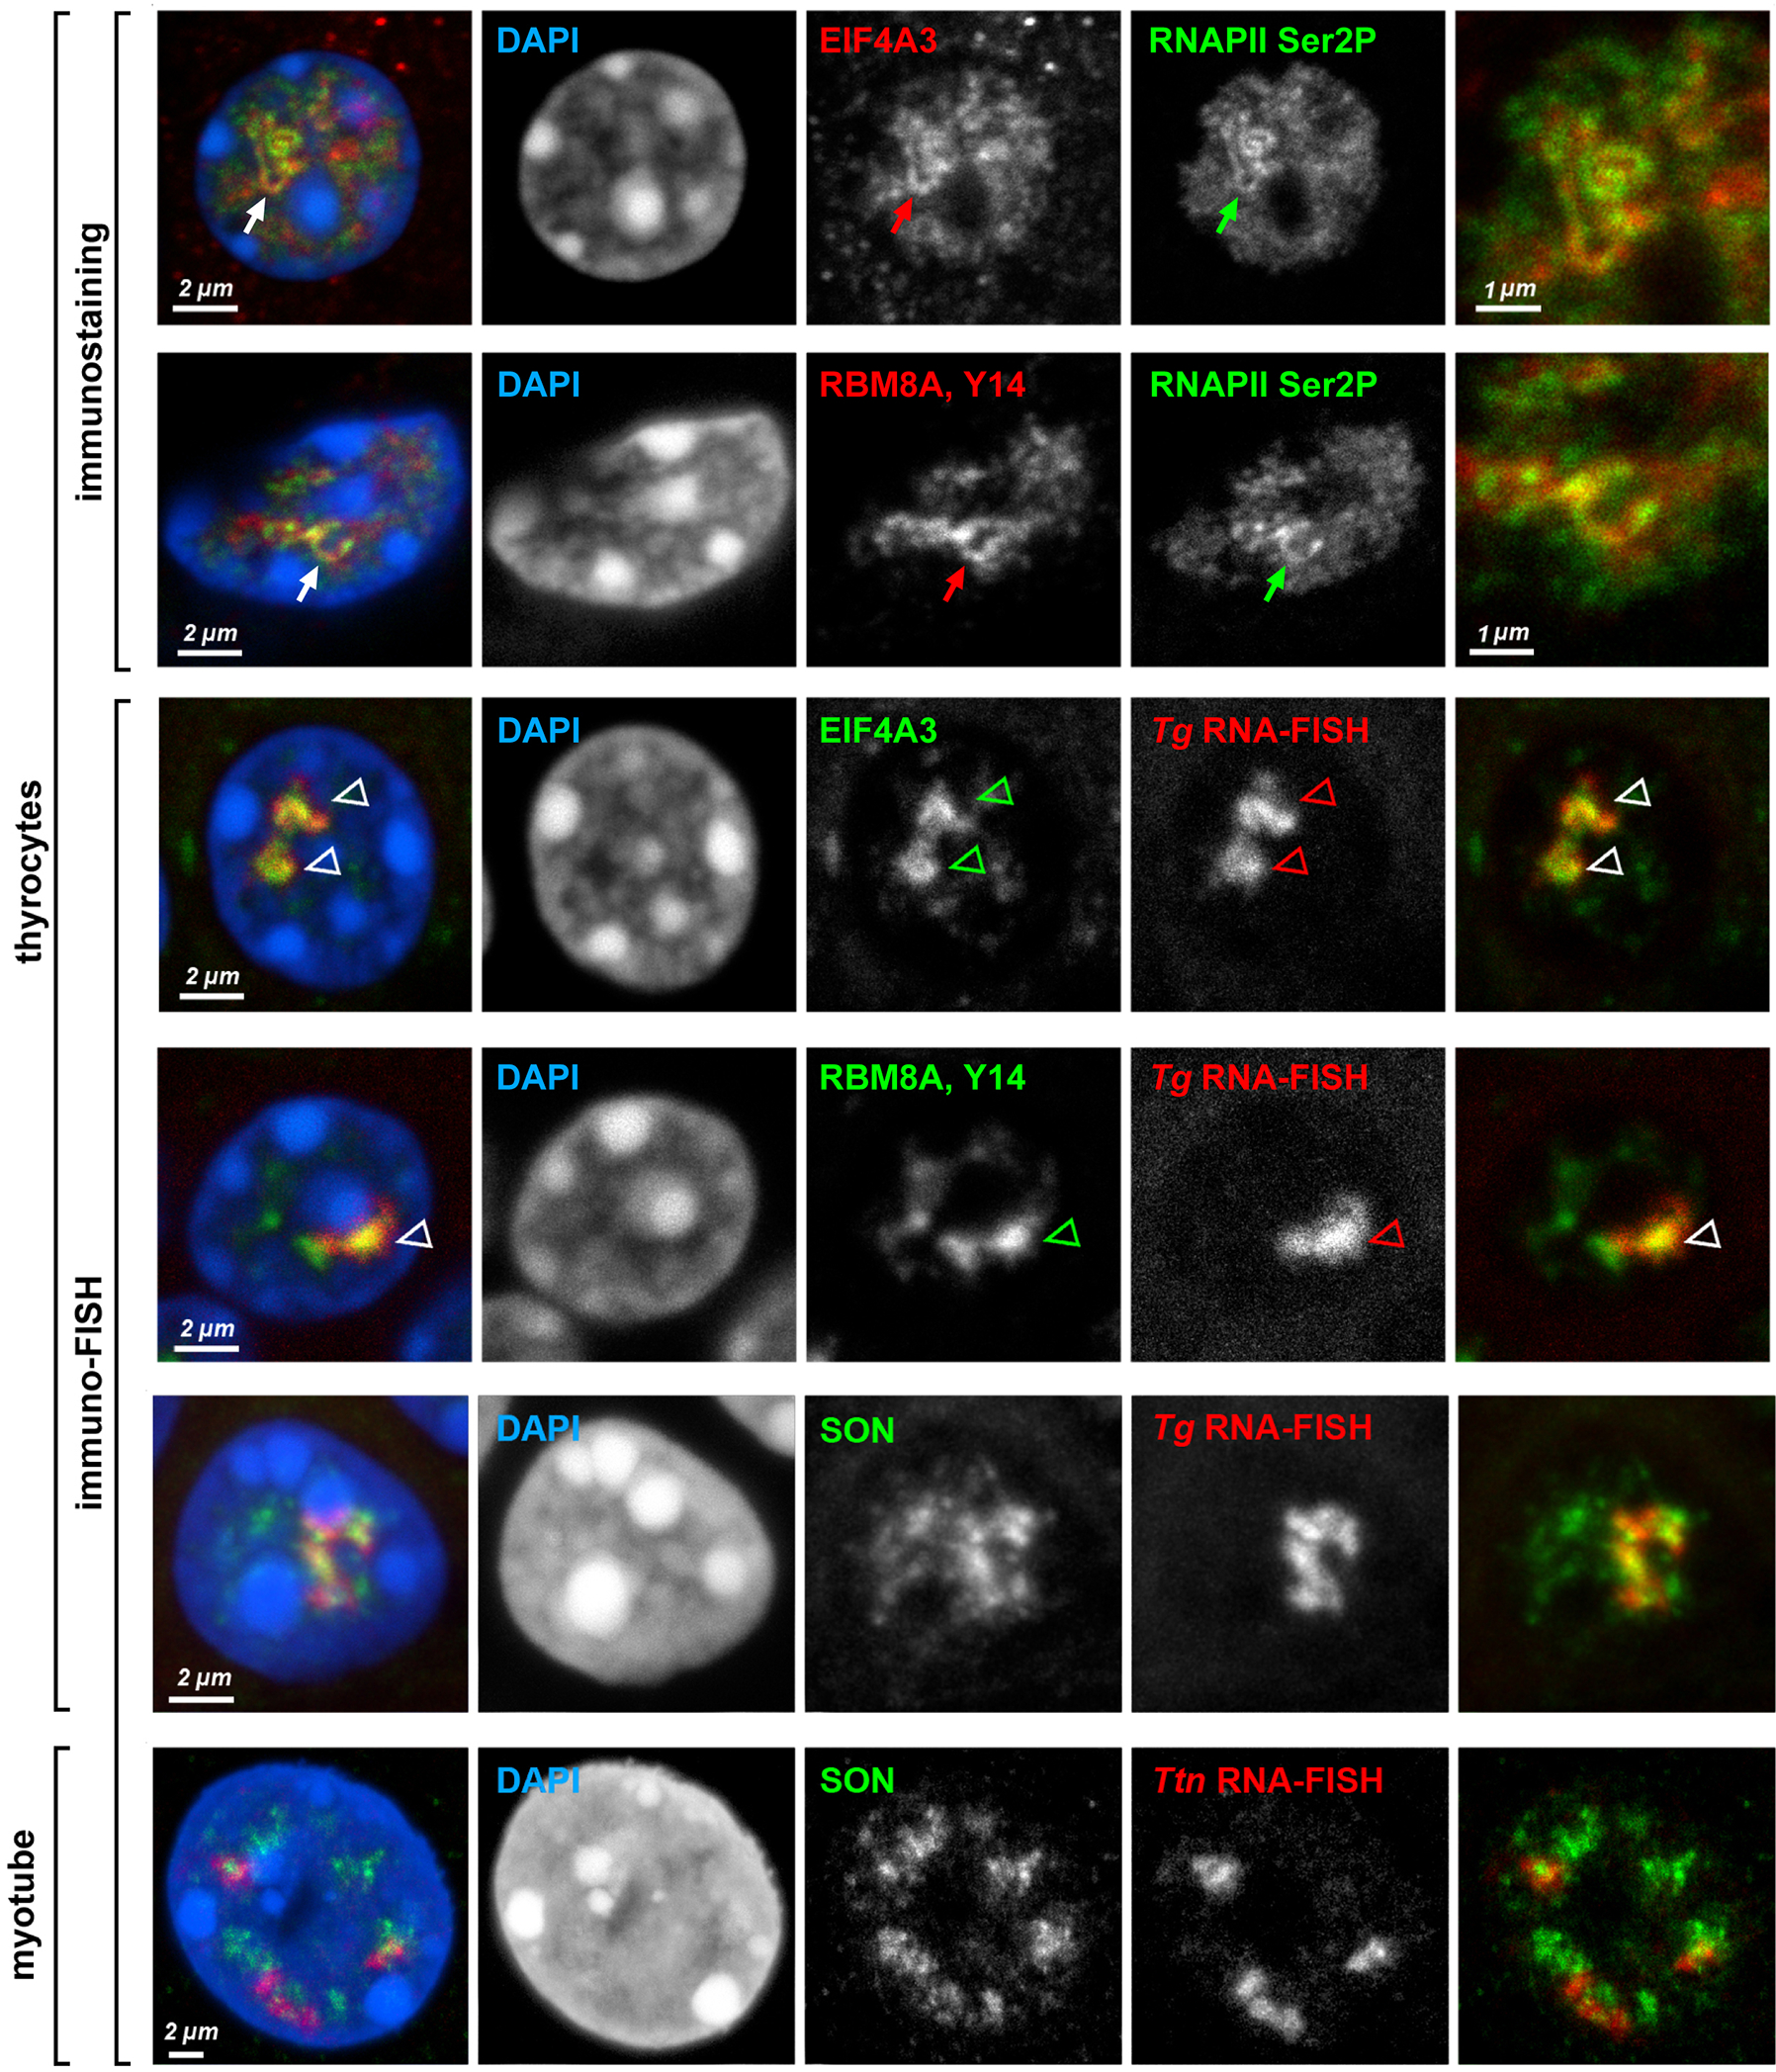
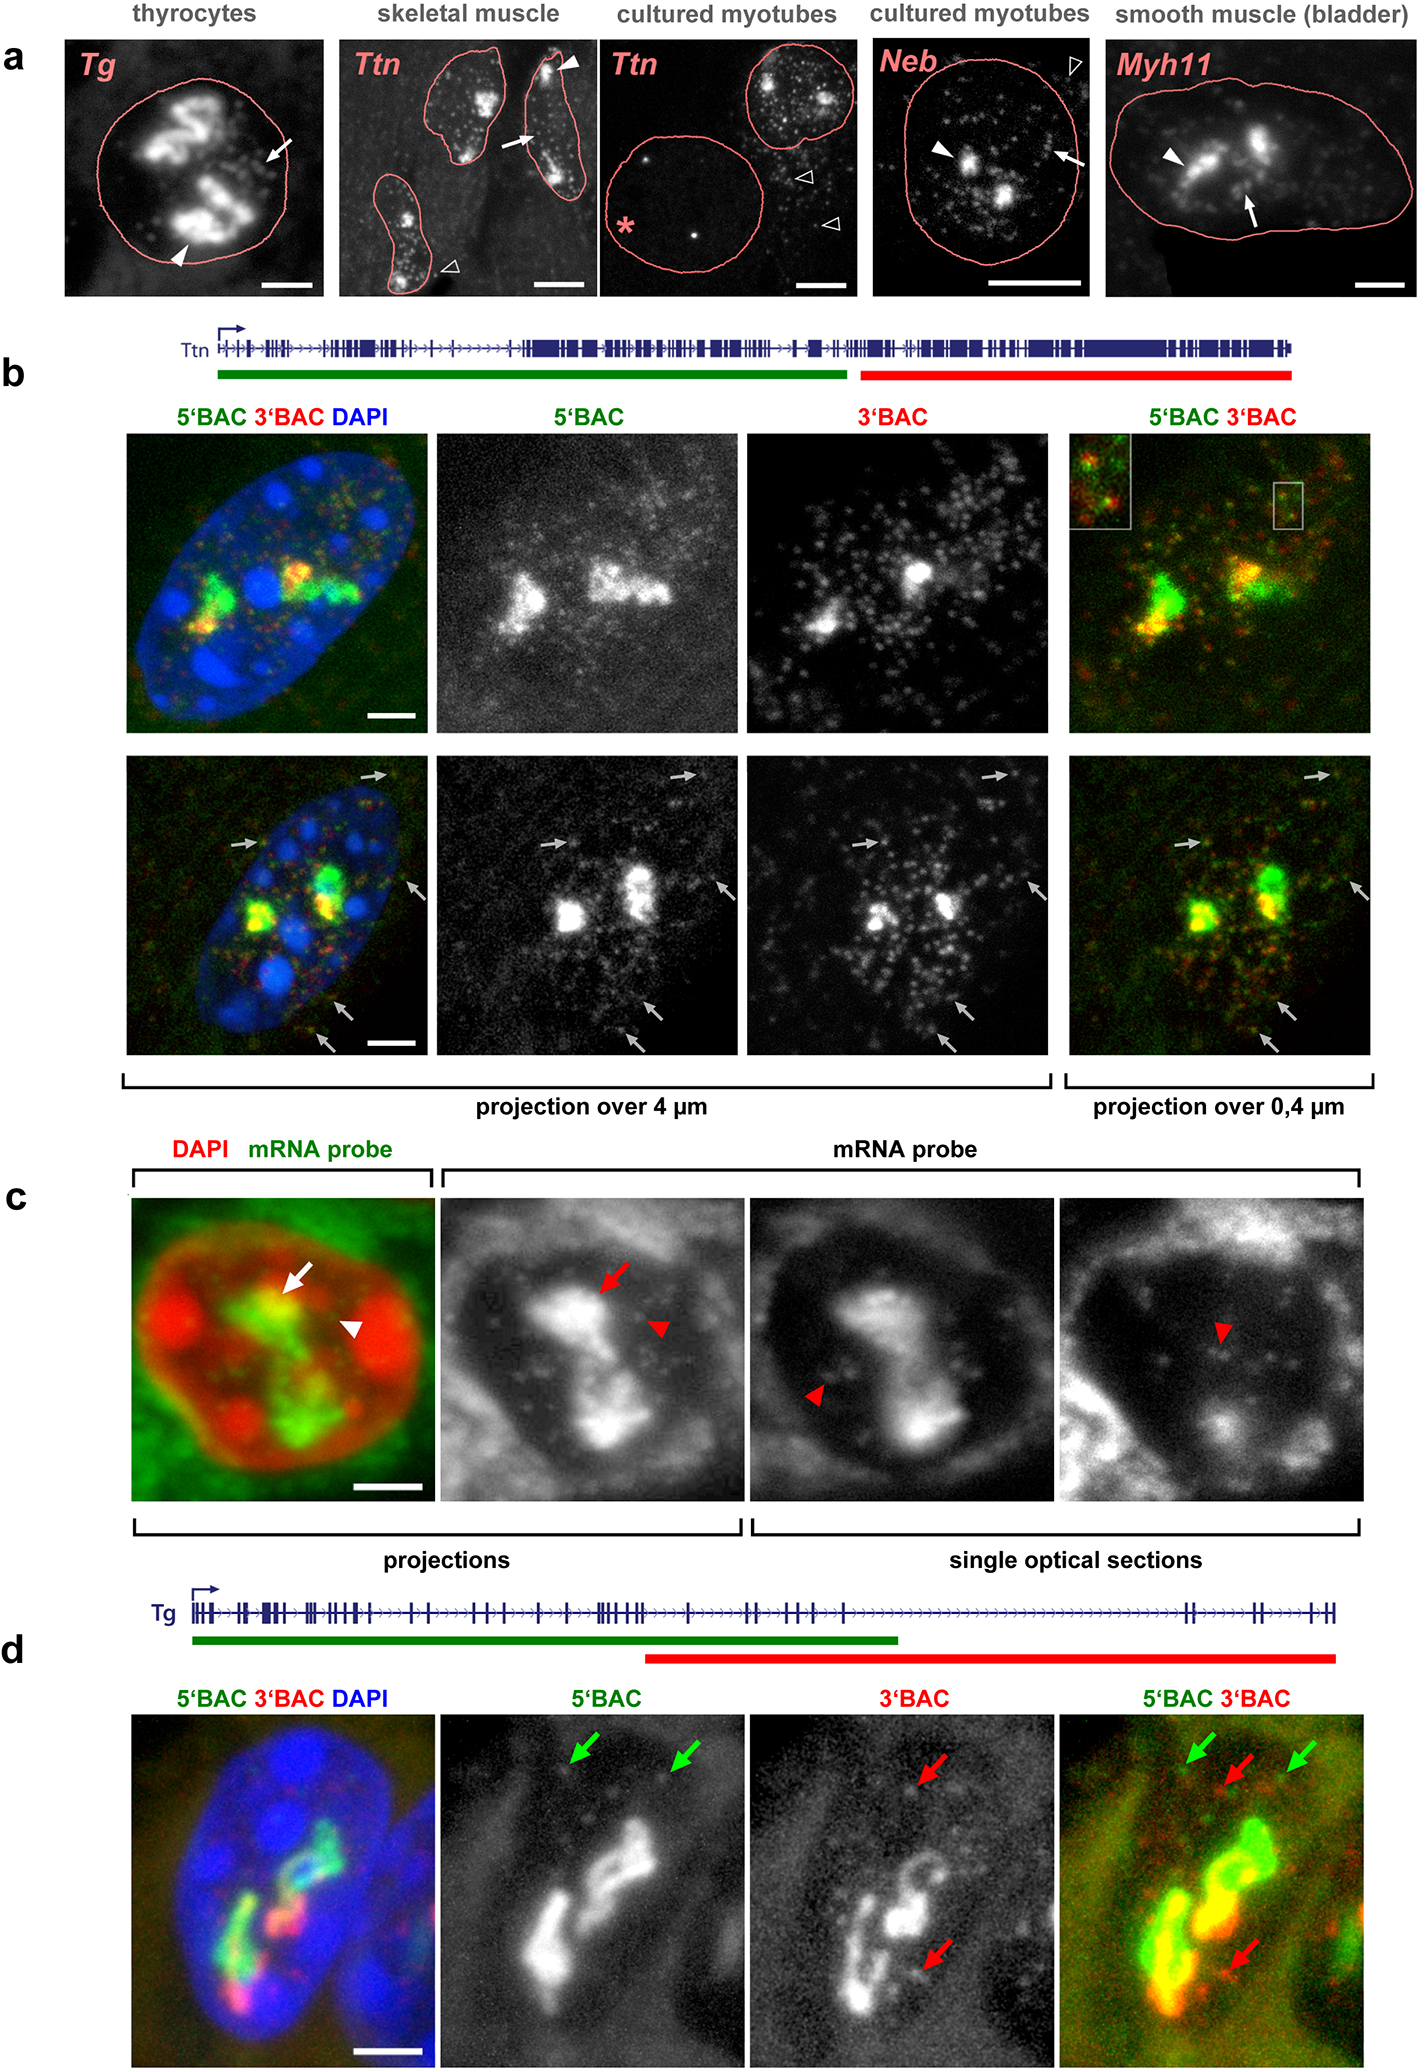
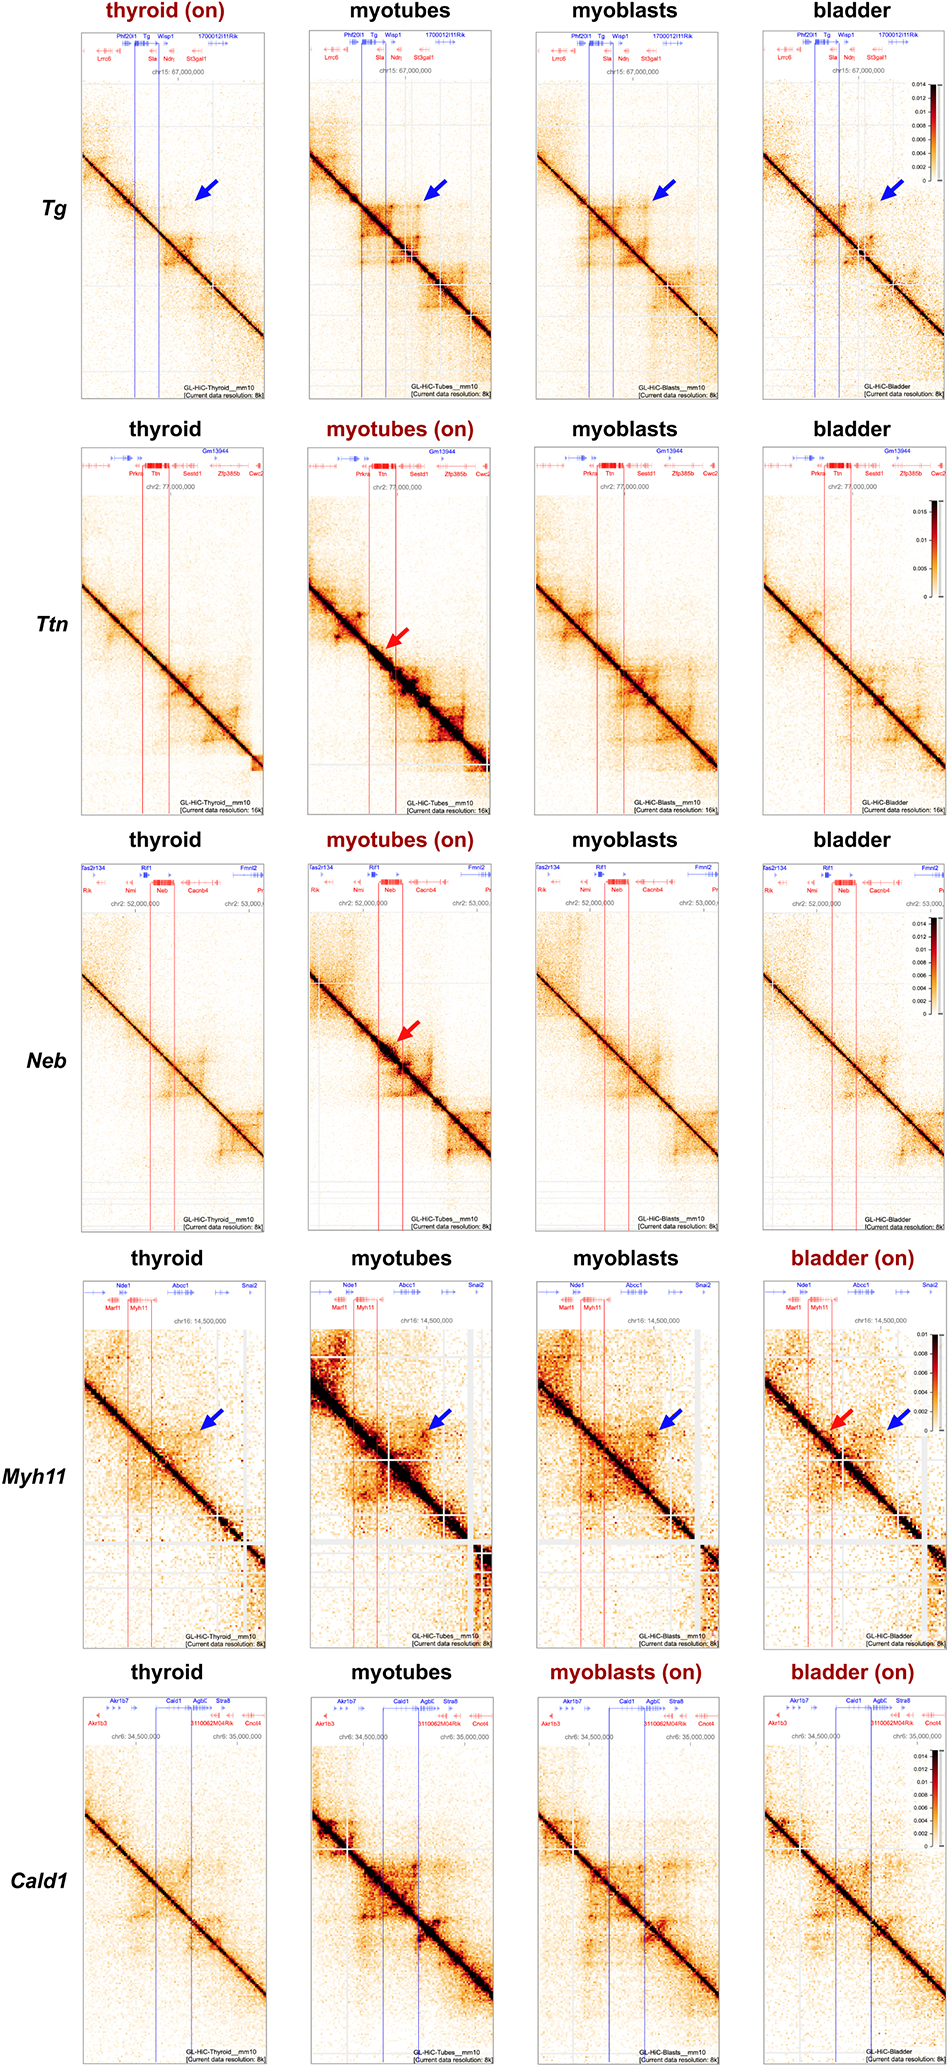
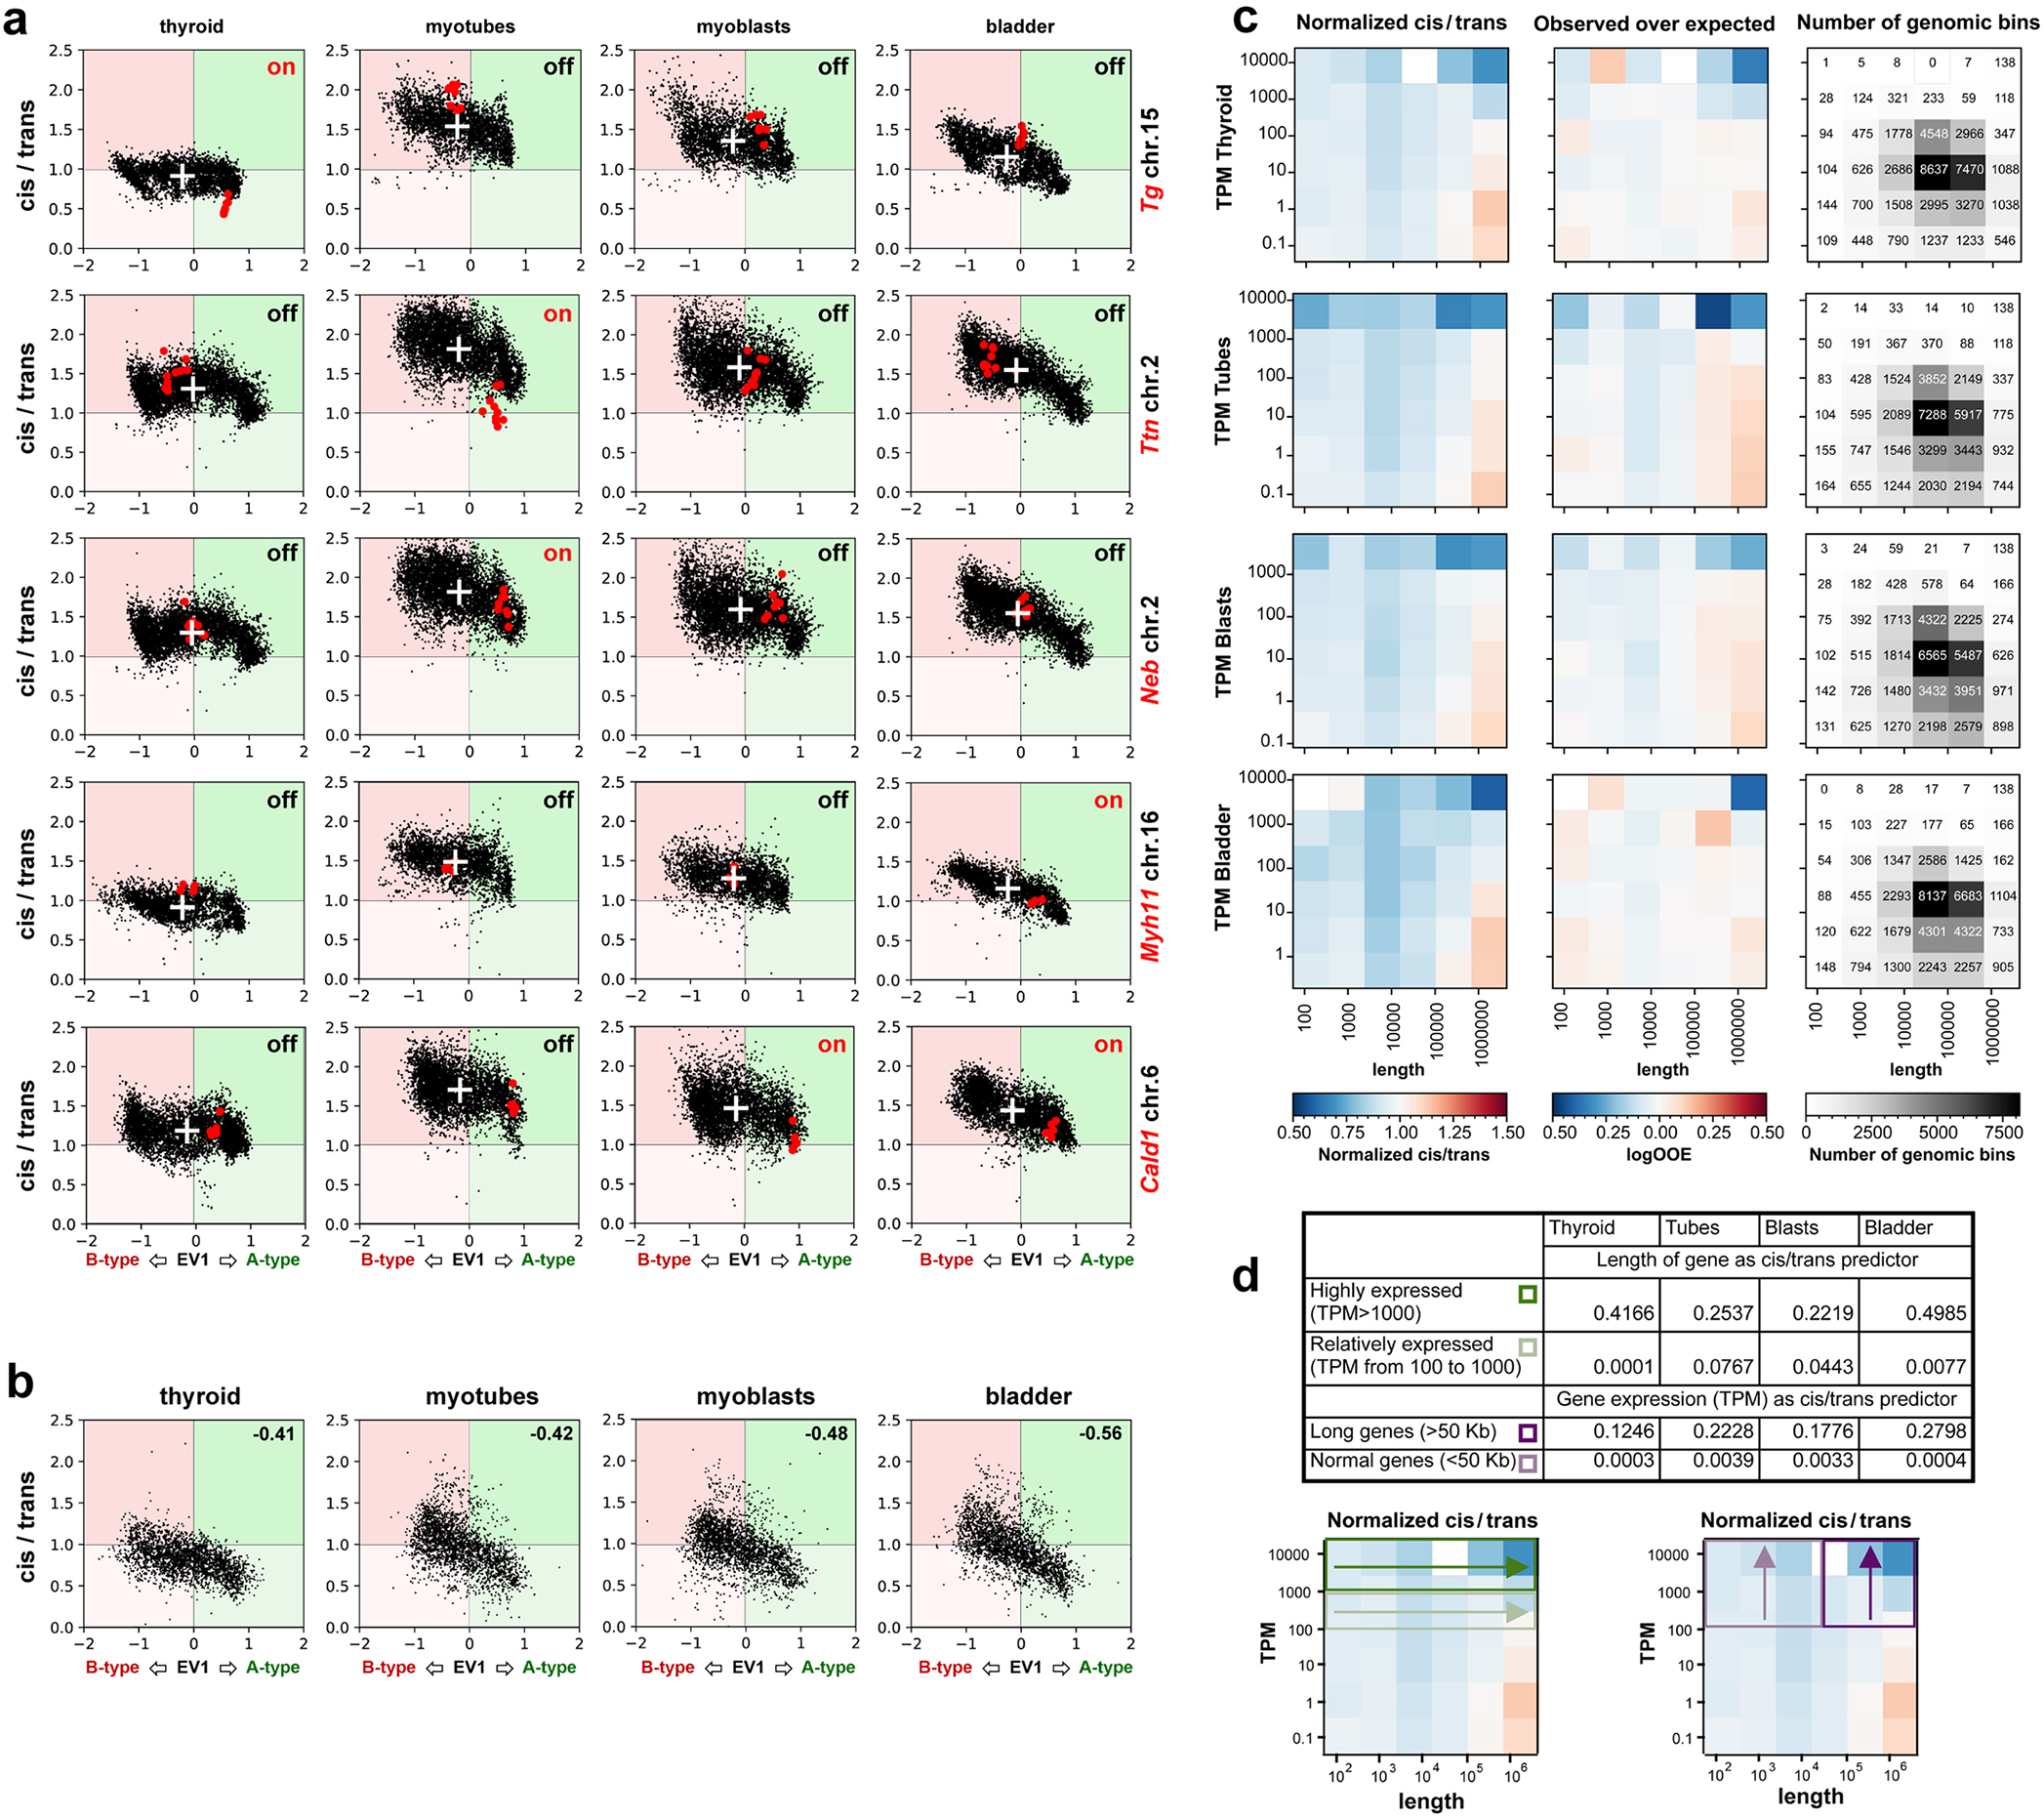
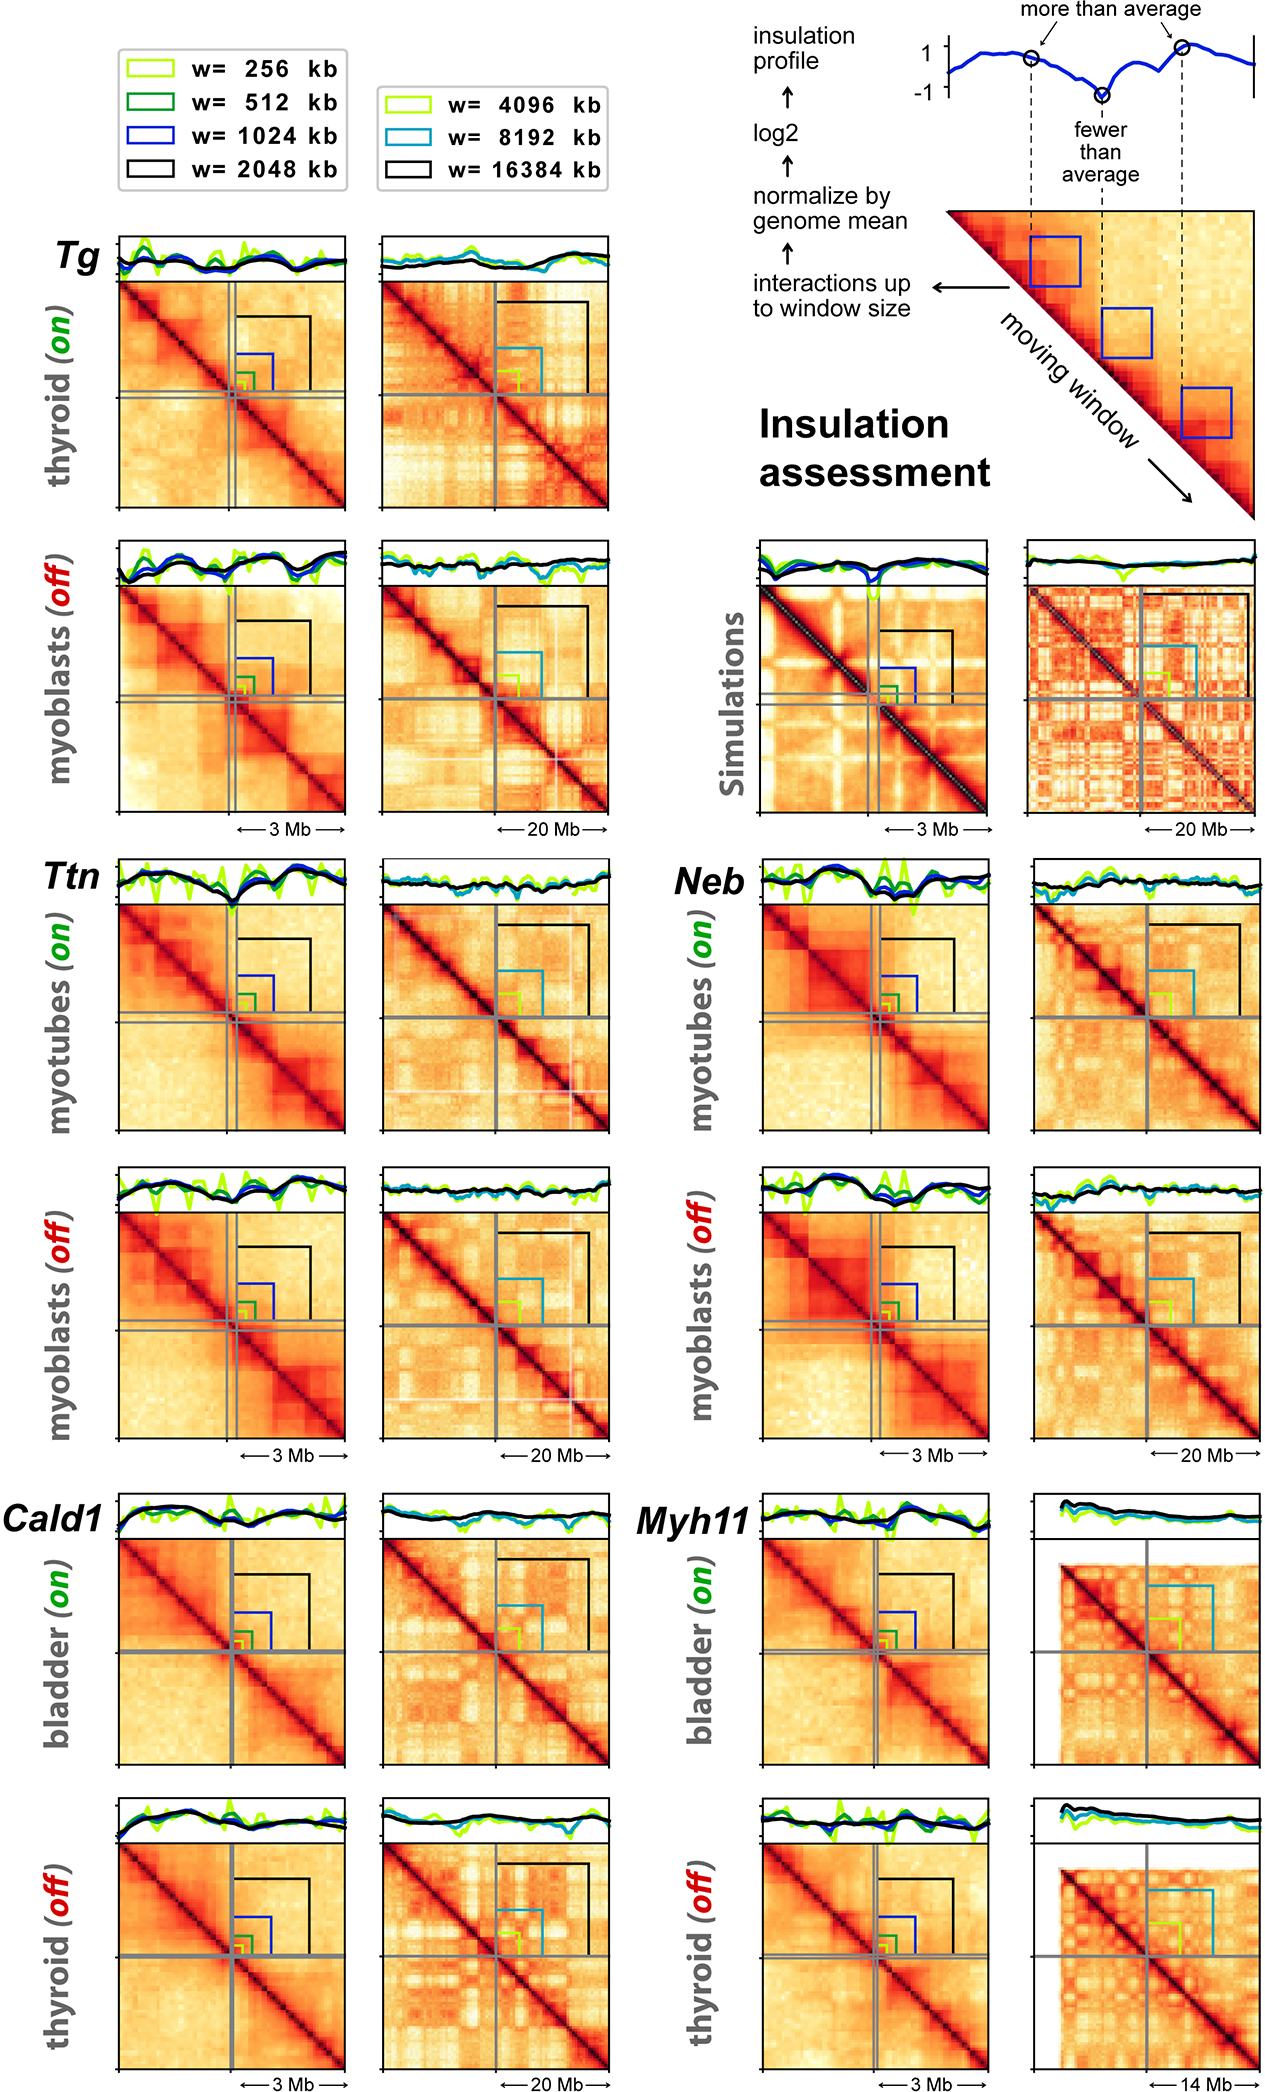
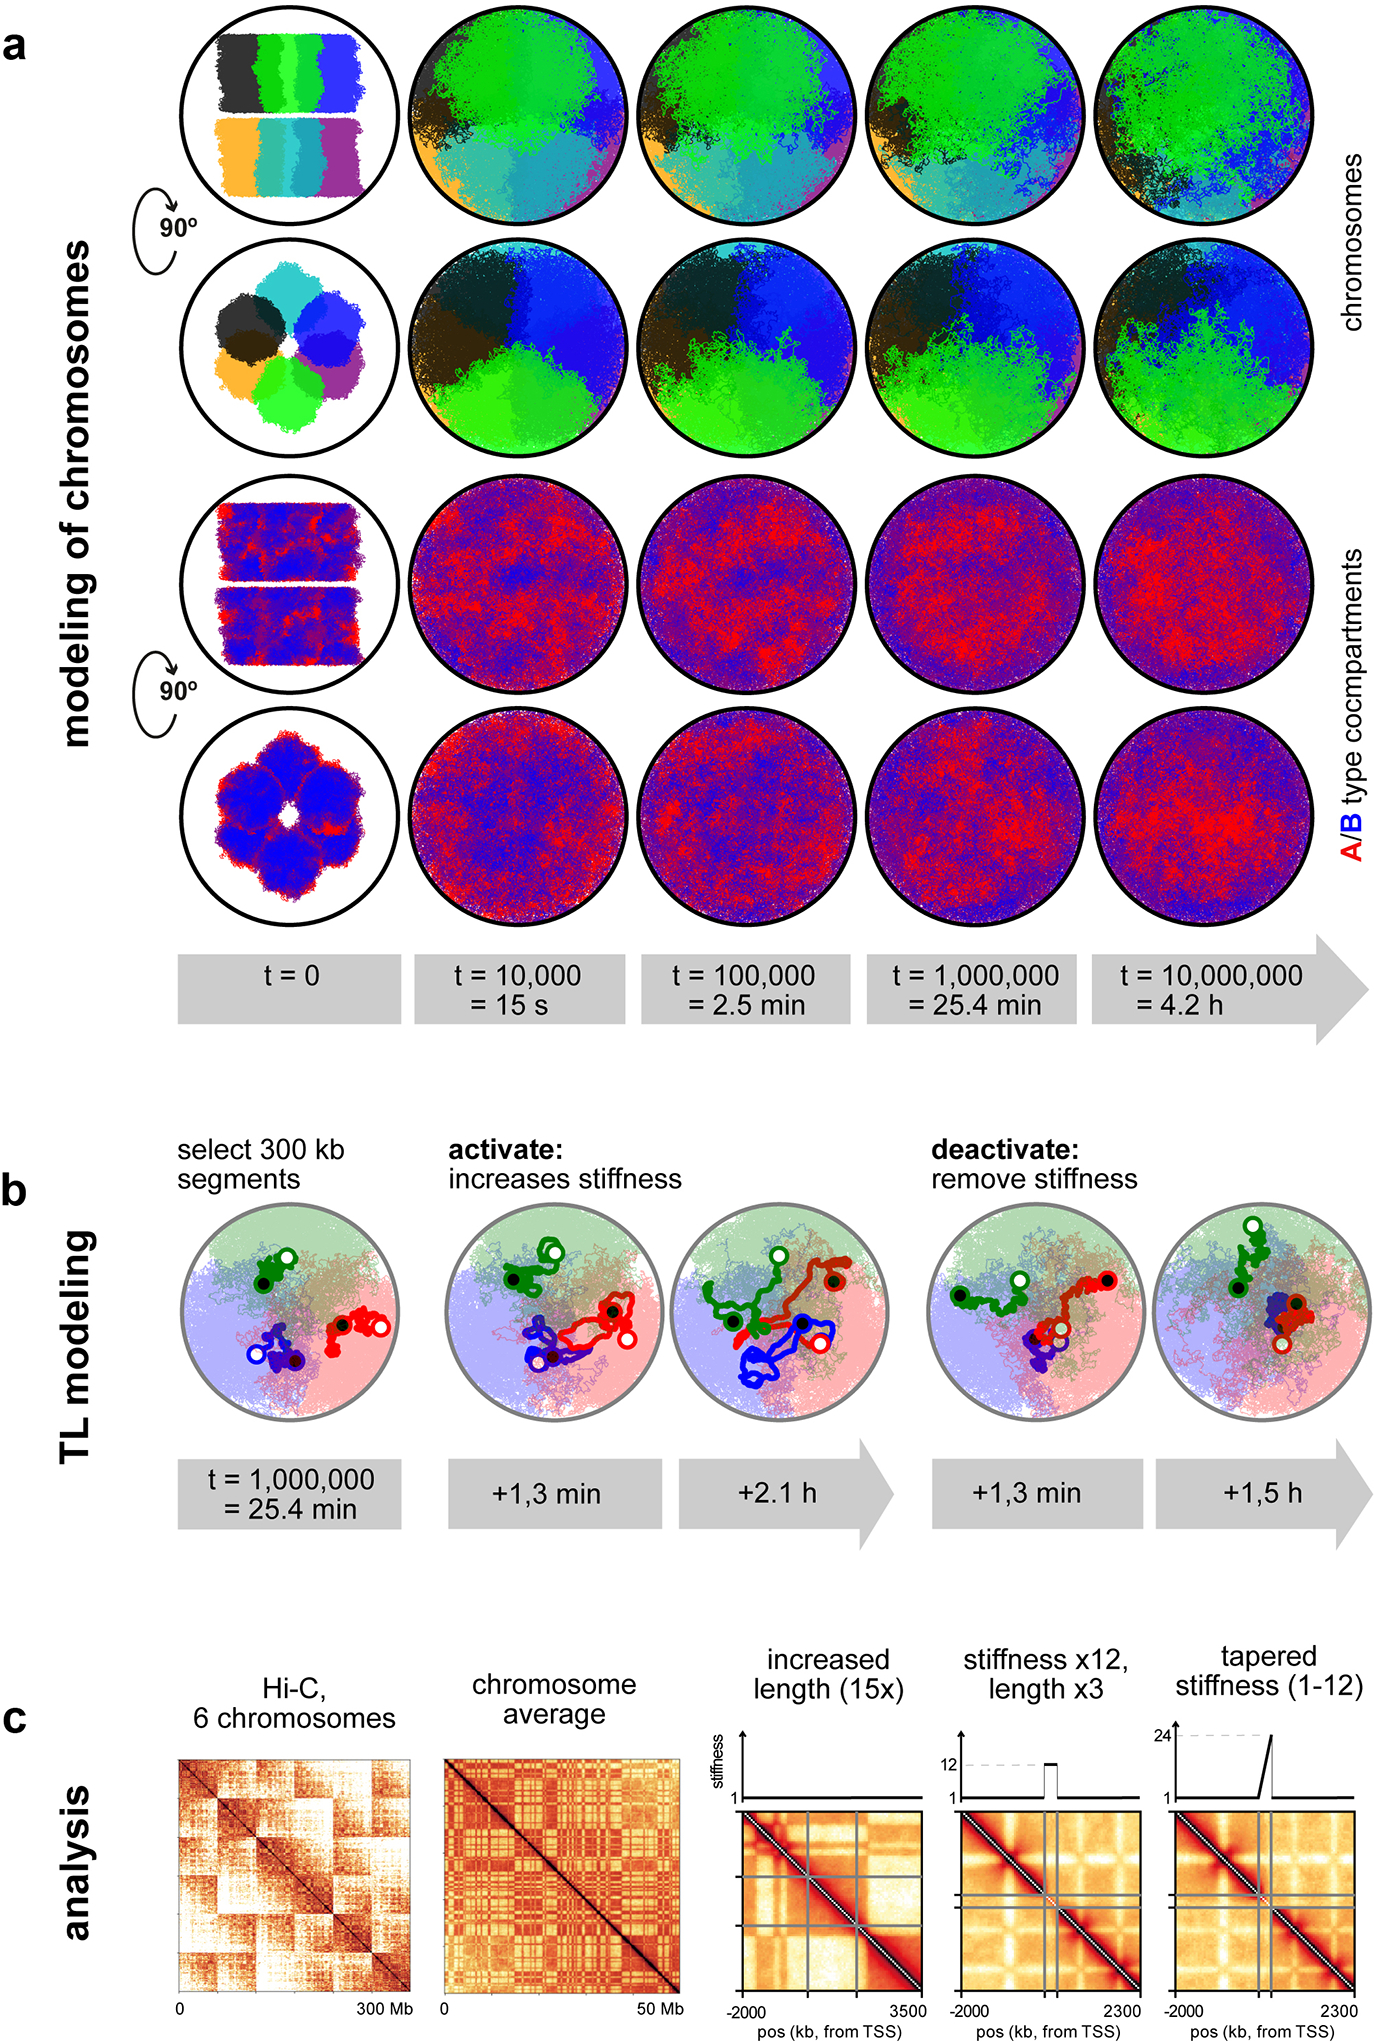
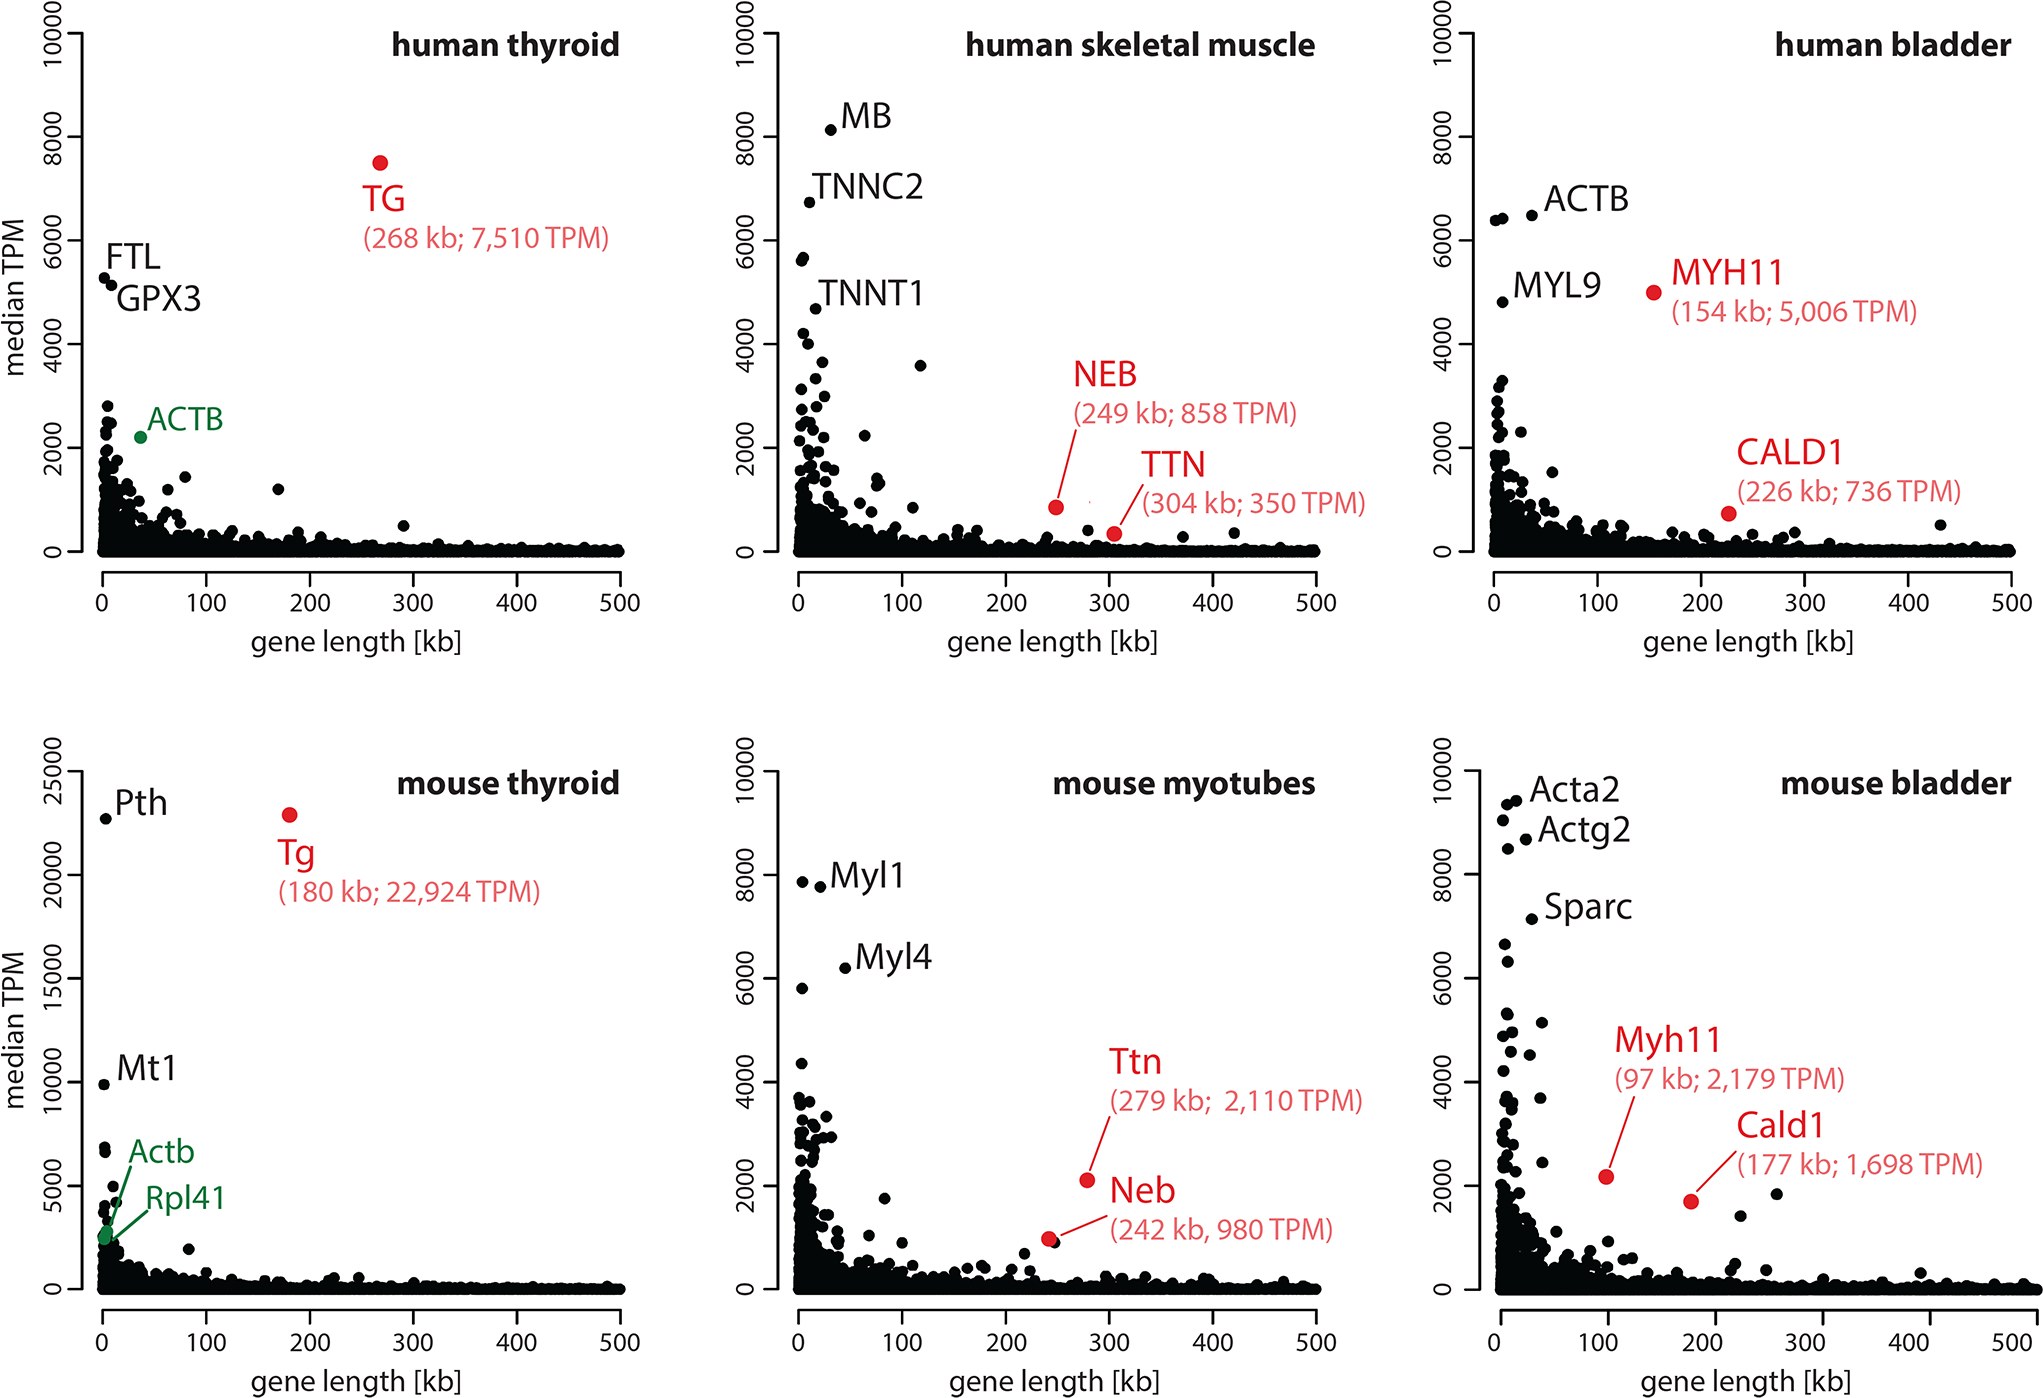
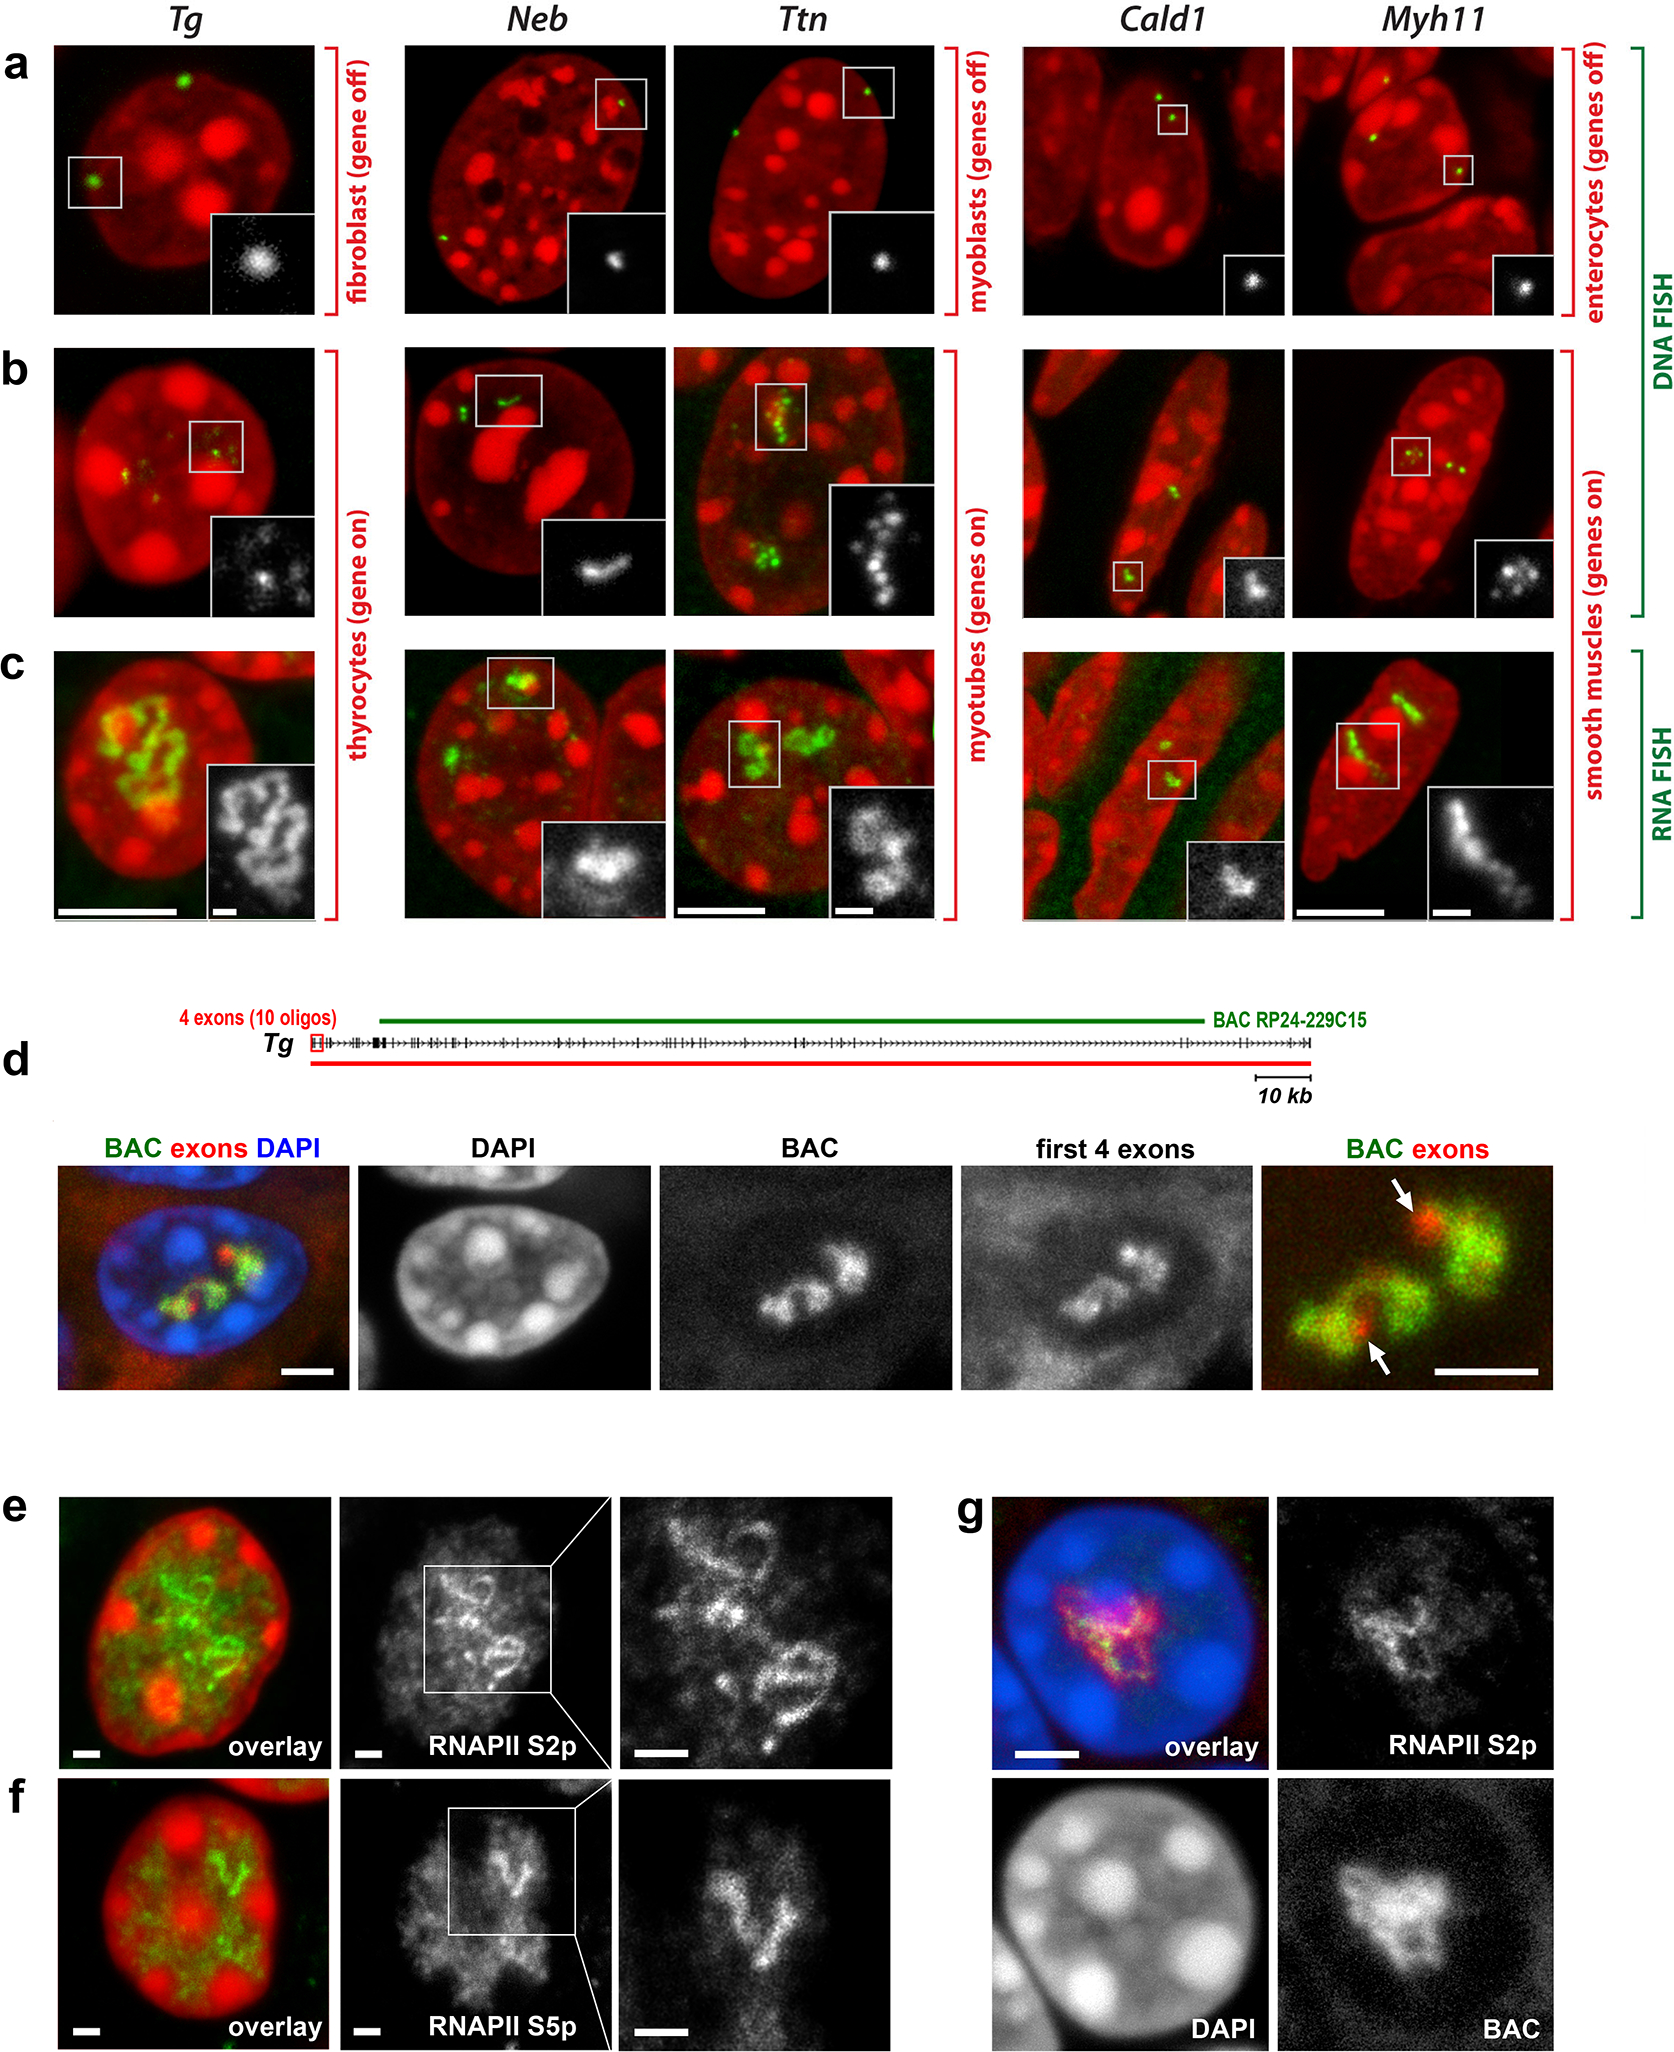
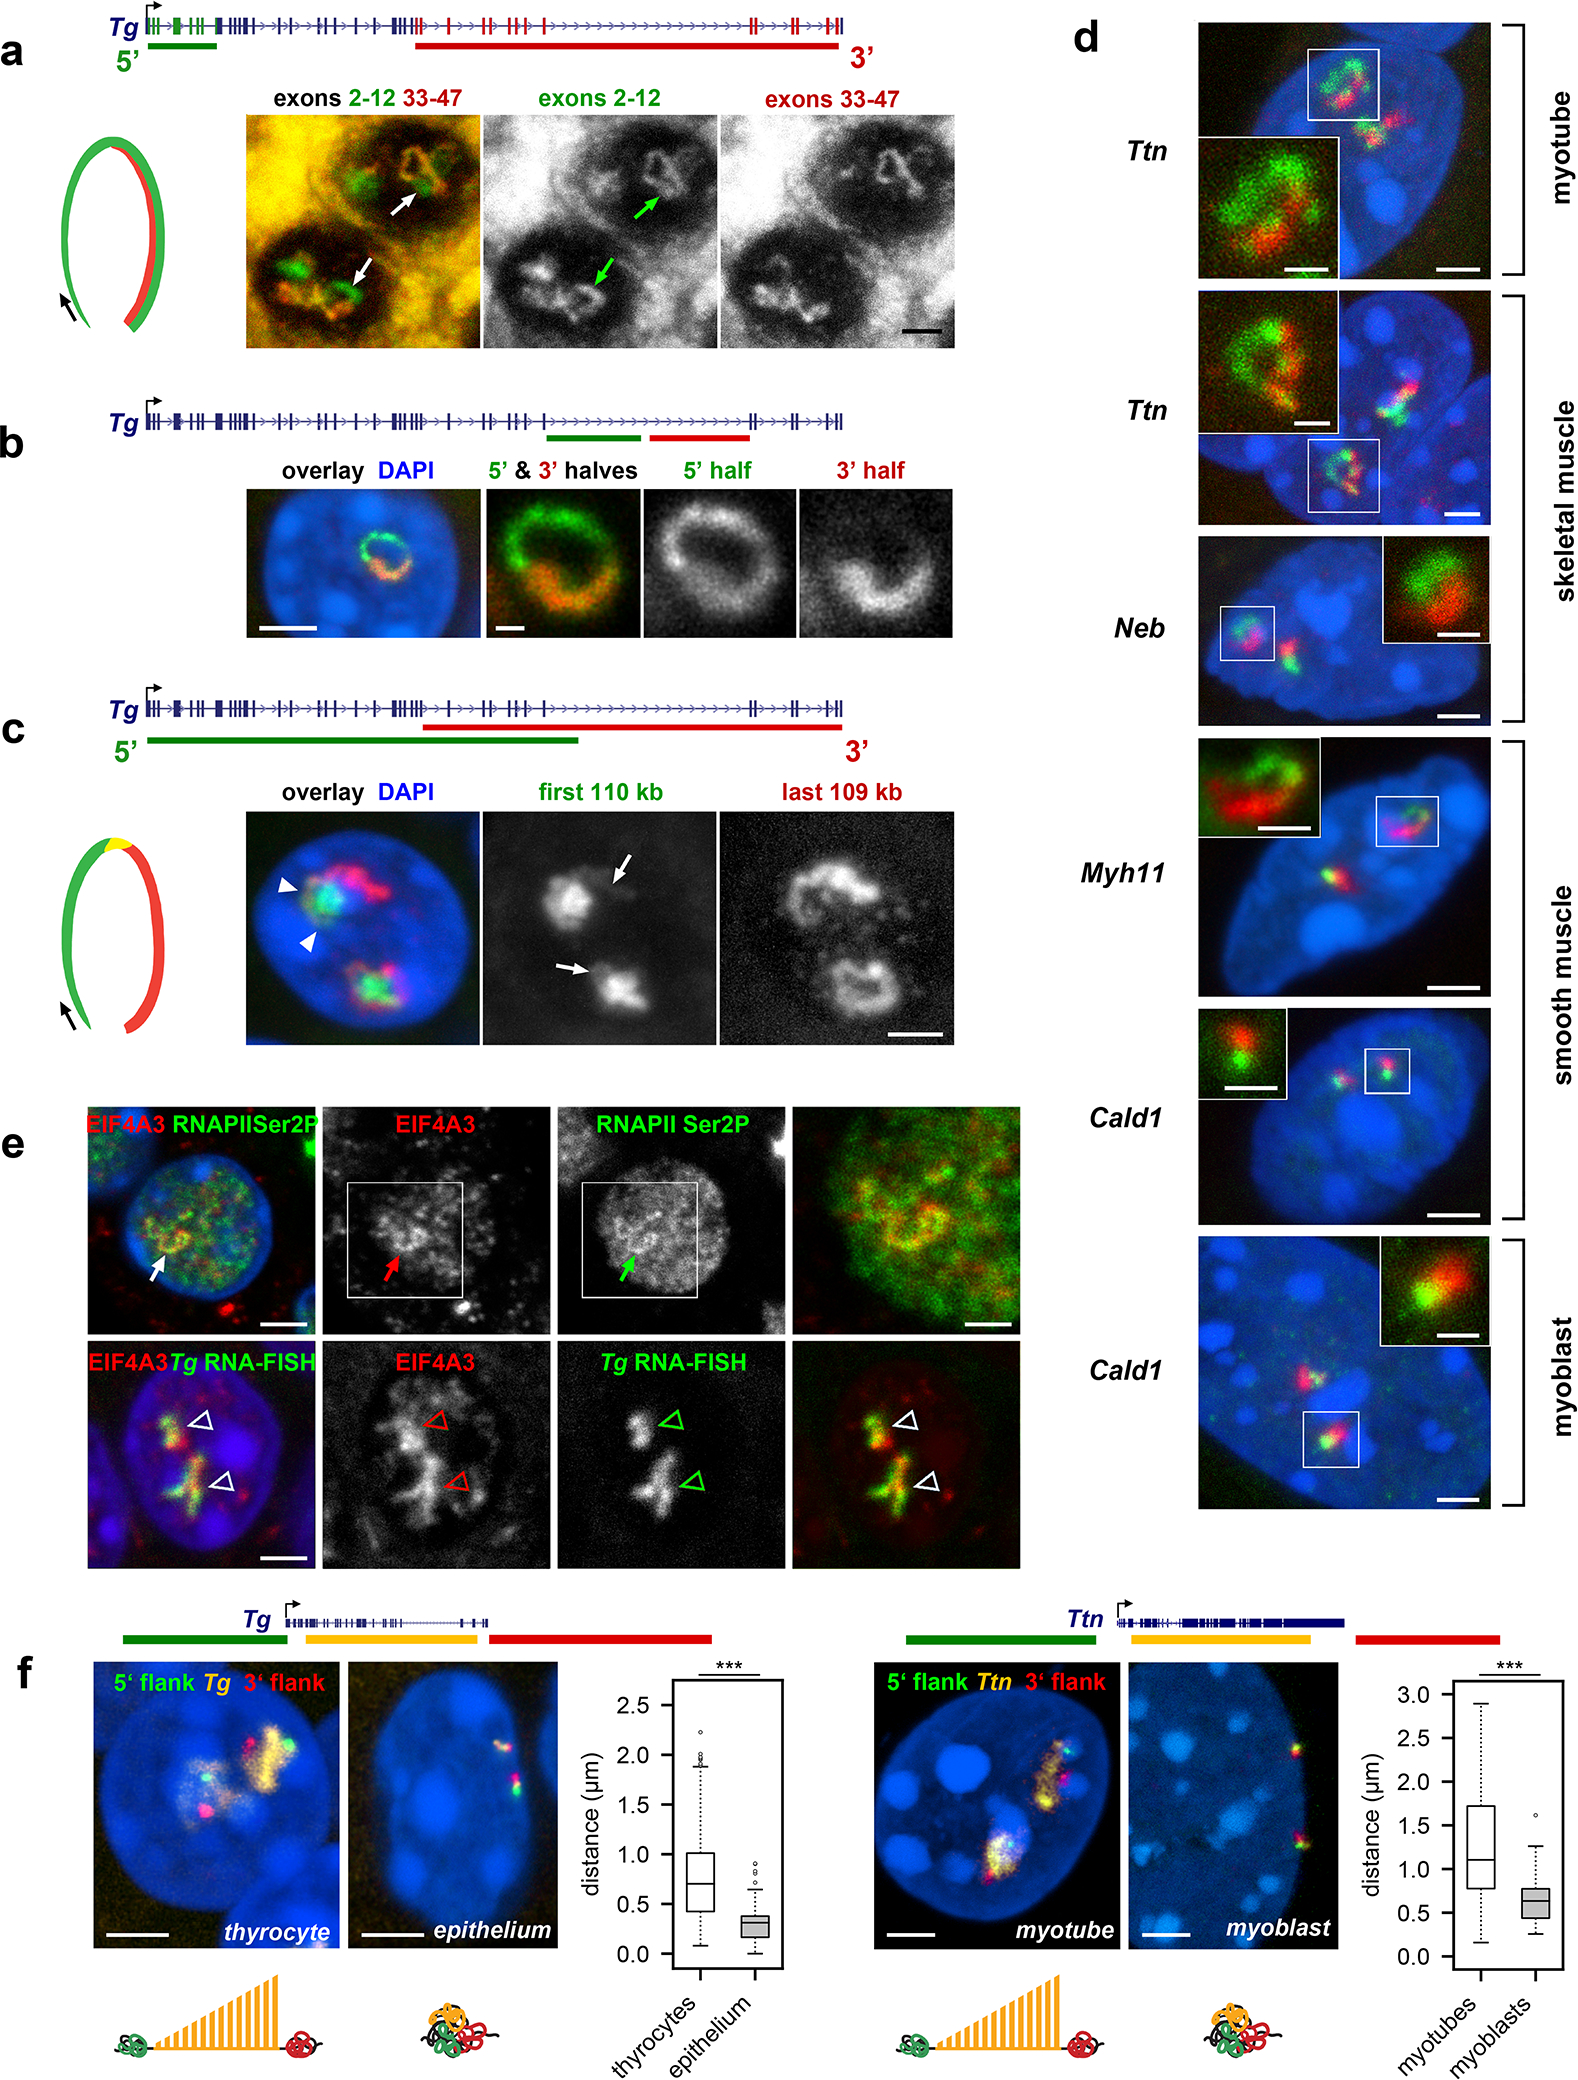
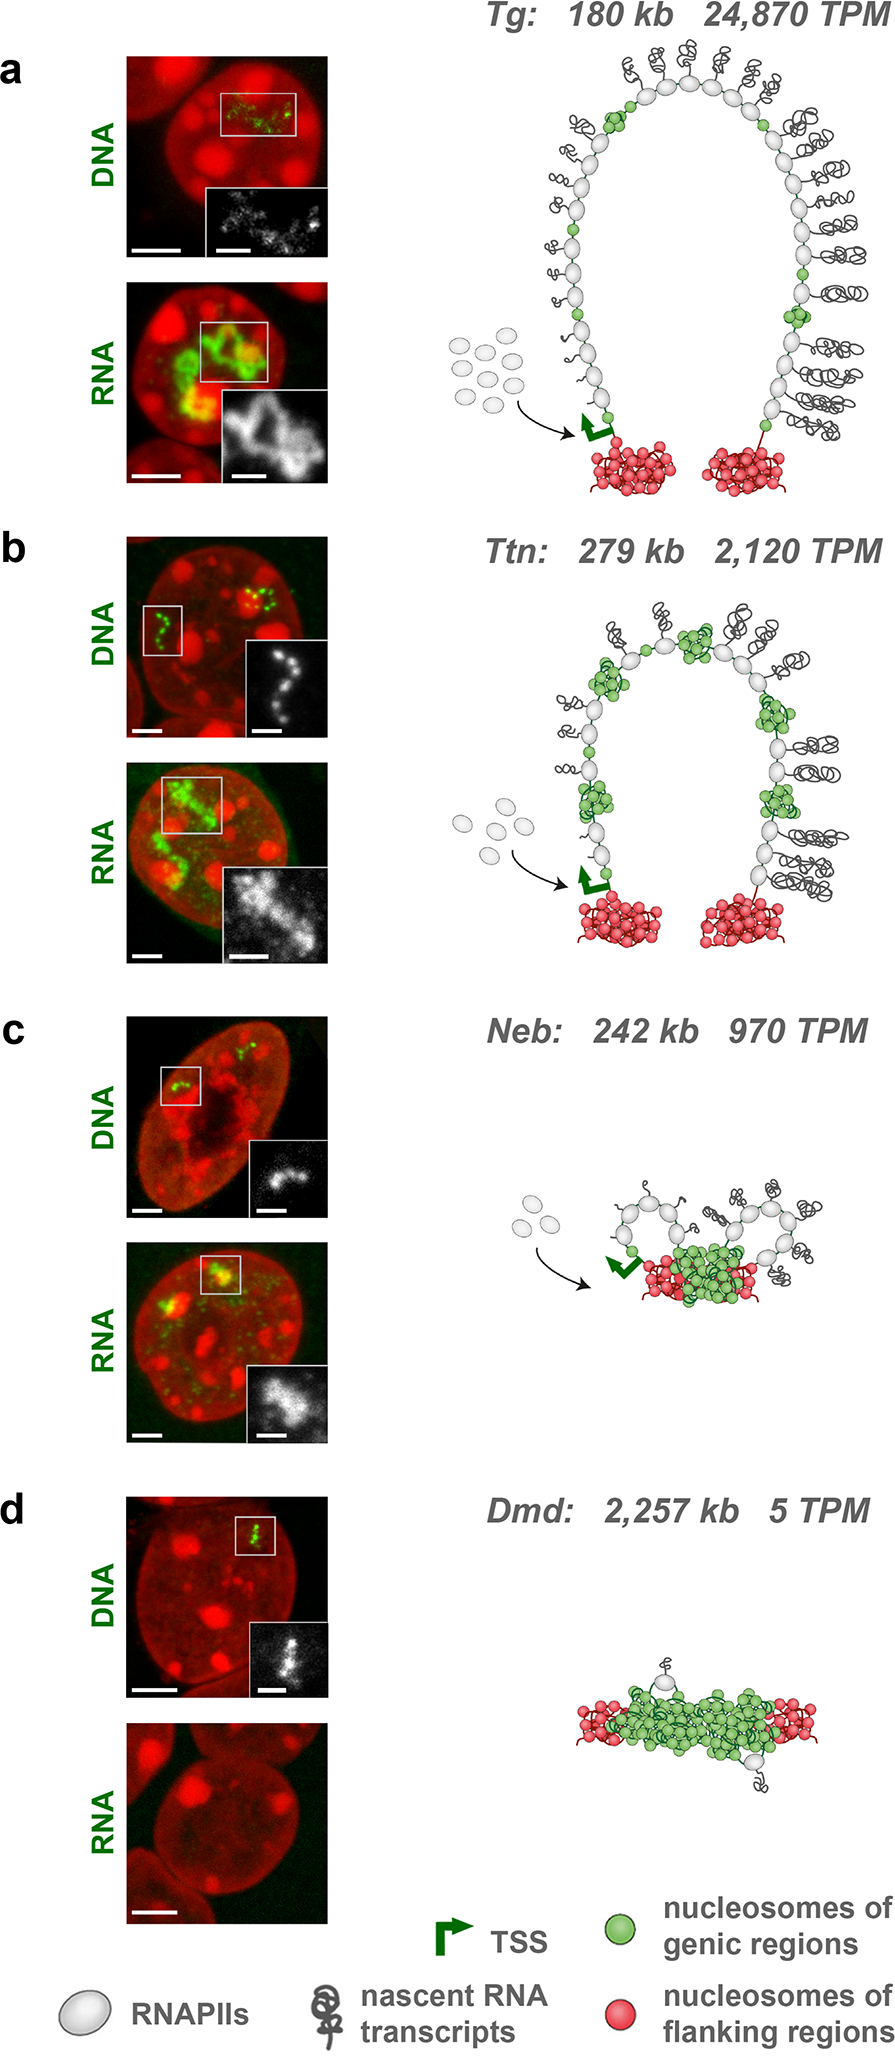
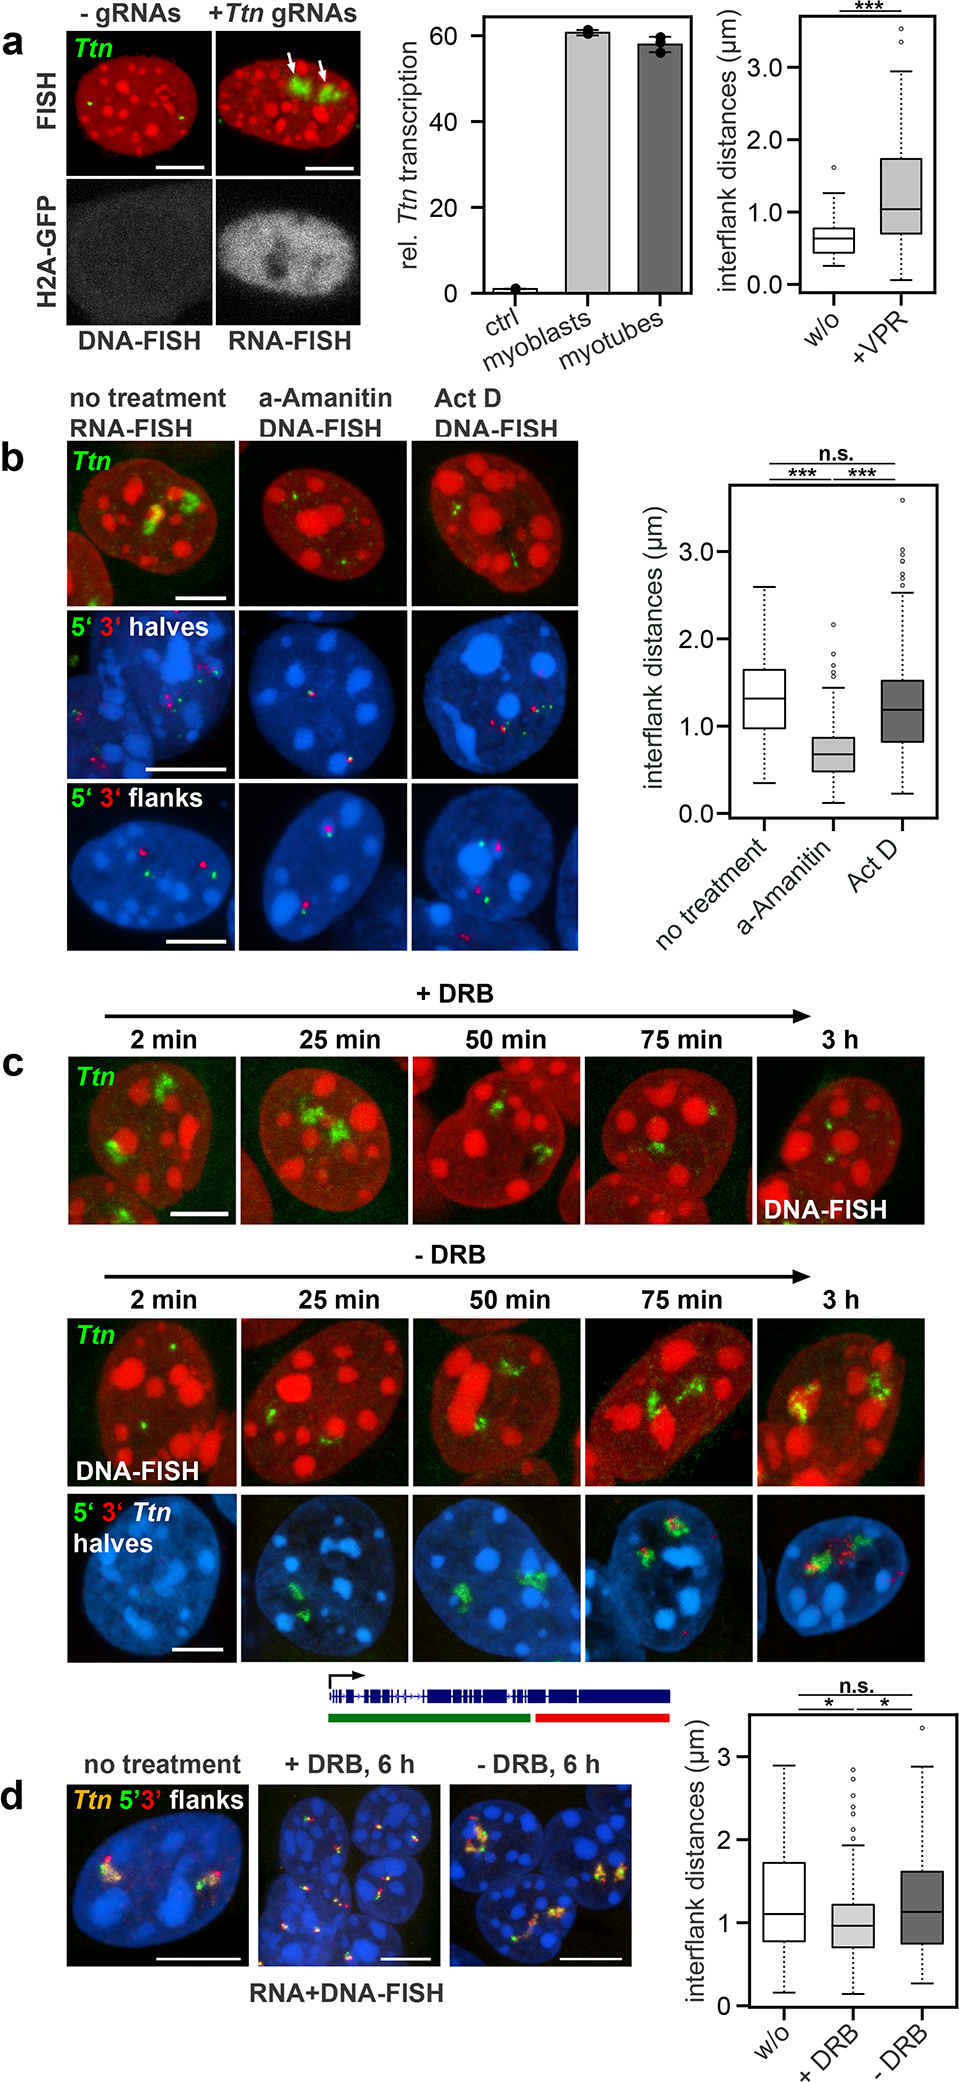
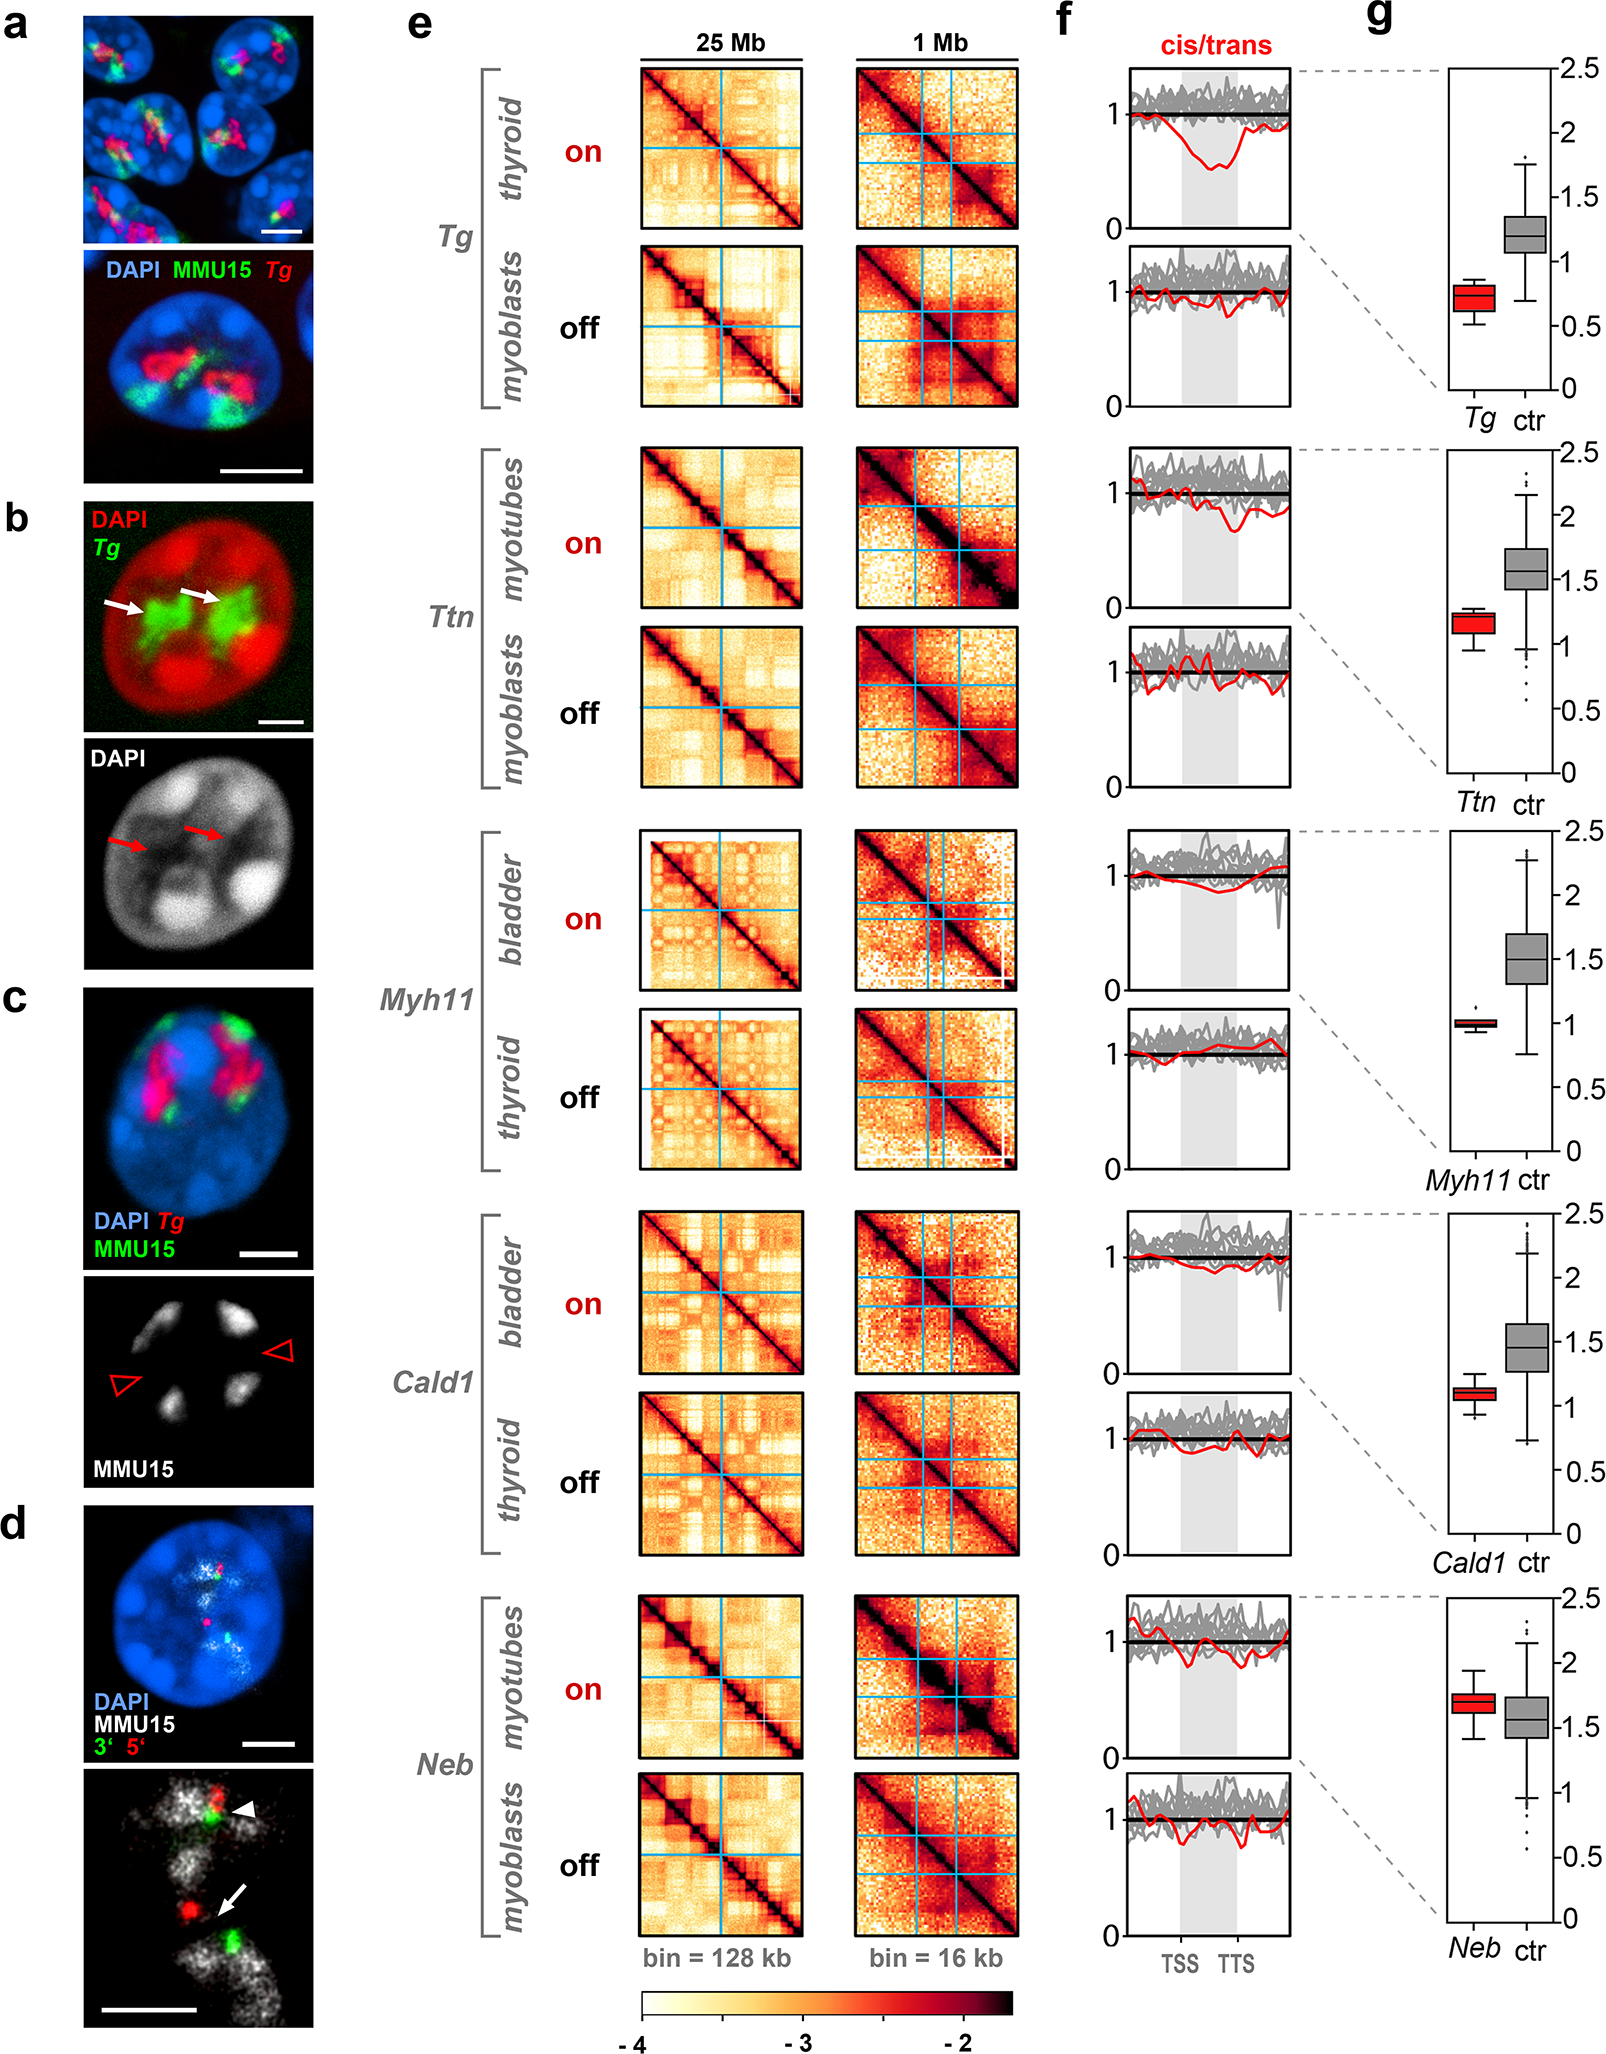
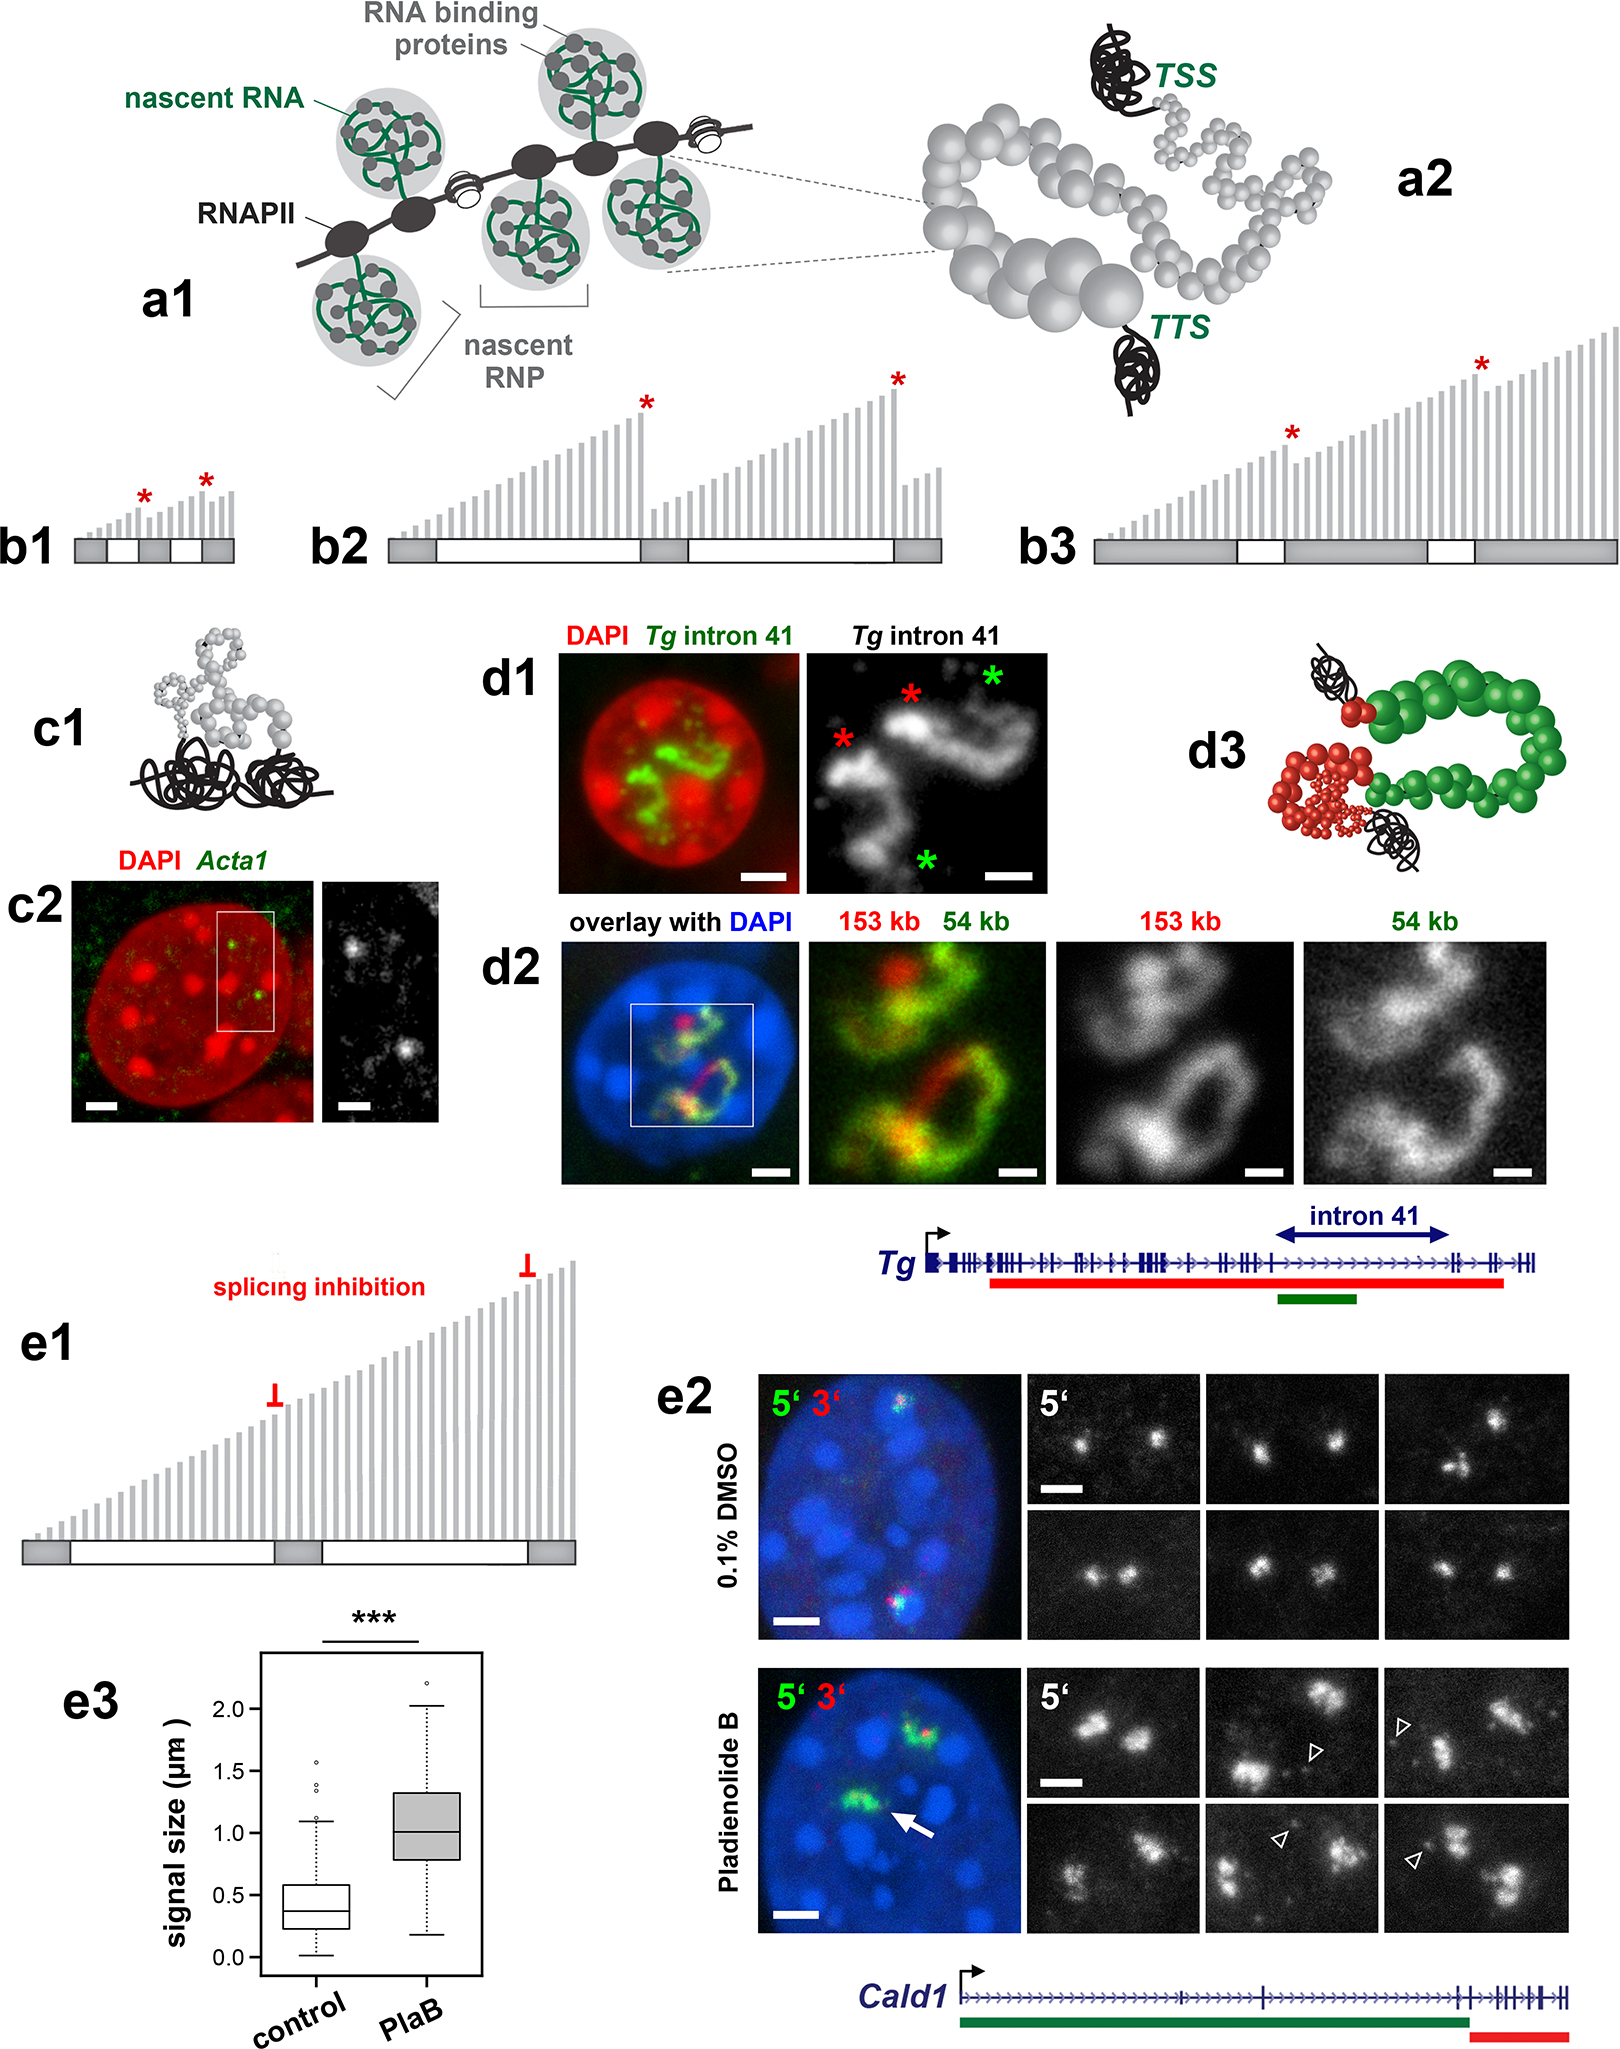
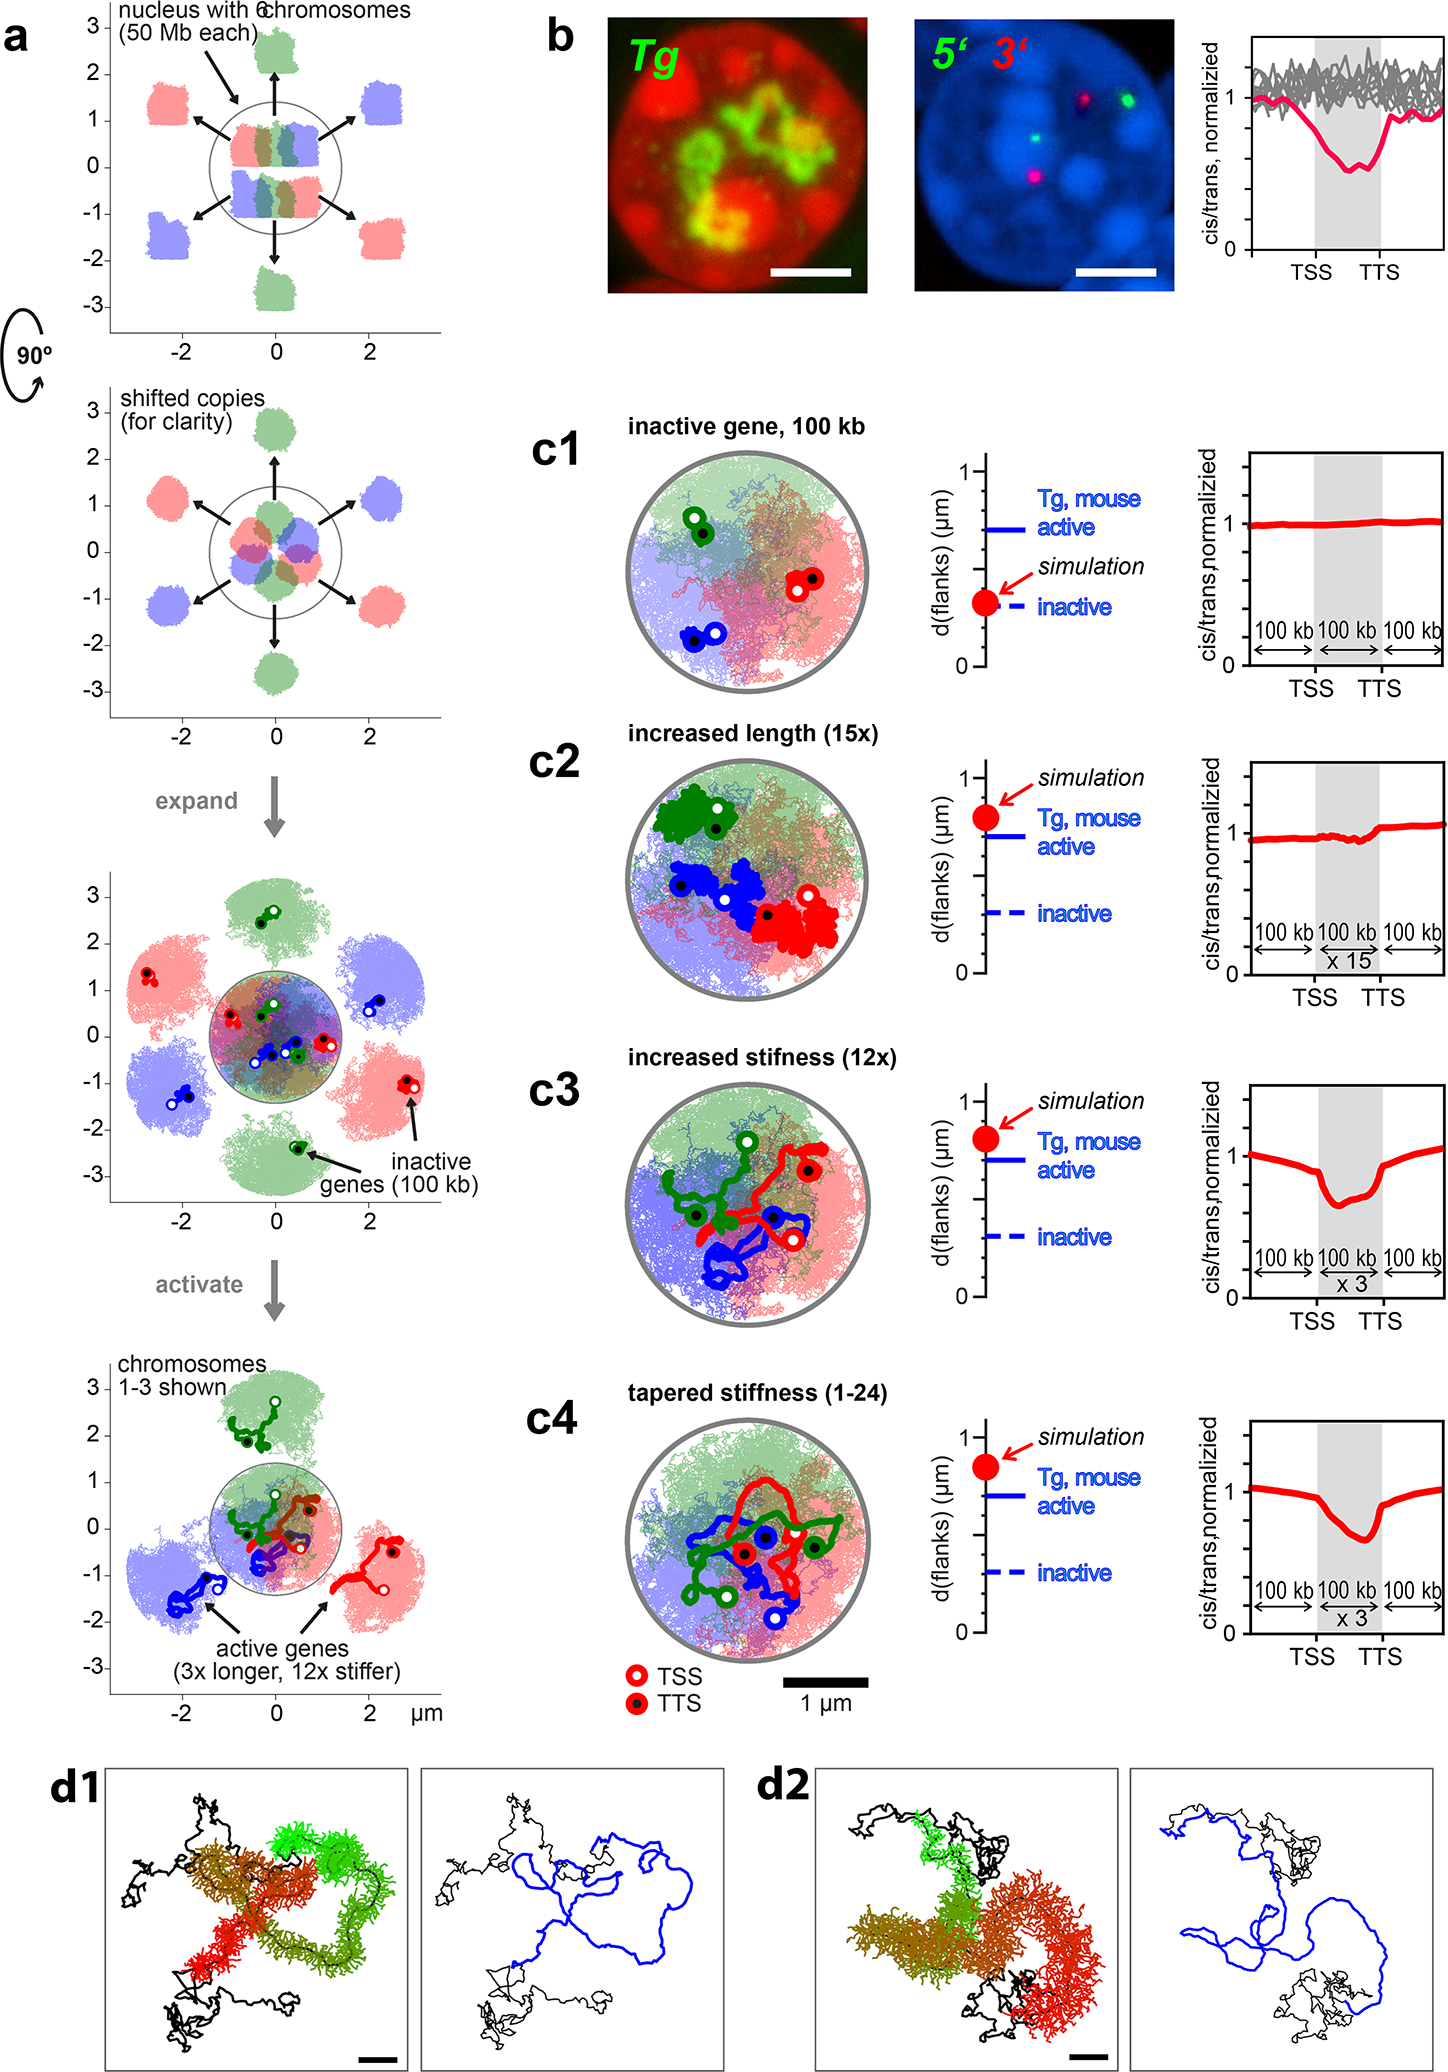
Despite the well-established role of nuclear organization in the regulation of gene expression, little is known about the reverse: how transcription shapes the spatial organization of the genome. Owing to the small sizes of most previously studied genes and the limited resolution of microscopy, the structure and spatial arrangement of a single transcribed gene are still poorly understood. Here we study several long highly expressed genes and demonstrate that they form open-ended transcription loops with polymerases moving along the loops and carrying nascent RNAs. Transcription loops can span across micrometres, resembling lampbrush loops and polytene puffs. The extension and shape of transcription loops suggest their intrinsic stiffness, which we attribute to decoration with multiple voluminous nascent ribonucleoproteins. Our data contradict the model of transcription factories and suggest that although microscopically resolvable transcription loops are specific for long highly expressed genes, the mechanisms underlying their formation could represent a general aspect of eukaryotic transcription.


Conflict of interest statement

COMPETING INTERESTS STATEMENT

The authors declare no competing interests

Figures

Extended Data Fig. 1
Extended Data Fig. 1. Long genes are rare and expressed at lower levels than short genes
a, Analysis of gene length distribution within the human and mouse genomes showed that about 43% and 46% of all protein coding genes, respectively, have a length ≤20 kb and only 18% and 14% have a length of 100 kb or above. Bin size: 20 kb. Genes are annotated according to GENCODE. Only genes with a length <500 kb are shown. b, To select suitable genes for visualization with light microscopy, we studied gene expression profiles across 50 human tissues using the publicly available Genotype-Tissue Expression database (GTEx Consortium) and found that long genes, as a rule, are not highly expressed. For example, in liver (top) and brain (bottom) there were no expressed genes with both a length 100 kb and with a median expression ≥1,000 TPM. c, Comparison of RNAPII occupancy between short and long expressed genes. ChIP-seq with an antibody against the CTD of RNAPII in cultured mouse myoblasts (left) and in vitro differentiated myotubes (right). All genes, expressed (>1 TPM, blue) and silent (<1 TPM, red), were split into five categories according to their size. RNAPII density (Y-axis) is plotted against the respective position within the gene (X-axis); each gene is divided into 200 equally sized bins and genes from the same size category are aligned according to the bins. Expressed genes display a higher occupancy with RNAPII compared to non-expressed genes, especially in the TSS region. In the group of expressed genes, the RNAPII occupancy negatively correlates with gene length: the shorter the genes, the higher the RNAPII occupancy. d, Analysis of RNA-seq data for myoblasts (left) and myotubes (right). The median expression level is higher in groups containing shorter genes (<25 kb) and generally negatively correlates with gene length.
Extended Data Fig. 2
Extended Data Fig. 2. Visualization of the five selected genes in expressing and not expressing cells
a, The Tg gene is expressed in thyrocytes where both alleles form prominent TLs expanding into the nuclear interior. In neighboring cells with a silent Tg gene - parathyroid gland cells, tracheal chondrocytes, epithelial cells, fibroblasts and muscles - Tg is highly condensed and sequestered to the nuclear periphery. b, The Ttn gene is expressed in skeletal muscle (b1), heart muscle (b2) and myotubes differentiated from Pmi28 myoblasts in vitro (b3). Note that only muscle nuclei (solid arrowheads) exhibit TLs. In muscle fibroblasts (arrows) or undifferentiated cultured myoblasts (empty arrowheads), Ttn is condensed at the nuclear periphery. c, The Neb gene is expressed in skeletal muscles and cultured myotubes, although to a lesser degree than Ttn. Accordingly, it forms smaller TLs. Arrowheads indicate muscle nuclei; arrows indicate fibroblast nuclei with silent Neb. d, e, The Myh11 (d) and Cald1 (e) genes are expressed in smooth muscles of colon and bladder where they form TLs. Note that after RNA-FISH, only smooth muscles (arrowheads) but not the neighboring epithelial cells (arrows) exhibit TLs. In addition, Cald1 is expressed in cultured myoblasts and forms small TLs in these cells. As indicated above the panels, images display signals after either RNA-FISH (no tissue/cell DNA denaturation and no RNasing), or simultaneous detection of DNA and RNA (tissue/cell DNA denaturation but no RNasing). All images are projections of 1–3 μm confocal stacks. Scale bars for overviews of skeletal muscle, colon and bladder, 50 μm; for the rest of the panels, 5 μm. Data represent 100 in a,b3 and 10 in b1,b2,c-e independent experiments.
Extended Data Fig. 3
Extended Data Fig. 3. Structure and compaction of TLs
a, The internal structure of Tg and Ttn TLs is not resolvable after deconvolution (left) and high resolution microscopy (mid, right). b, Coiling and folding of TLs demonstrated in 50–70 nm thin resin sections. The upper panel shows thin sections through nuclei of thyrocytes stained with DAPI (red) and Tg TLs detected by RNA-FISH (green). The lower panel shows 2-fold close-ups of the corresponding Tg TL as grey-scale images. Note curling and twisting of the loops. Images are single optical sections. c, To assess the compaction level of TLs, the contour length of three Tg TL regions was measured on projections after RNA-FISH. The track of the Segmented Line tool in ImageJ, used for measurements, is shown on the right panel. Tg regions of 153 kb, 109 kb and 62 kb had a similar compaction level and measured 9 μm, 6 μm and 4 μm, respectively. These values correspond to a nucleosomal structure of chromatin (table on the right). However, since Tg TLs display internal structures and since the measurements were performed on maximum intensity projections, the compaction level of Tg TLs is probably overestimated. Scale bars: a, 2 μm; b,c, 1 μm. Data represent 3 independent experiments in a-c.
Extended Data Fig. 4
Extended Data Fig. 4. TLs manifest co-transcriptional splicing
Two sequentially positioned introns were labeled with oligoprobes encompassing 1.2 – 5 kb. The schematics above the panels depict the distribution of oligoprobes (green and red rectangles), labeled introns (green and red lines) and positions of BAC probes used as references (grey lines above genes). After RNA-FISH the intron probes label TLs only partially and sequentially. Since the 5’ and 3’ intron signals do not overlap, the 5’ introns are spliced before the 3’ introns are read. For instance, in Cald1, introns 1 and 3 are separated by intron 2, suggesting that the “green” intron 1 is spliced out before polymerases reach the “red” intron 3, most likely after RNAPII runs over the 3’ splice-site of the first intron. Projections of confocal sections through 2 – 3.5 μm. Scale bars: 2 μm, in close-ups, 1 μm. Data represent 2 independent experiments.
Extended Data Fig. 5
Extended Data Fig. 5. Close association of TLs with splicing factors
Splicing factors, SON and components of exon-junction complexes EIF4A3 and RBM8A (Y14), are either co-stained with RNAPII Ser2P (the two top rows) or visualized together with TLs in immuno-FISH (the rest of the rows). Note that signals of TLs and splicing factors colocalize only partly. The myotube nucleus is tetraploid and thus exhibits 4 Ttn RNA signals. Images are partial projections of either 0.6 μm (for immunostaining) or 0.9 μm (for immuno-FISH). Scale bars: 2 μm, in close-ups, 1 μm. Data represent 3 independent experiments.
Extended Data Fig. 6
Extended Data Fig. 6. Nucleoplasmic granules in cells with highly expressed long genes
a, RNA-FISH reveals numerous nucleoplasmic granules (arrows) surrounding TLs (arrowheads) after hybridization with genomic probes. For clarity, only RNA signals are shown within the outlined nuclei. Empty arrowheads point at similar granules in the myotube cytoplasm. The asterisk marks the nucleus of a myoblast not expressing Ttn. b, In muscles and cultured myotubes, the majority of granules (81%) are double-labeled with probes for the 5’ and 3’ halves of Ttn and found in both the nucleoplasm and cytoplasm (arrows on the lower panel), thus likely representing Ttn mRNAs. Remarkably, the 5’ and 3’ signals are spatially distinguished within the granules (insertion) presumably due to the exceptionally long Ttn mRNA of ca 102 kb. The observed separation of the 5’ and 3’ halves of Ttn mRNA is in agreement with previously described structures of cytoplasmic mRNPs. c, In difference to Ttn, mRNAs of Tg, Neb, Cald1 and Myh11 genes are short (4 – 20 kb) and can be only detected with oligoprobes specifically hybridizing to all exons. Thus the oligoprobe for all 48 Tg exons hybridizes to nRNAs decorating TLs (arrows) and also labels multiple nucleoplasmic granules (arrowheads). d, The majority of the other thyrocyte nucleoplasmic granules are labeled with either 5 (green) or 3 (red) genomic probes with only 10% of granules being double-labeled. The brightness of the RNA-signal on the most right panel is purposely increased to highlight nucleoplasmic granules (green and red arrows). Such differential labeling of nucleoplasmic granules, exemplified here for thyrocytes, is characteristic for other studied genes and strongly suggests that these granules represent accumulations of excised introns. The distribution of the used BAC probes in respect to the studied genes are depicted above the image panels. Scale bars: a, 2 μm for Tg and Myh11, 5 μm for Ttn and Neb; b, c, d, 2 μm. Data represent 10 in a,b and 3 in c,d independent experiments.
Extended Data Fig. 7
Extended Data Fig. 7. Fragments of Hi-C maps around TL-forming genes in corresponding tissues and cells
Each row shows the same region around indicated genes in different tissues or cells; “on” indicates a cell type where a gene is active, allowing to compare changes associated with TL formation. Blue arrows indicate loss of TAD borders and associated dots of CTCF-CTCF enrichment for expressed Tg and Myh11. Red arrows indicate an increase in self-interactions within genes visible for expressed Ttn, Neb and Myh11.
Extended Data Fig. 8
Extended Data Fig. 8. Cis-to-trans contact ratios and A/B compartments in studied cells
a, Cis-to-trans ratios and compartment affiliations for 5 studied genes. The scatter plots are computed from the compartment profiles and the cis-to-trans ratio profiles of the chromosomes harboring the genes at a bin size of 32 kb. Genes of interest are highlighted with red dots; the white crosses mark the chromosome means of the compartment and cis-to-trans ratio profiles. Tg, Ttn, Neb and Myh11 move from B to A compartment upon their activation; Cald1 is found in A compartment not only in myoblasts and smooth muscle, as expected, but also in thyroid and myotubes. This is in agreement with the low Cald1 expression also in thyroid samples enriched in blood vessels and in samples of myotubes that normally include up to 20% of myoblasts, as well as with localization of Cald1 in a gene-dense region of chromosome 6. Note that the Ttn and Neb genes tend to be in A-compartment, although to a lesser degree, also in myoblasts, which can be explained by the presence of cells that started their differentiation into single-cell myotubes. b, Cis-to-trans ratios are lower in A than in B compartments for all four studied cell types. The scatter plots are computed from the genome wide compartment profile and the cis-to-trans ratio profile, both at a bin size of 1,024 kb. The Pearson correlation coefficients are indicated in the upper right corners of the scatter plots. c, Externalization of the expressed genes from their harboring chromosomes measured by the cis-to-trans ratios as a function of gene length and expression in corresponding tissues. Left column of heatmaps: median cis-to-trans normalized by chromosome. Notice the reduction of cis-to-trans (i.e., increasing externalization) for highly transcribed genes (top rows in each heatmap) as gene length increases (moving from left to right). Similarly, cis-to-trans goes down for long genes (right-most column of each heatmap) as expression increases (going up along this column). Interestingly, lowly transcribed long genes (lower right corner) have high cis-to-trans, indicating strong internalization, but become strongly externalized as they become highly expressed (upper right corner). Middle column: median cis-to-trans ratios controlled for compartmental signal (the first eigenvector, E1). Heatmaps show the logarithm of observed median cis-to-trans ratio divided by the expected given E1 in the corresponding bin. For the expected value, all the genomic bins were separated into 20 ranges by their E1, and the median cis-totrans for each range was considered as expected. Notice that for most genes, E1 explains most of the cisto-trans ratio. However, cis-to-trans is considerably lower for extremely long and extremely highly transcribed genes (upper right corner of each heatmap). Right column: the number of genomic bins in each range of length and transcription. Notice that very few genes show high externalization. d, Table of coefficients of determination (R2) for regression of cis-to-trans ratios of the genomic bins normalized by chromosome, in four tissues. Only the bins of expressed genes (TPM>100) are considered. Gene length is an excellent predictor of cis-to-trans ratio for genomic bins of highly expressed genes (TPM>1000, 1st row), but not for other expressed genes (TPM from 100 to 1000, 2nd row). Gene expression is a good predictor of cis-to-trans ratio for genomic bins of long genes (TPM>50 Kb, 3rd row), but not for shorter genes (TPM<50 Kb, last row). Heatmaps: visual illustration of gene subsets in this analysis.
Extended Data Fig. 9
Extended Data Fig. 9. TLs do not cause insulation at different length scales
Insulation assesses Hi-C contacts spanning across a given locus up to a maximal distance w (top right insert). Contacts in a square window of size w were aggregated and the square was slid along the Hi-C diagonal. The score was normalized by its genome wide mean. Profiles show log2 of the score, such that a locus with profile value −1 has a two-fold reduced number of contacts spanning the locus up to distance w compared to the genome wide mean. Insulation scores are computed with the cooltools package (https://github.com/mirnylab/cooltools). We computed insulation profiles for Hi-C maps with a bin size of 128 kb for various window sizes from 256 kb up to ≈16 Mb. For every analyzed gene, the left and right columns show a 3 and 20 Mb Hi-C map with insulation profiles for different window sizes; the top and bottom panels show insulation profiles in expressing (on) and non-expressing (off) cells, respectively. The analysis shows little correlation between insulation and the formation of TLs: insulation profiles at the gene loci do not differ much between cell types with the gene on or off. For example, the Tg gene shows a moderate dip at scales up to ≈1Mb in both thyroids (on) and myoblasts (off), and no dip in either cell type on the larger scale. Analysis of simulated TLs (Fig. 8 and Extended data Fig. 10) confirmed that TL formation does not cause large scale insulation (bottom row).
Extended Data Fig. 10
Extended Data Fig. 10. Polymer simulation of chromosomes
a, Six chromosomes (50 Mb each) were initiated in a mitotic-like state with unit volume density. Row 1 and 3 show top views, row 2 and 4 show side views. In rows 1 and 2 six chromosomes are differentially colored; in rows 3 and 4 compartmental segments of A and B type chromatin are differentially colored with red for A and blue for B compartments. The initial expansion is very fast (column 2). However, once the chromosomes fill the nucleus uniformly, the subsequent dynamics is very slow and chromosomes retain their territoriality (note that times increase logarithmically). Nevertheless, due to attraction of B-type chromatin to the lamina, a radial structure emerges (rows 3 and 4). b, TLs are modeled by choosing a 300 kb segment on each chromosome 25.4 minutes after expansion and increasing the stiffness of the polymer fiber. The genes quickly expand on the order of minutes and are simulated for approximately 1.5 h. The measurements of inter-flank distances and Hi-C maps are performed using configurations sampled from the second half of this time interval. When genes are deactivated by removing the excess stiffness, they collapse back to the inactive state. c, Left: Hi-C of all 6 chromosomes shows their territoriality as patches. Second-left: A Hi-C contact map averaged over all 6 chromosomes exhibits the checkerboard pattern of a typical segregation of A- and B-type chromatin. The three rightmost graphs show zoomed views of modeled genes with stiffness profiles above the maps.
Figure 1.
Figure 1.. Selection of long highly expressed genes.
a, Analysis of gene expression in selected human tissues (retrieved from the GTEx database). b, RNA-seq analysis of corresponding mouse tissues and cells from this study. Expression level (median TPM) is plotted against gene length according to GENCODE. Candidate genes with a length of ca. 100 kb or longer and an expression level of ca. 1,000 TPM or above are marked in red. Note the exceptionally high level of Tg expression, exceeding the expression of housekeeping genes, such as Actb and Rpl41 (marked in green). Tg, thyroglobulin; Ttn, titin; Neb, nebulin; Myh11, myosin heavy chain 11; Cald1, caldesmon 1; Actb, beta-actin; Rpl41, large ribosomal subunit protein EL41. For data on all protein coding genes see Supplementary Tables 1 (human) and 2 (mouse).
Figure 2.
Figure 2.. Highly expressed long genes form Transcription Loops (TLs).
a-c, Five selected genes after either DNA-FISH (a,b) or RNA-FISH (c) with corresponding genomic probes. Control cells not expressing the respective genes exhibit focus-like condensed DNA signals at the nuclear periphery (a); in expressing cells, genes are strongly decondensed (b). RNA-FISH reveals TLs by hybridization to multiple nRNAs decorating the genes (c). d, The entire Tg TL detected by an oligoprobe, hybridizing to the first 5’ exons. The schematic shows distribution of the BAC covering the mid-part of Tg (green line) and the oligoprobe for the first 4 exons (red rectangle). Arrows point at Tg TL regions labeled by the oligoprobe but not by the BAC probe. e,f, Tg TLs revealed by immunostaining of the elongating (e, Ser2p) and initiating (f, Ser5p) forms of RNAPII. g, Immuno-FISH showing colocalization of structures marked with elongating RNAPII and Tg TLs. Images are projections of 1–2.5 μm confocal stacks. Scale bars: a-c, 5 μm, in insertions, 1 μm; d, g, 2 μm; e,f, 1 μm. Data represent 10 (a-c) and 2 (d-g) independent experiments.
Figure 3.
Figure 3.. TLs manifest transcription progression and dynamically modify the harboring chromosomal loci.
a, Successive labeling of Tg TLs with probes for 5’ (green) and 3’ (red) exons reflecting changes in exon composition. Arrows point at the TL regions labeled with only the 5’ probe. b, Successive labeling of the Tg long intron 41 with oligoprobes for the entire intron (green) and for its second 3’ half (red). c, Sequential labeling of Tg TLs with genomic probes highlighting 5’ (green) and 3’ (red) introns reflecting changes in the intron composition. The 5’ genomic probe includes 5’ exons and thus faintly labels the second half of the loop (arrows). Arrowheads mark the region hybridized by both overlapping probes. d, TLs formed by other long highly expressed genes exhibit co-transcriptional splicing. e, Colocalization of the component of the exon-junction complex EIF4A3 (red) with Tg TLs (green) visualized either by RNAPII staining or by RNA-FISH. In a-e, data represent 3 independent experiments. f, Expressed genes expand and separate their flanks. Distances between 5’ (green) and 3’ (red) flanking regions of the Tg and Ttn genes (yellow) are larger in cells expressing the genes compared to control cells with silent genes. Projections of confocal sections through 1 – 3 μm. Scale bars, 2 μm, in insertions on d and e, 1 μm. The distribution of the used probes in respect to the studied genes are depicted above the image panels. The boxplots depict the 3D distance between the flanking regions in expressing and non-expressing cells. The median inter-flank distance for Tg in thyrocytes is 2.3-fold larger than in control epithelial cells (703 nm versus 311 nm) (n = 203 alleles in thyrocytes and 180 alleles in epithelial cells across 2 independent experiments, ***p = 2.167×10⁻³⁴, two-sided Wilcoxon rank sum test). The median inter-flank distance for Ttn in myotubes is 1.7-fold larger than in control myoblasts (1,104 nm versus 634 nm) (n = 117 alleles in myotubes and 63 alleles in myoblasts across 3 independent experiments), ***p = 2.584×10⁻¹¹, two-sided Wilcoxon rank sum test). Boxplots show the median (horizontal line), 25th to 75th percentiles (boxes), and 90% (whiskers) of the group.
Figure 4.
Figure 4.. Transcription Loop size is not determined by gene length but by expression level.
Examples of 4 long genes - Tg (a), Ttn (b), Neb (c) and Dmd (d) - arranged from top to bottom according to their expression level in the respective cell type. Gene length and expression level are indicated next to the gene symbol. For every gene two images are displayed on the left, showing DNA-FISH detecting the gene body and RNA-FISH detecting nRNAs. The more expressed a gene is, the less solid the DNA-signal is and the more expanded the RNA-signal is. Vice versa, the less expressed a gene is, the more condensed the gene body is and the less extended the RNA-signal is. The schematics on the right are speculative interpretations of the observed FISH signal patterns in terms of transcriptional bursts, depicted as RNAPII convoys with attached nRNAs, and transcriptional pauses, depicted as condensed chromatin (green nucleosomes). For simplicity, splicing events are not shown on the schemes. Microscopic images are projections of 1–1.5 μm confocal stacks. Scale bars, 2 μm, in insertions, 1 μm. Data represent 10 (a-c) and 4 (d) independent experiments.
Figure 5.
Figure 5.. TLs are dynamic structures.
a, Ectopic induction of Ttn TLs in myoblasts by transfection of dCas9-VPR-expressing myoblasts with gRNAs targeting the Ttn promoter combined with H2A-GFP-plasmid. By this way, Ttn expression was induced to the level of myotubes (n=3, error bars depict standard deviations). 90% of transfected myoblasts exhibited Ttn TLs and a 2-fold increase in median inter-flank Ttn distances (1,039 vs. 634 nm) (n = 104 and 63 alleles collected from 52 and 70 cells across 2 independent experiments), ***p = 1.052×10⁻⁷, two sided Wilcoxon rank sum test). b, The transcription inhibitors α-amanitin and actinomycin D eliminate Ttn TLs in myotubes. α-amanitin-treatment causes strong condensation of the gene body and convergence of the flanks, whereas actinomycin D leaves the gene body decondensed and flanks diverged (n = 62, 79 and 112 alleles without treatment, alpha-amanitin-treatment and actinomycin D-treatment, collected from 140 myotube nuclei across 3 independent experiments), ***p = 5.5×10⁻¹², n.s. p = 0.110 for untreated cells versus alpha-amanitin-treatment and actinomycin D-treatment respectively, ***p = 4.669×10⁻¹⁰ for alpha-amanitin-treatment versus actinomycin D-treatment, two sided Wilcoxon rank sum test). c, DRB treatment leads to a gradual Ttn TLs shrinkage (upper panel); removal of DRB leads to a gradual TLs restoration (mid panel). Labeling of the 5’ (green) and 3’ (red) halves of Ttn allows to follow appearance of the 5’-end signal first following by the signal for 3’-end (bottom panel). d, Ttn inter-flank distances decrease after DRB-treatment (1,104 nm to 963 nm) but remain larger than inter-flank distances in myoblasts (634 nm); upon transcription restoration, the distances are restored (1,130 nm) (n = 117, 114 and 88 alleles collected from 160 myotube nuclei without treatment, after 6h of DRB-treatment and 6h after DRB-removal across 2 independent experiments), *p = 0.013, n.s. p = 0.899, *p = 0.026 for DRB-treated cells versus non treated cells, cells after DRB-removal versus non treated cells and DRB-treated cells versus cells after DRB-removal, two sided Wilcoxon rank sum test). Scale bars, 5 μm. a, b, d, Boxplots show the median (horizontal line), 25th to 75th percentiles (boxes), and 90% (whiskers) of the group.
Figure 6.
Figure 6.. TLs are excluded from harboring chromosomes.
a, Tg TLs (red) emanate from the harboring chromosome 15 (green) and protrude into the nuclear interior. b, Nucleoplasmic regions occupied by Tg TLs (white arrows) are depleted of DAPI-stained chromatin (red arrows). c, Chromosomes 15 (green) are split into two halves by Tg TLs (red) with unpainted gaps (arrowheads). d, The gap in the chromosome territory (arrow) is marked with the 5’ (red) and 3’ (green) flanking sequences. The other chromosome territory is not split (arrowhead). Projections of confocal stacks through 1 μm; scale bars, a, 5 μm; b-d, 2 μm. In a-d, data represent 4 independent experiments. e, 25 Mb Hi-C contact map and a 1 Mb zoom view of five genes in active (on), or silent (off) states. TSS and TTS of the genes are marked with light blue lines (for detailed maps see Extended Data Fig. 7). f, Cis-to-trans ratio profiles, i.e. the total number of Hi-C contacts of a locus with loci on the same chromosome divided by the total number of contacts with other chromosomes, calculated for the gene of interest (red) and compared to 10 other long but lowly expressed genes (gray, see Supplementary Table 2 for the lists of genes). For comparison of cis-to-trans ratio profiles, the x-coordinates are rescaled so that the TSSs and TTSs of all genes are aligned (shaded areas). To highlight potential dips localized in the gene body against longer range variations, cis-to-trans ratio profiles are normalized to unity in the region outside the gene body. g, Statistical analysis of cis-to-trans ratios at a bin size of 32 kb for 5 studied genes (red) versus long but weakly expressed genes (gray). Tg, Ttn, Myh11 and Cald1 have significantly lower cis-to-trans ratios in comparison to control genes (0,735 vs. 1,196; 1,213 vs. 1,563; 0,987 vs. 1,498; 1,102 vs. 1,453, respectively) (p < 0.01, pairwise Mann-Whitney rank test for smaller values in the target group). Boxplots show the median (horizontal line), 25th to 75th percentiles (boxes), and interquartile range extended by 1.5 (whiskers) of the group. Hi-C assay was performed 3 times.
Figure 7.
Figure 7.. TLs of long highly expressed genes are stiff structures.
a, Cartoon depicting the nRNPs formed during transcription elongation (a1). nRNPs formed on a long highly expressed gene are voluminous and densely decorate the gene axis leading to its stiffness and expansion (a2). b, Schematics showing a short gene (b1), a long gene with long introns (b2) and a long gene with long exons (b3). Exons and introns are shown as dark-grey and white rectangles, respectively; transcripts are depicted as perpendicular light-grey lines of only half of the template length; splicing events are marked with red asterisks. c, Cartoon showing a short gene decorated by small RNPs allowing the gene axis to remain flexible and coil (c1) and example of highly expressed (4,360 TPM) but short (3 kb) Acta1 gene exhibiting a small RNA-FISH signal (c2). d, The longest Tg gene intron 41 (54 kb) strongly expands and exhibits a gradient of nRNPs from 5’ (green asterisks) to 3’ (red asterisks) splice sites (d1). The expansion of the intron (green) is disproportional in comparison to the rest of the gene (green, d2) as depicted in the cartoon (d3). Data represent 2 independent experiments). e, Schematic showing the effect of splicing inhibition on the length of nRNAs (e1). Comparison of Cald1 TL size signal in control myoblasts (0.1% DMSO) and myoblasts treated with the splicing inhibitor pladienolide B (10nM). RNA-FISH signals of the 5’ and 3’ ends are shown in green and red, respectively (e2). Gray-scale images show examples of the 5’ TL end. Pladienolide B causes massive abortion of transcription evident from the absence of the 3’ signal in a large proportion of Cald1 alleles (arrow) and accumulation of nucleoplasmic granules detected by the 5’ probe (arrowheads). Despite transcription abortion, the size of RNA-FISH signals is increased 2.5-fold indicating larger expansion of the TLs (e3; n= 118 and 123 alleles in DMSO and pladienolide B treated cells collected from 150 myoblasts across 2 independent experiments), ***p = 2.788×10⁻²⁵, two sided Wilcoxon rank sum test). Boxplots show the median (horizontal line), 25th to 75th percentiles (boxes), and 90% (whiskers) of the group. Scale bars: 2 μm, in close ups, 1 μm.
Figure 8.
Figure 8.. Polymer modeling of transcribed genes.
a, Polymer simulation setup. Six territorial chromosomes (50 Mb each) in a spherical nucleus were obtained by initiating them in a mitotic-like state (top and side view). For clarity, shifted copies are shown outside the nucleus. Then polymers were expanded and for each polymer, a 100 kb gene of interest was assigned (depicted with a darker color). In the rest of the simulations only 3 chromosomes are shown (bottom). b, Biological variables used to verify TL models: appearance of Tg TLs, inter-flank distances measured by microscopy and cis-to-trans contact ratios calculated from Hi-C maps; scale bar, 2 μm. c1, Genes of 100 kb are compact structures and do not exhibit a dip in cis-to-trans contact ratio compared to the surrounding fiber in the inactive state. c2, A mere increase in gene contour length (15-fold) leads to a bigger TL volume but doesn’t exhibit a clearly discernible contour or a dip in cis-to-trans contact ratio. c3, Increased stiffness (12-fold in the bending energy) together with a moderate increase in contour length (3-fold) shows that TLs expand substantially, exhibit a clear contour, and a dip in the cis-to-trans contact ratio. c4, A gradual increase in stiffness along the gene (on average 12-fold) leads to a larger flank separation, more coiling of the 5’ compared to 3’ gene ends and an asymmetric dip in cis-to-trans contact ratio with a steeper slope at the 3’ end. Scale bar, 1 μm. d, Side-chains as the source of increased stiffness: d1, a gene with 300 monomers, each decorated with 3 side-chains made of 5 monomers (colored from green to red), is shown together with the 300 monomer flanks (black). d2, sidechain length increases gradually from 1 to 15 monomers. Right panels show the backbone of the simulated genes (blue) from the left panels. Scale bars, 0.2 μm.

Comment in

  • Transcripts in the loop.
    Zlotorynski E. Zlotorynski E. Nat Rev Mol Cell Biol. 2022 Apr;23(4):229. doi: 10.1038/s41580-022-00468-9. Nat Rev Mol Cell Biol. 2022. PMID: 35197609 No abstract available.
  • The sight of transcription.
    Friman ET, Bickmore WA. Friman ET, et al. Nat Cell Biol. 2022 Mar;24(3):284-285. doi: 10.1038/s41556-022-00865-4. Nat Cell Biol. 2022. PMID: 35256777 No abstract available.

Similar articles

Cited by

References

    1. Andersson R & Sandelin A Determinants of enhancer and promoter activities of regulatory elements. Nat Rev Genet 21, 71–87 (2020). - PubMed
    1. Cramer P Organization and regulation of gene transcription. Nature 573, 45–54 (2019). - PubMed
    1. Herzel L, Straube K & Neugebauer KM Long-read sequencing of nascent RNA reveals coupling among RNA processing events. Genome Res 28, 1008–1019 (2018). - PMC - PubMed
    1. Feodorova Y, Falk M, Mirny LA & Solovei I Viewing Nuclear Architecture through the Eyes of Nocturnal Mammals. Trends Cell Biol 30, 276–289 (2020). - PMC - PubMed
    1. Solovei I, Thanisch K & Feodorova Y How to rule the nucleus: divide et impera. Curr Opin Cell Biol 40, 47–59 (2016). - PubMed

Publication types