. 2022 Mar 15;208(6):1467-1482.
doi: 10.4049/jimmunol.2101094. Epub 2022 Feb 16.

Age-Dependent Reduction in Asthmatic Pathology through Reprogramming of Postviral Inflammatory Responses

Affiliations

Age-Dependent Reduction in Asthmatic Pathology through Reprogramming of Postviral Inflammatory Responses

Guy Hazan et al. J Immunol. .

Abstract

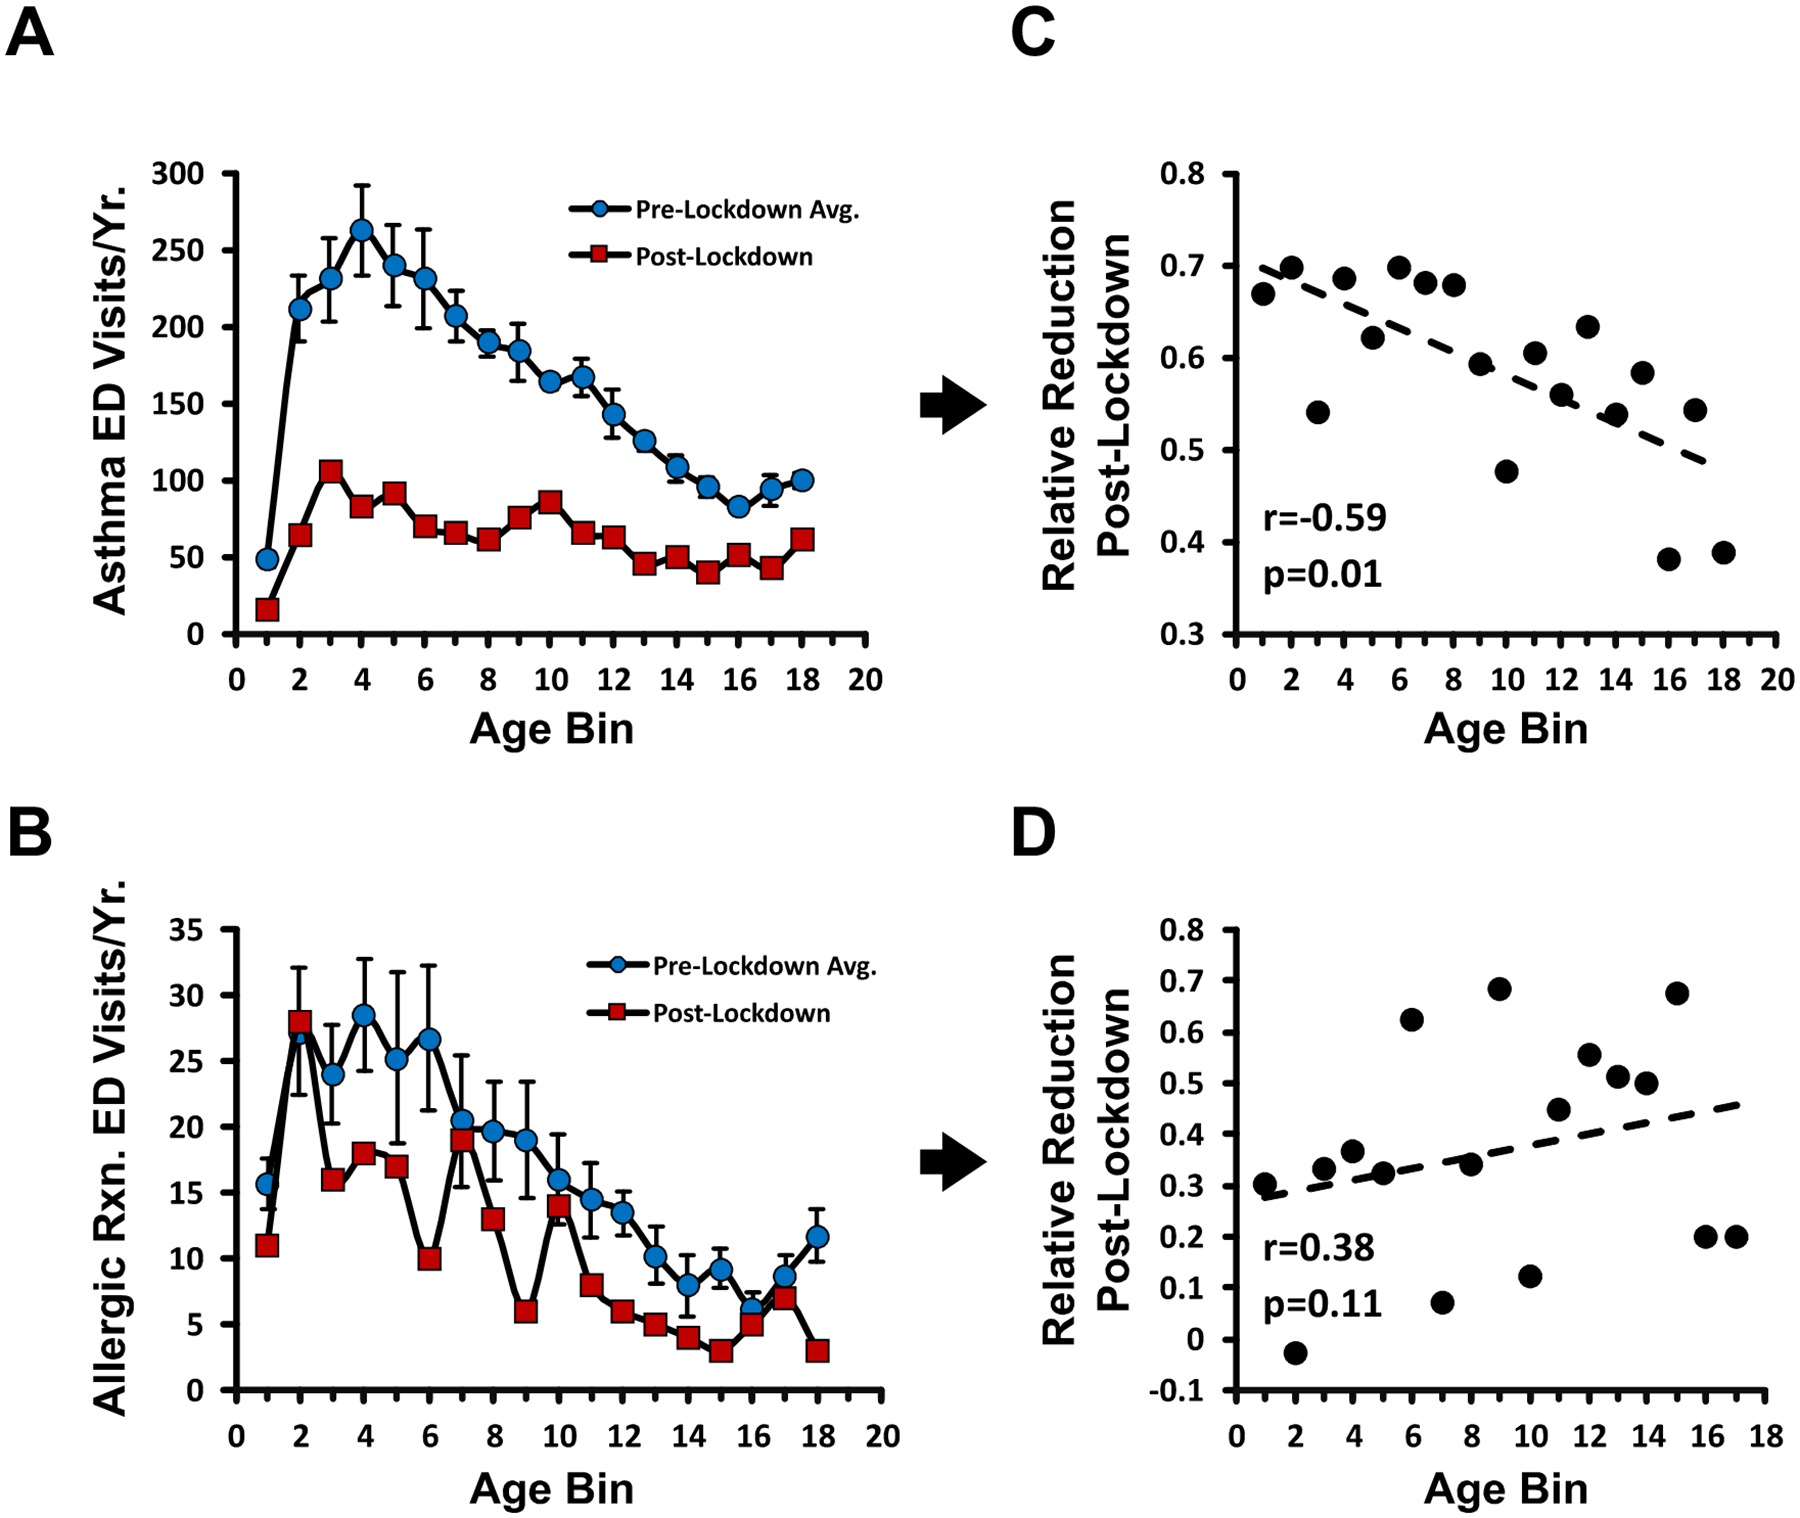
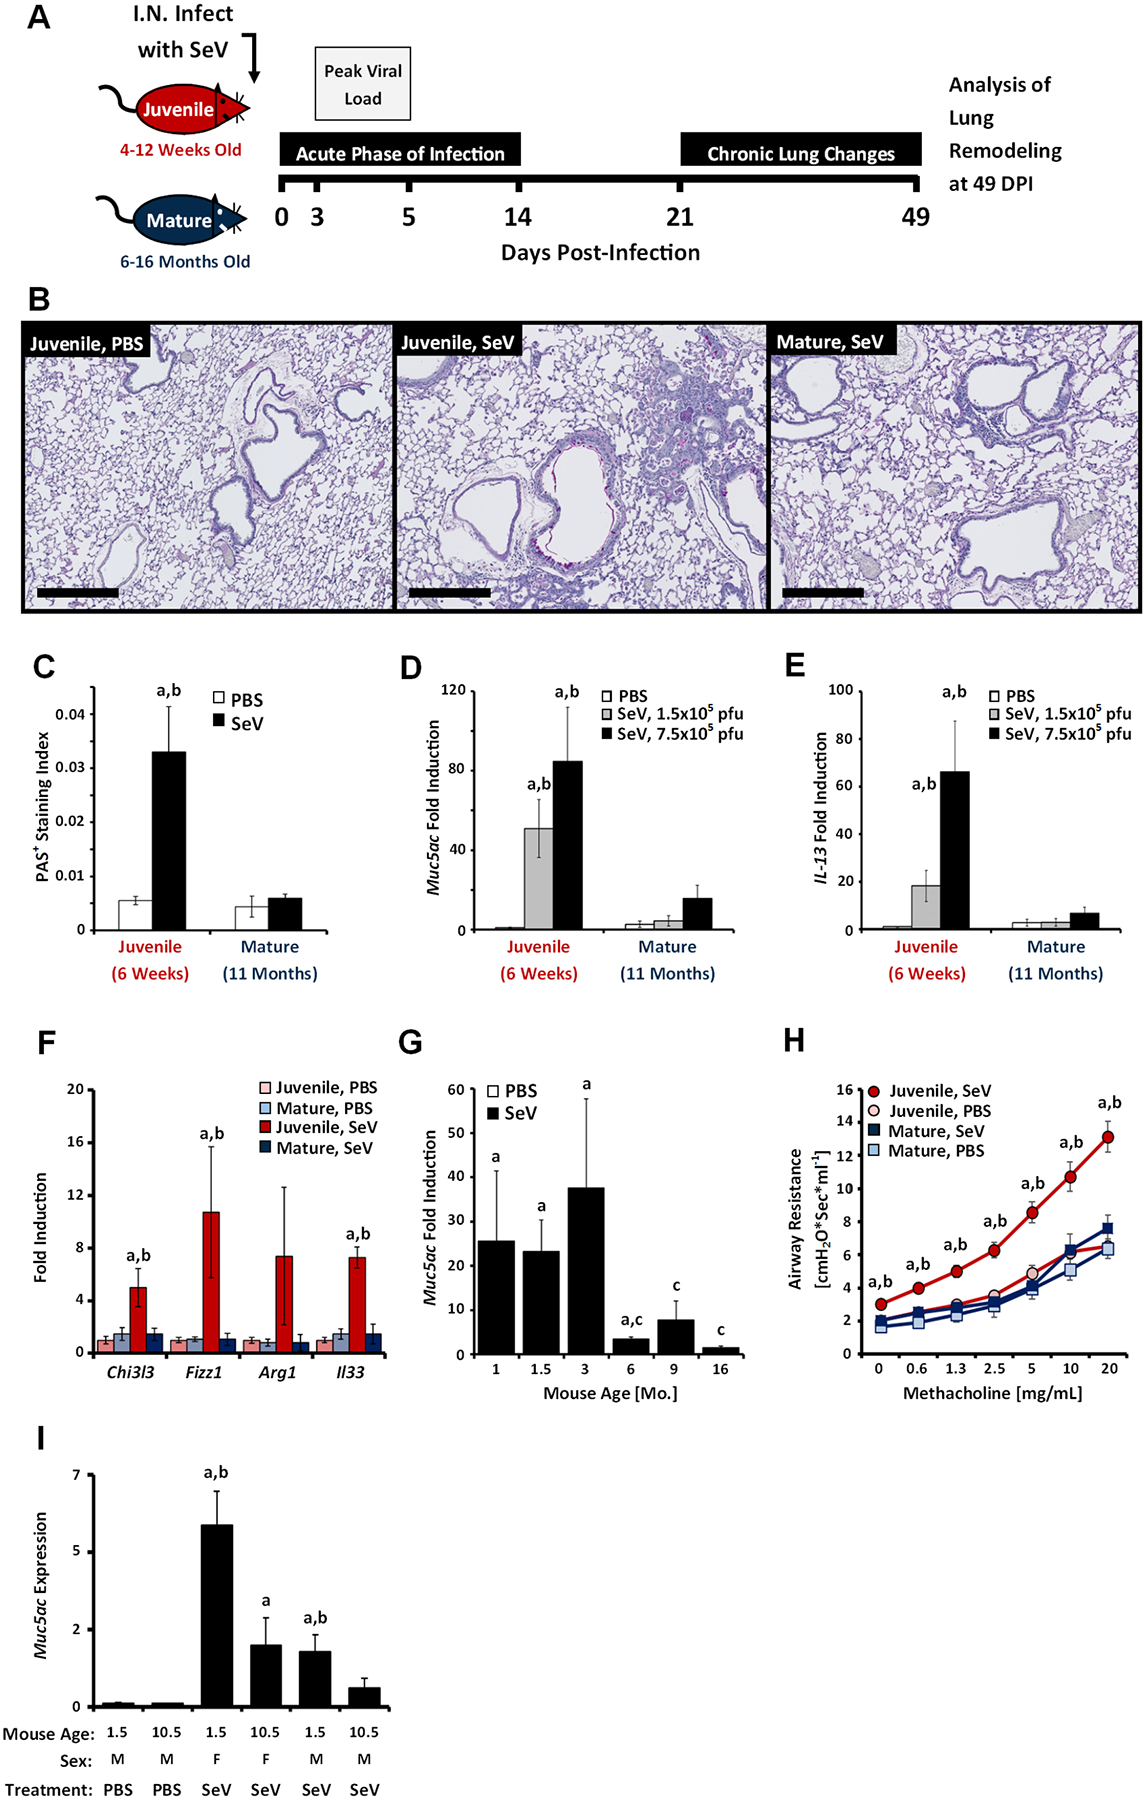
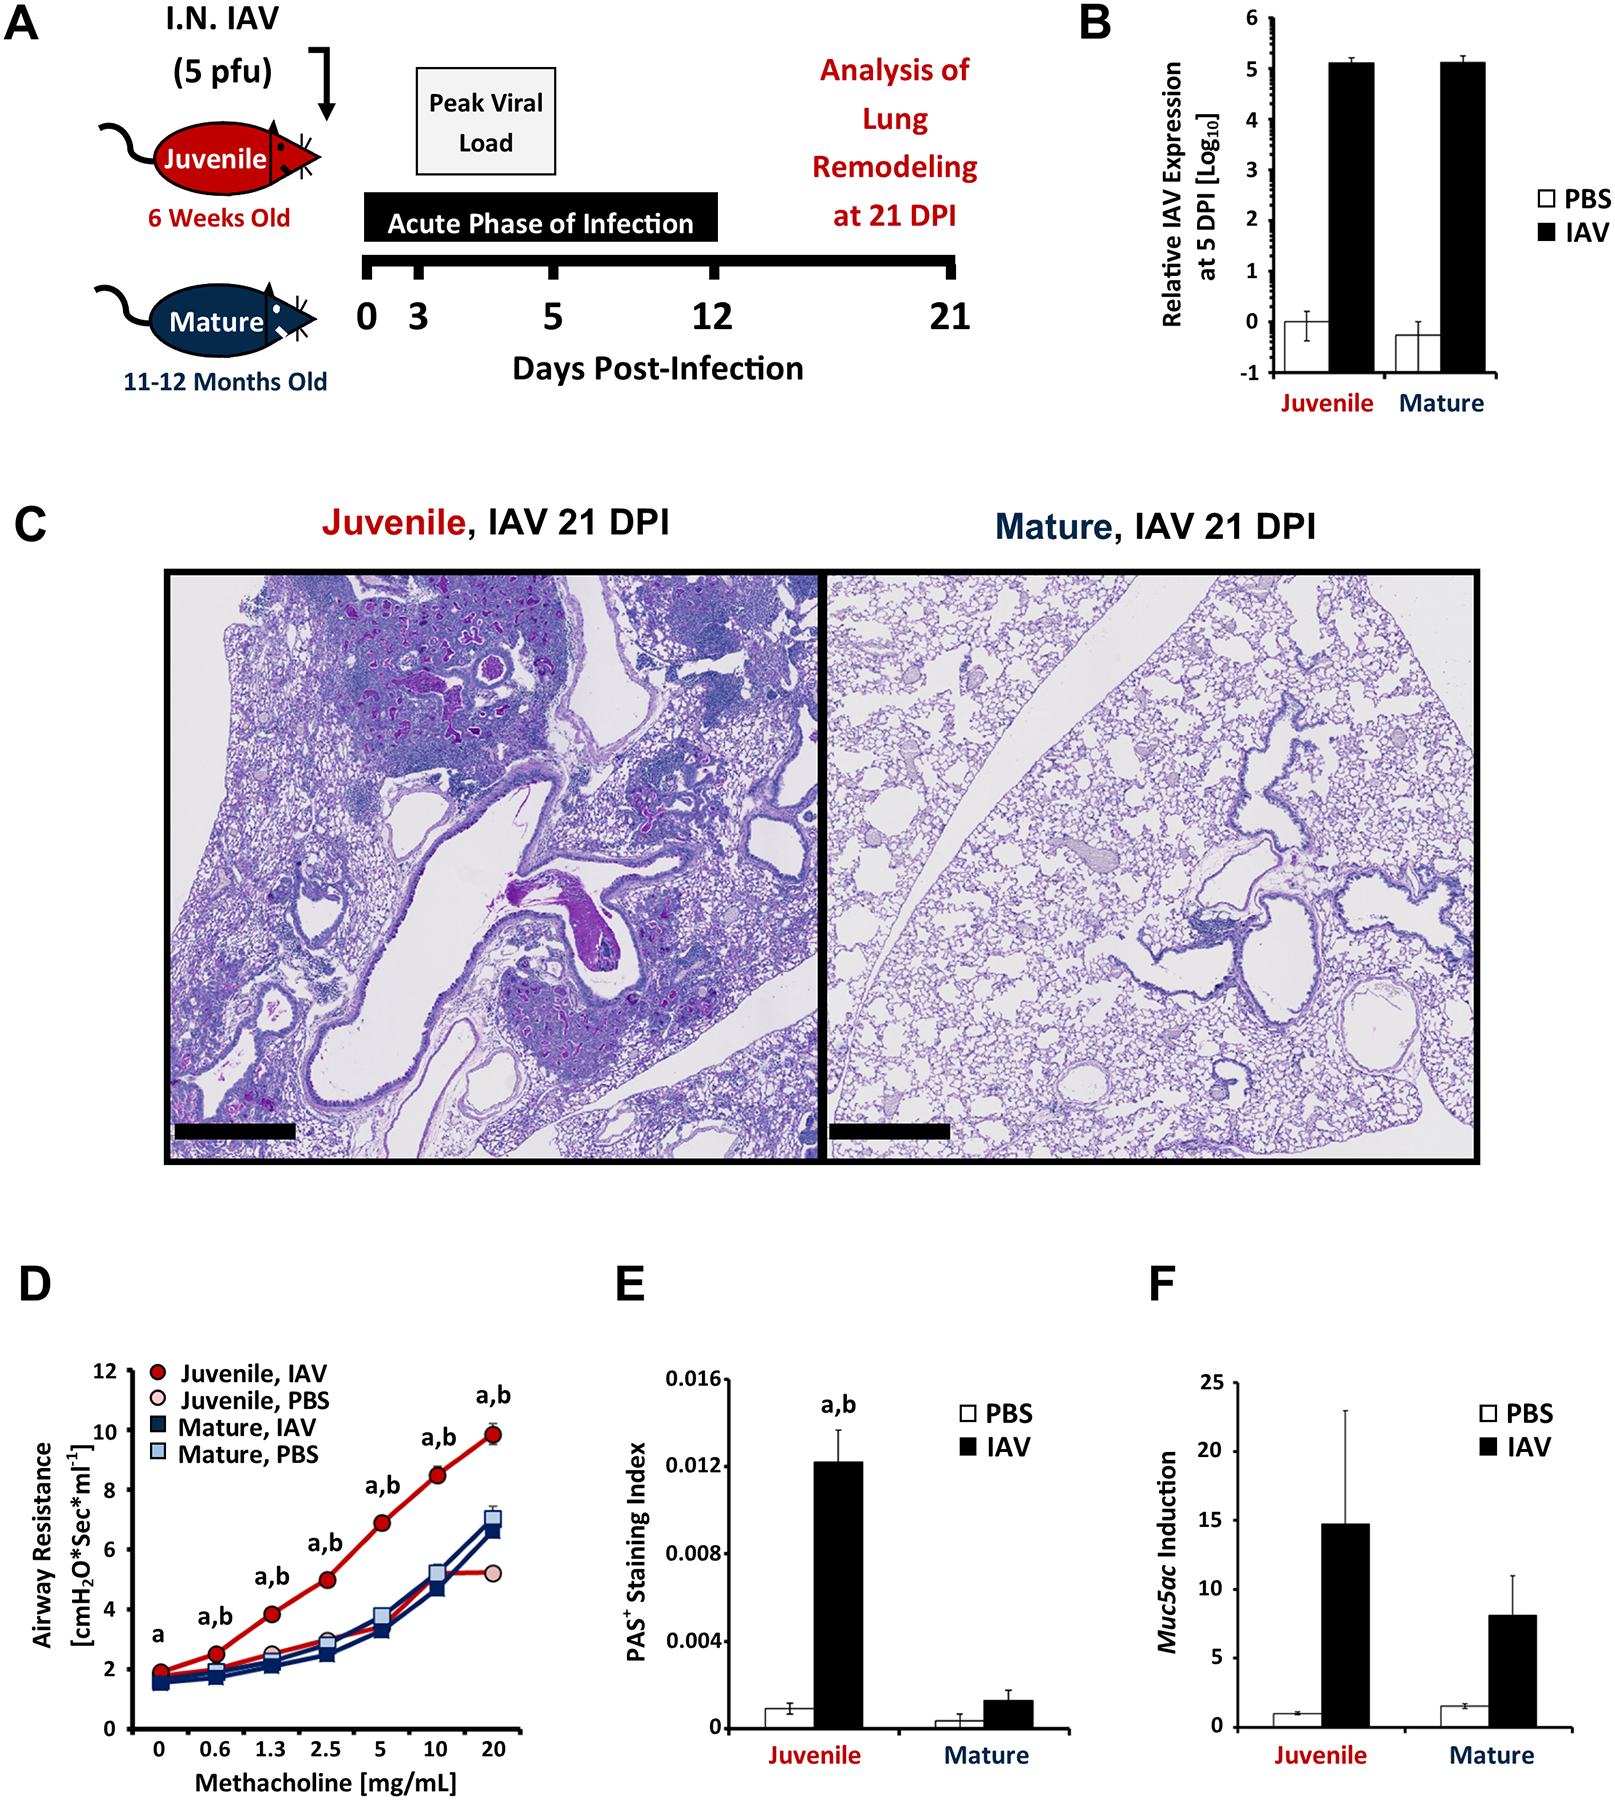
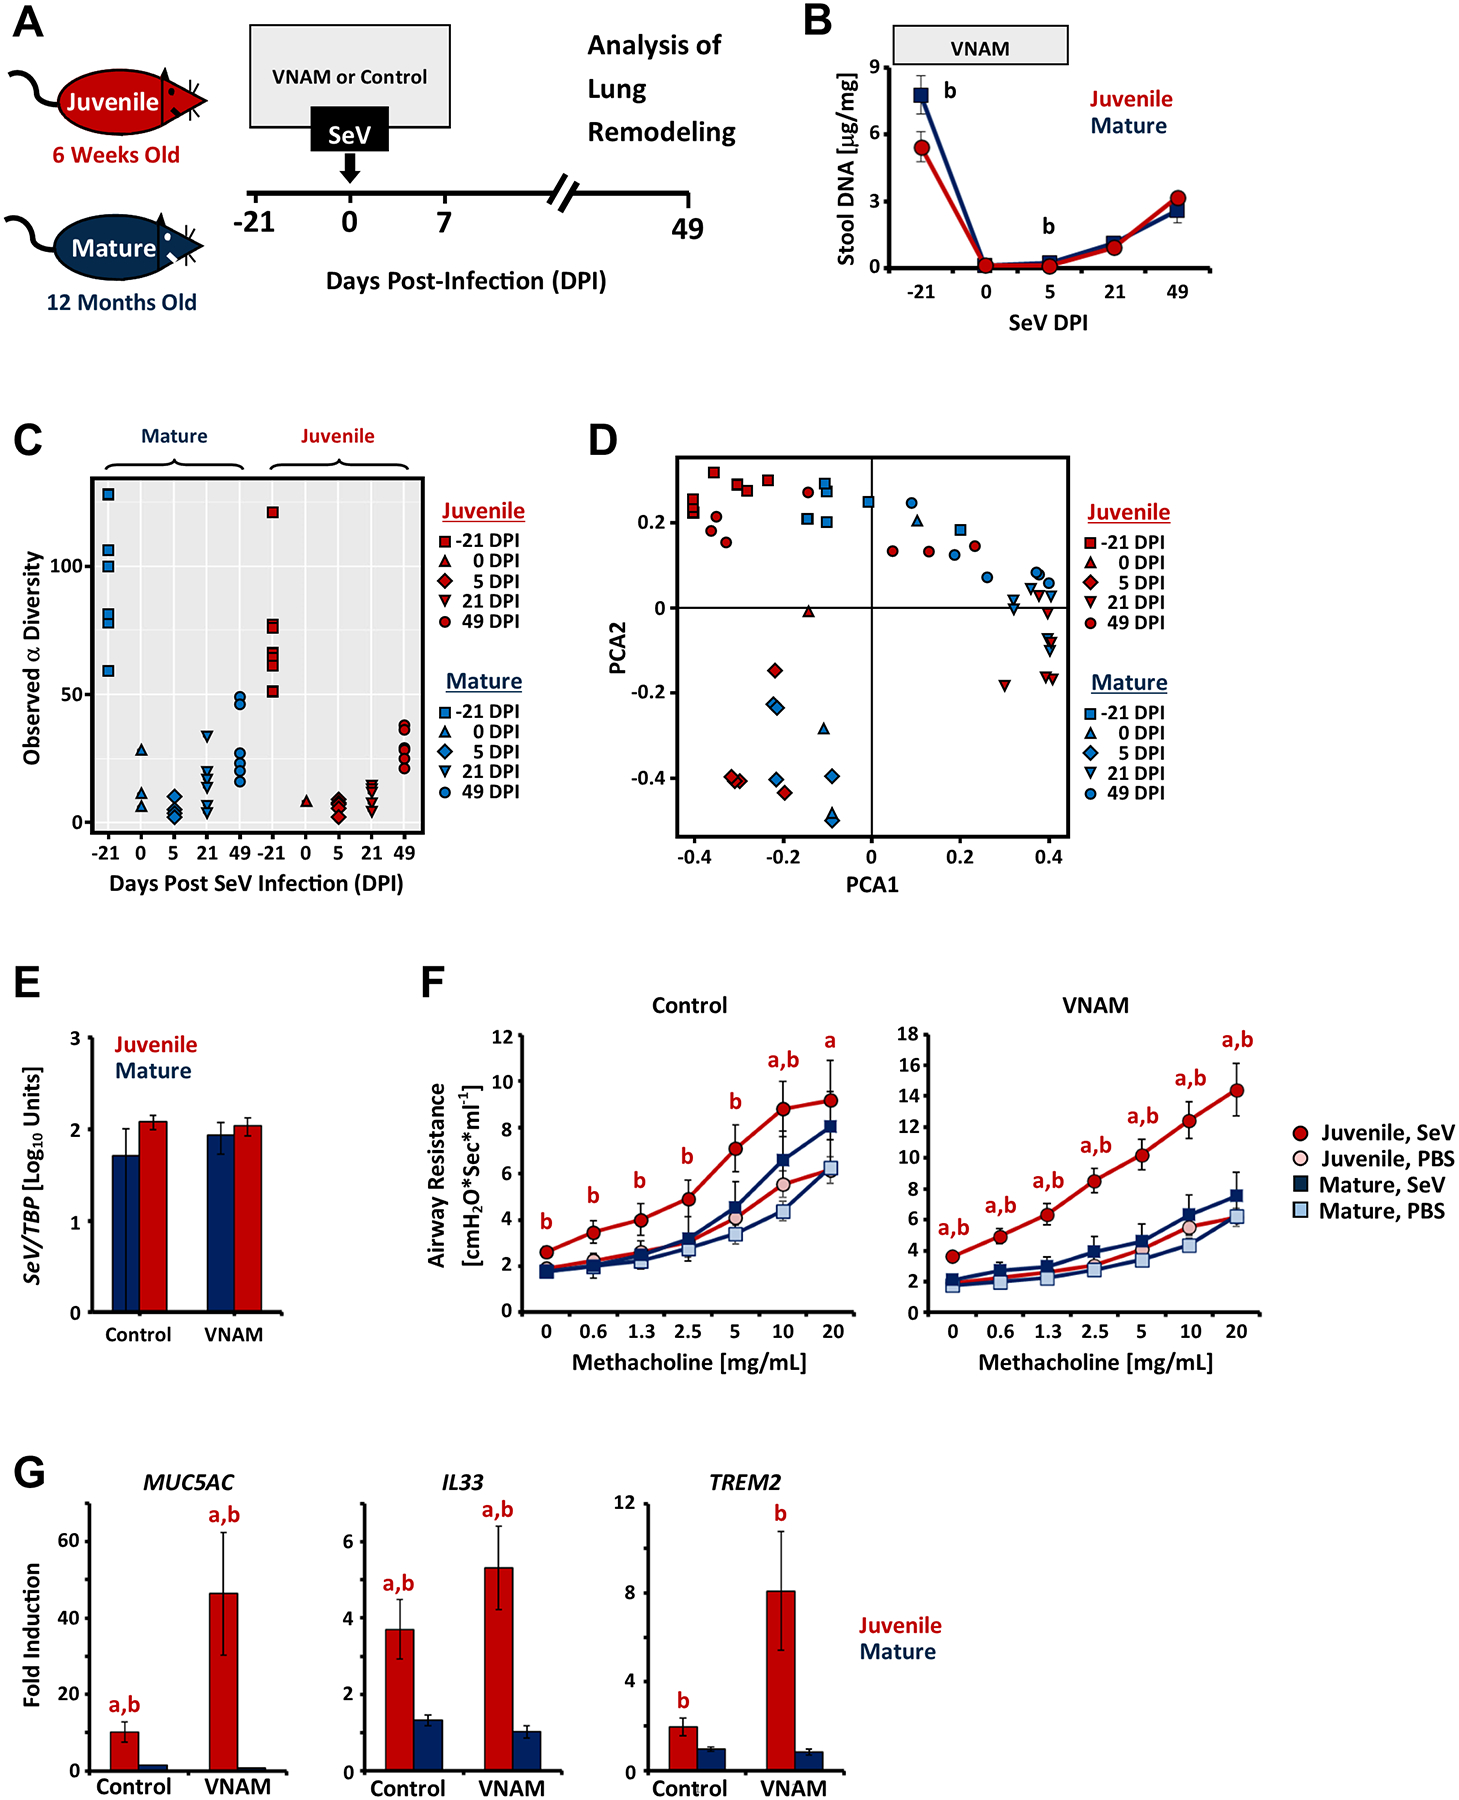
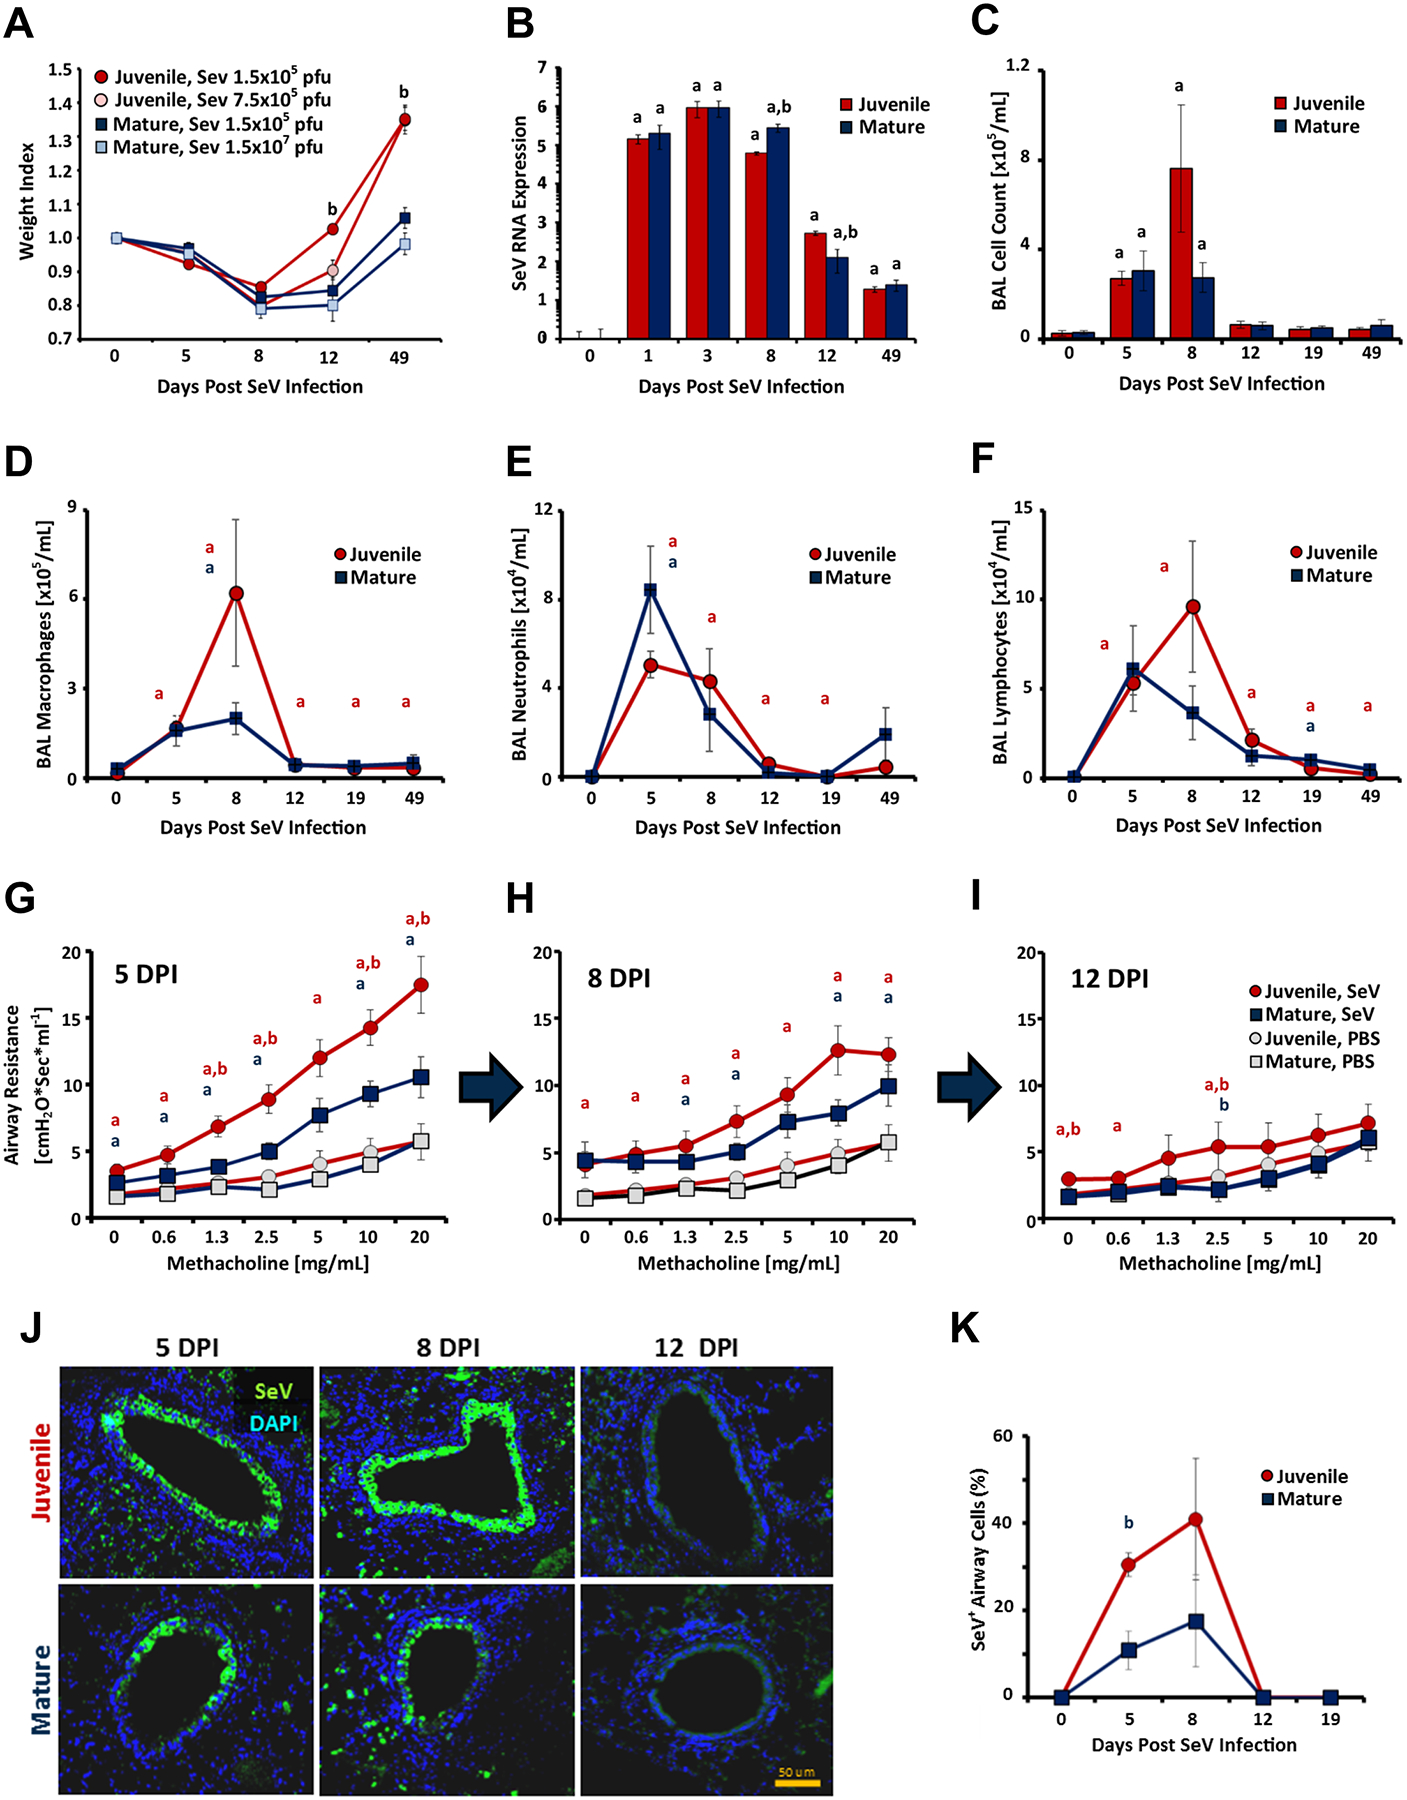
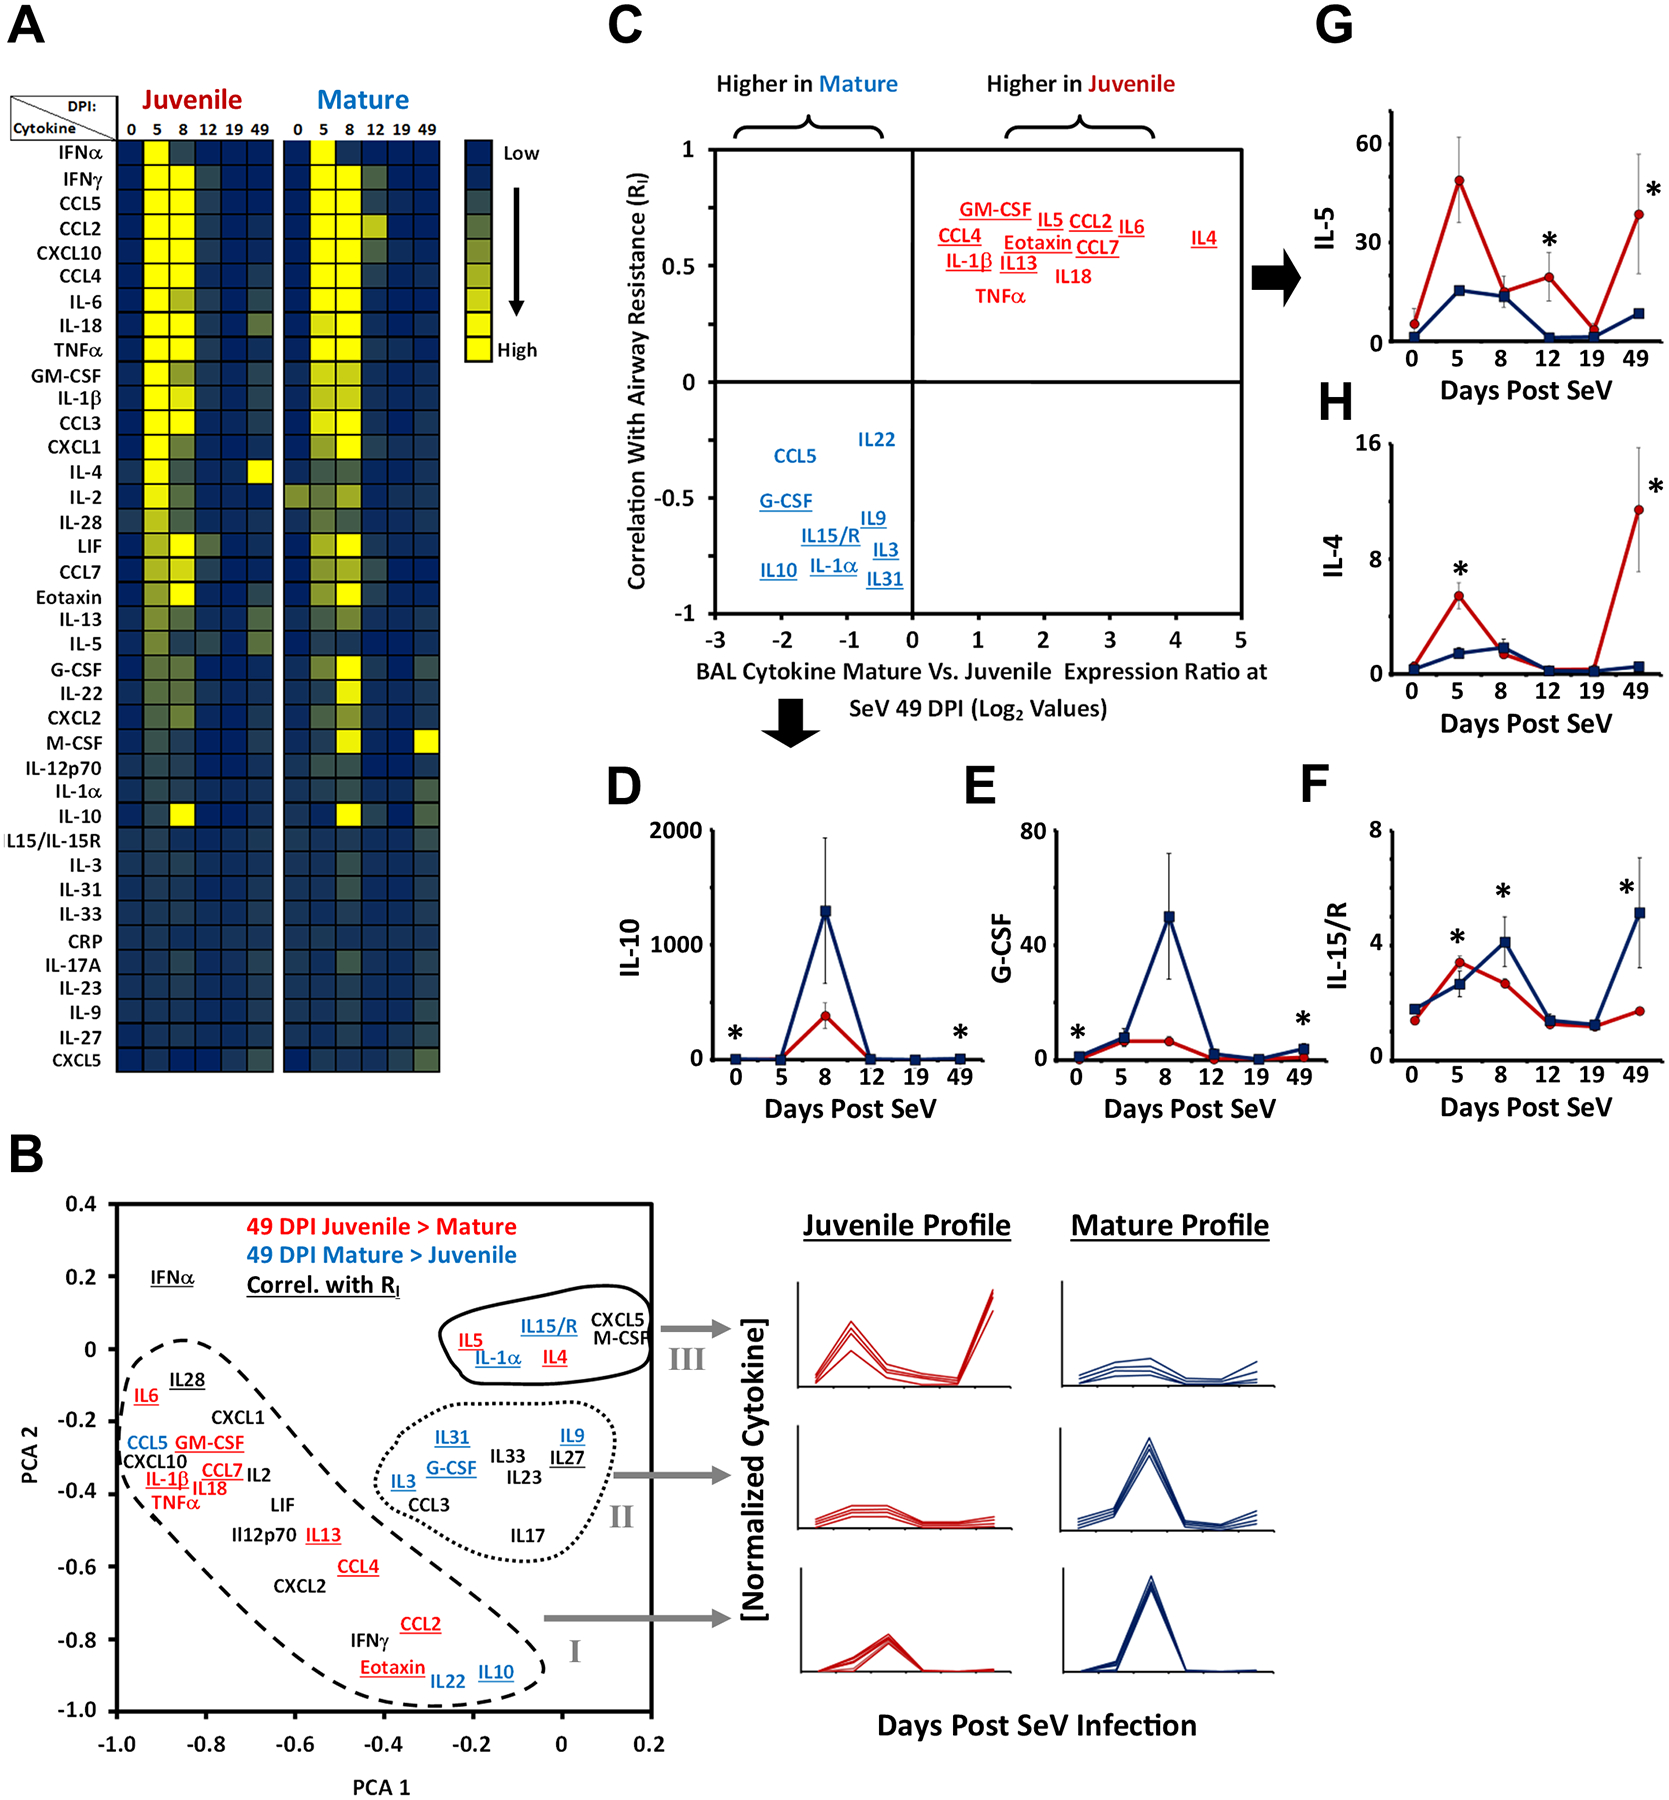
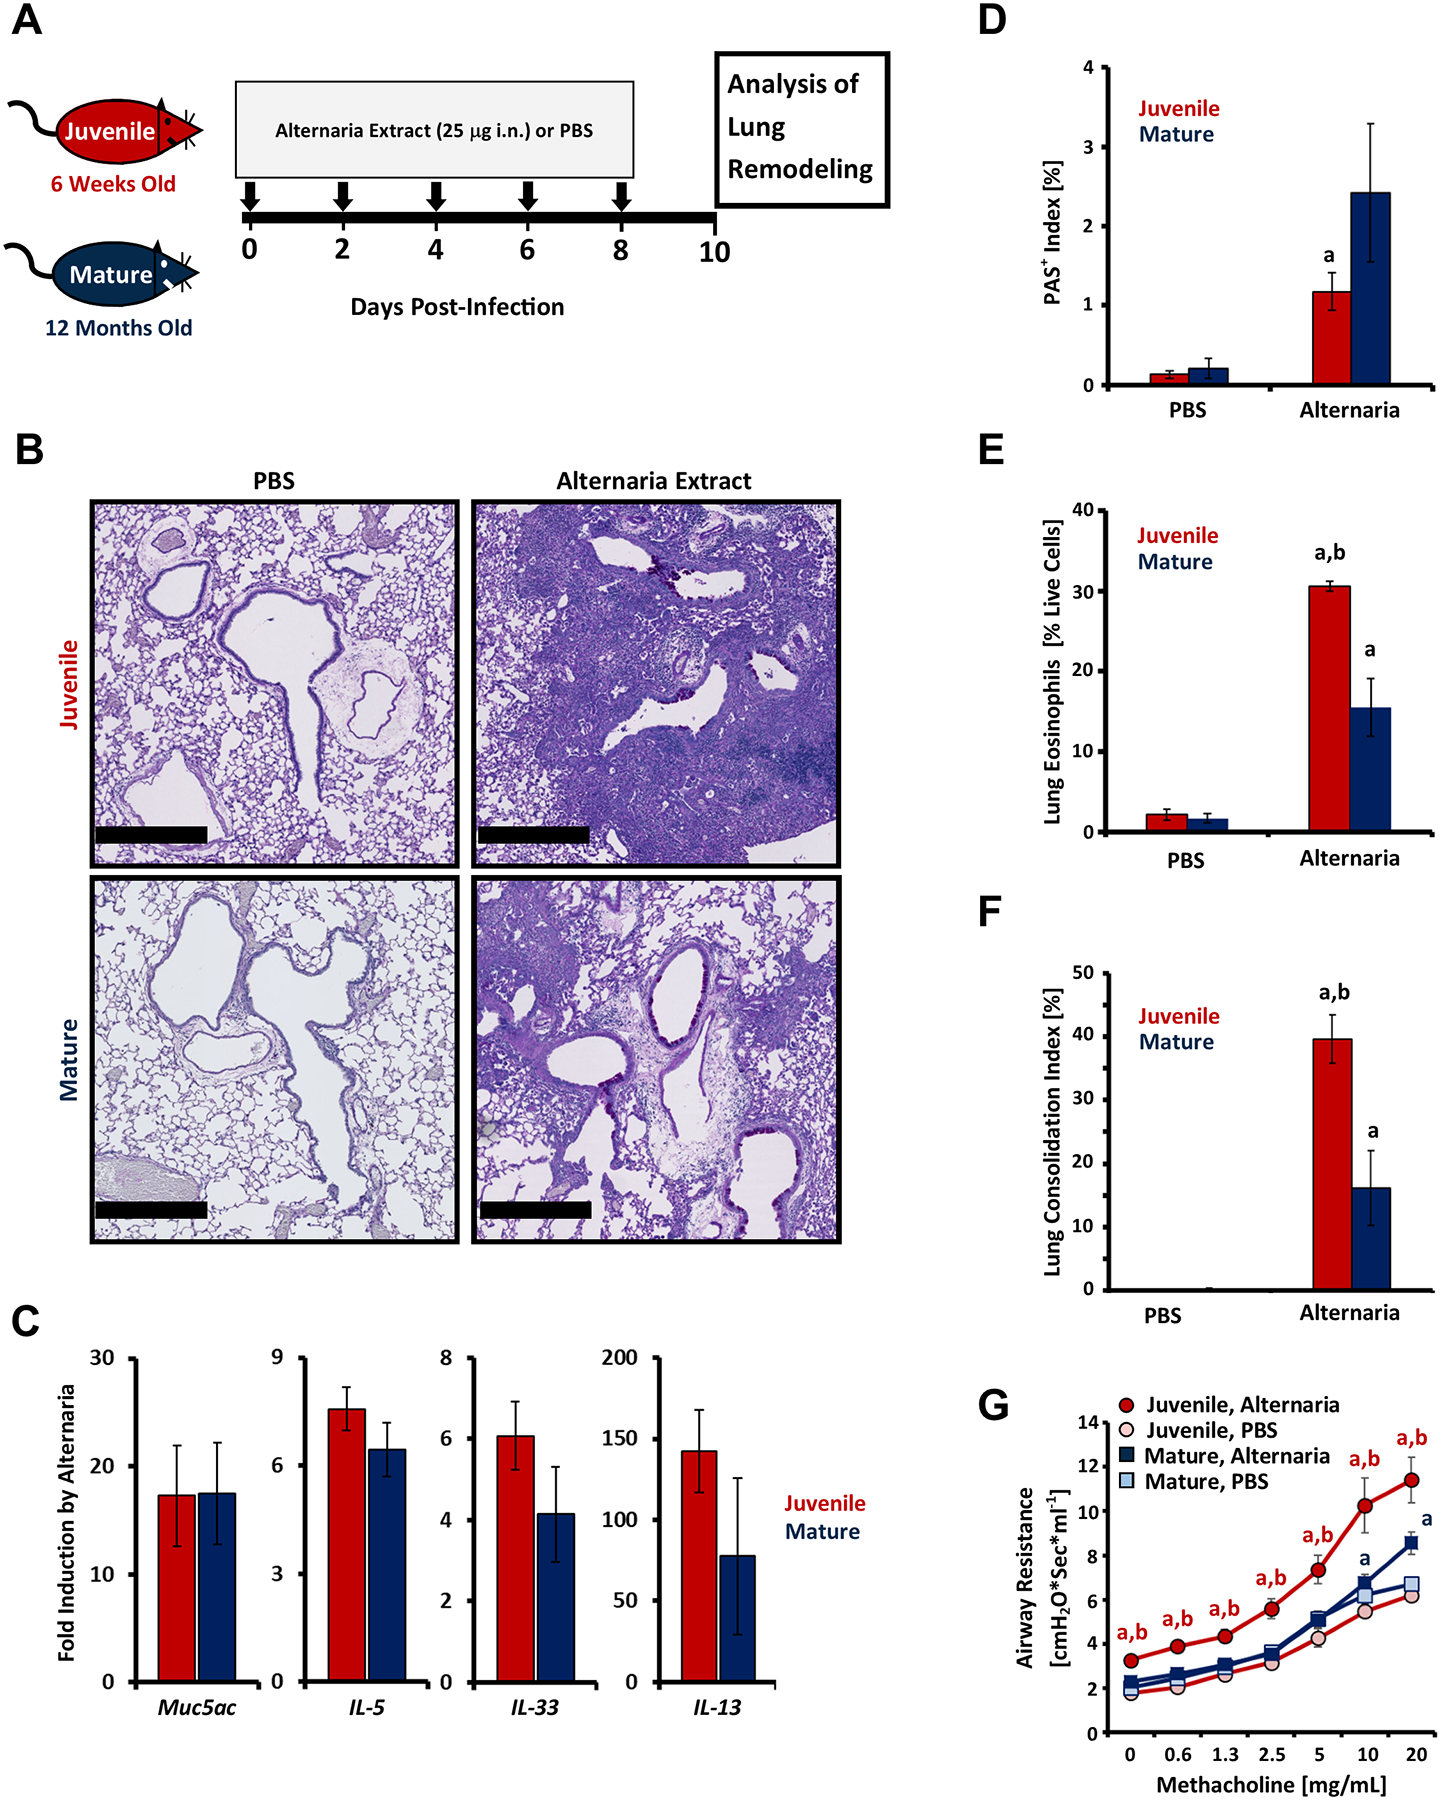
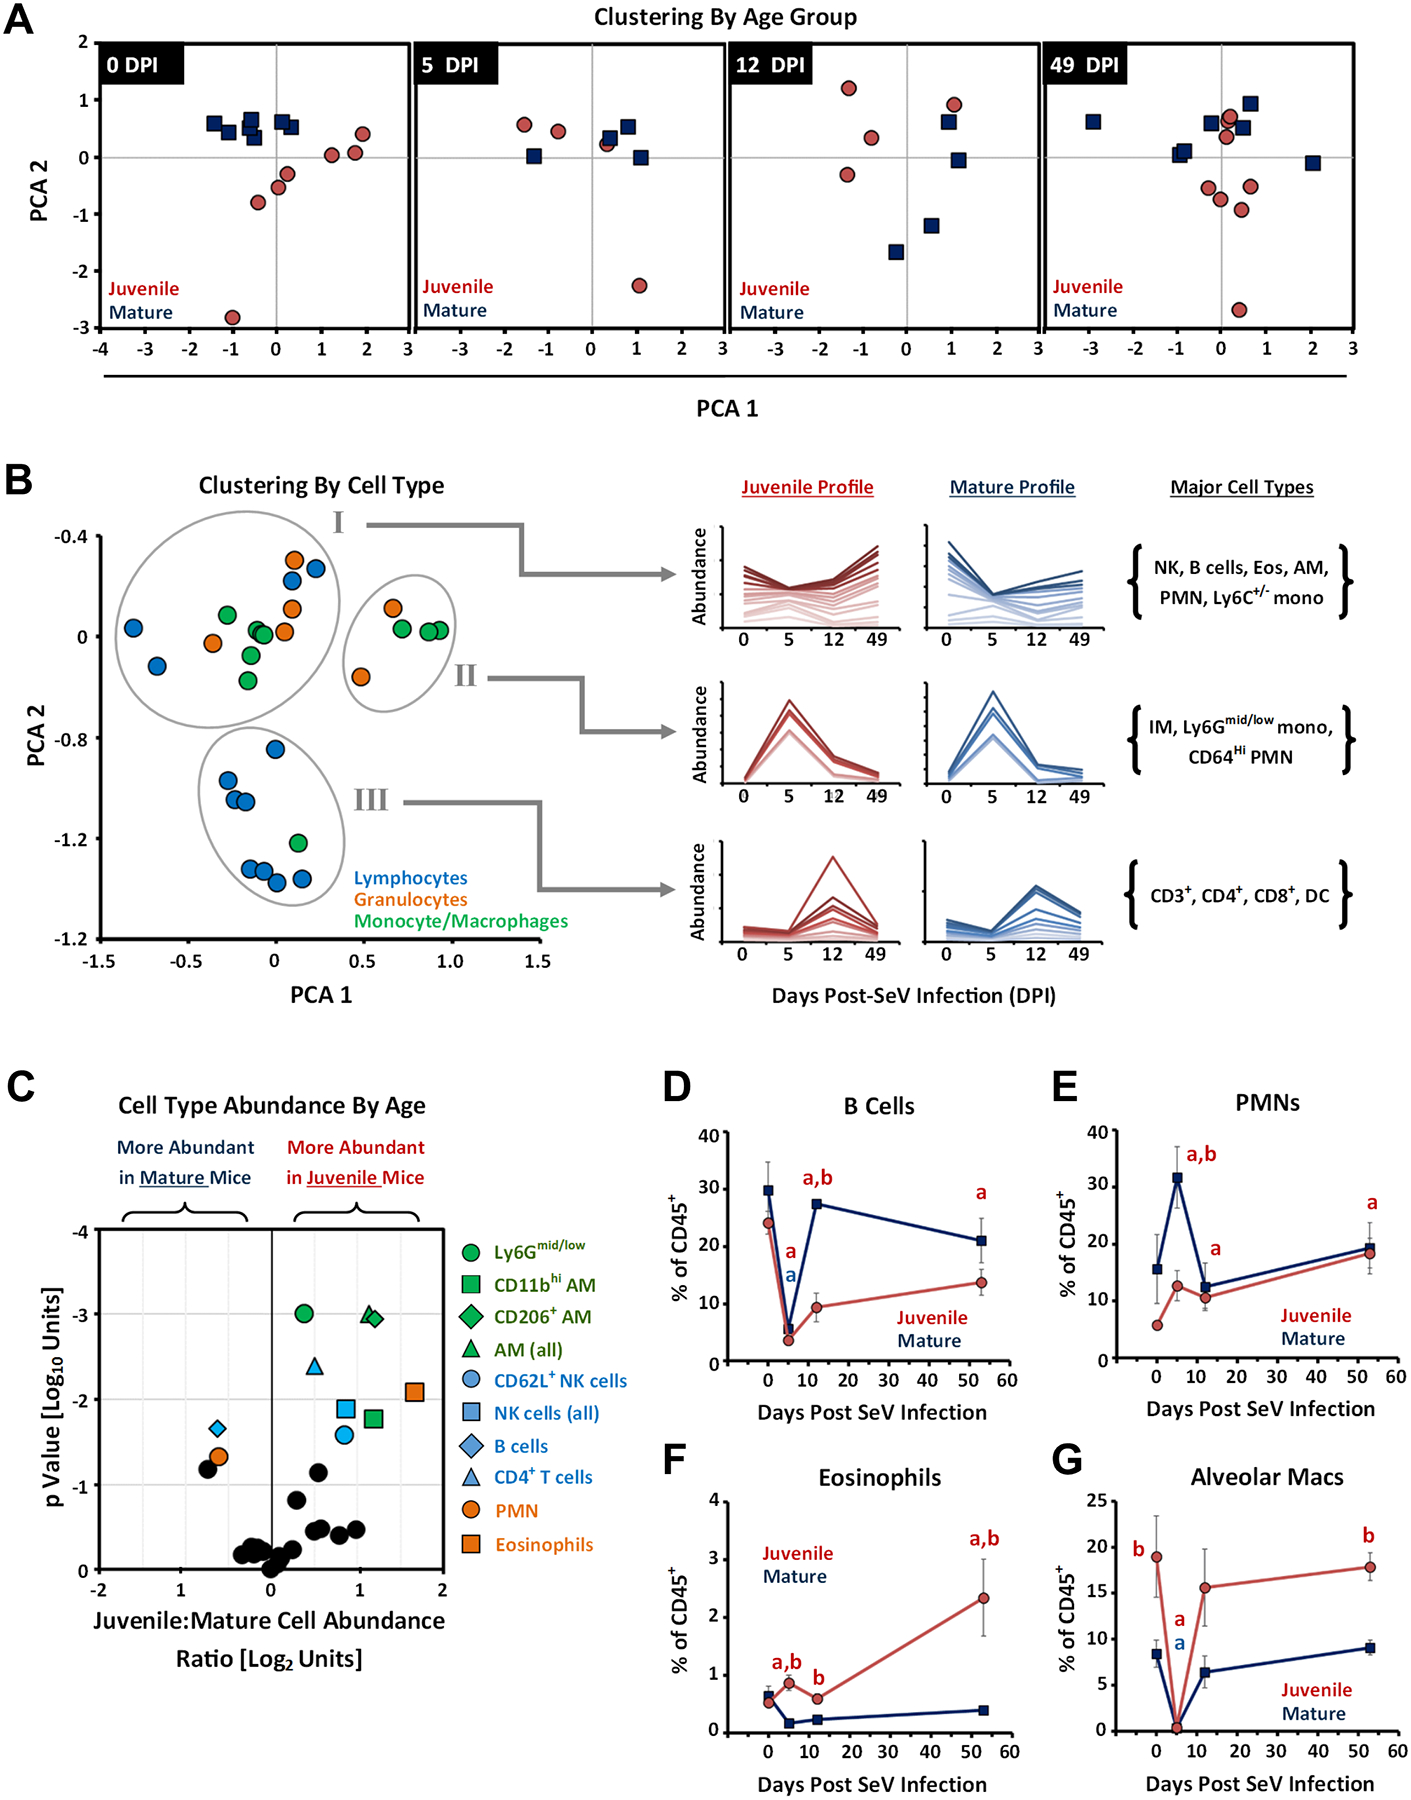
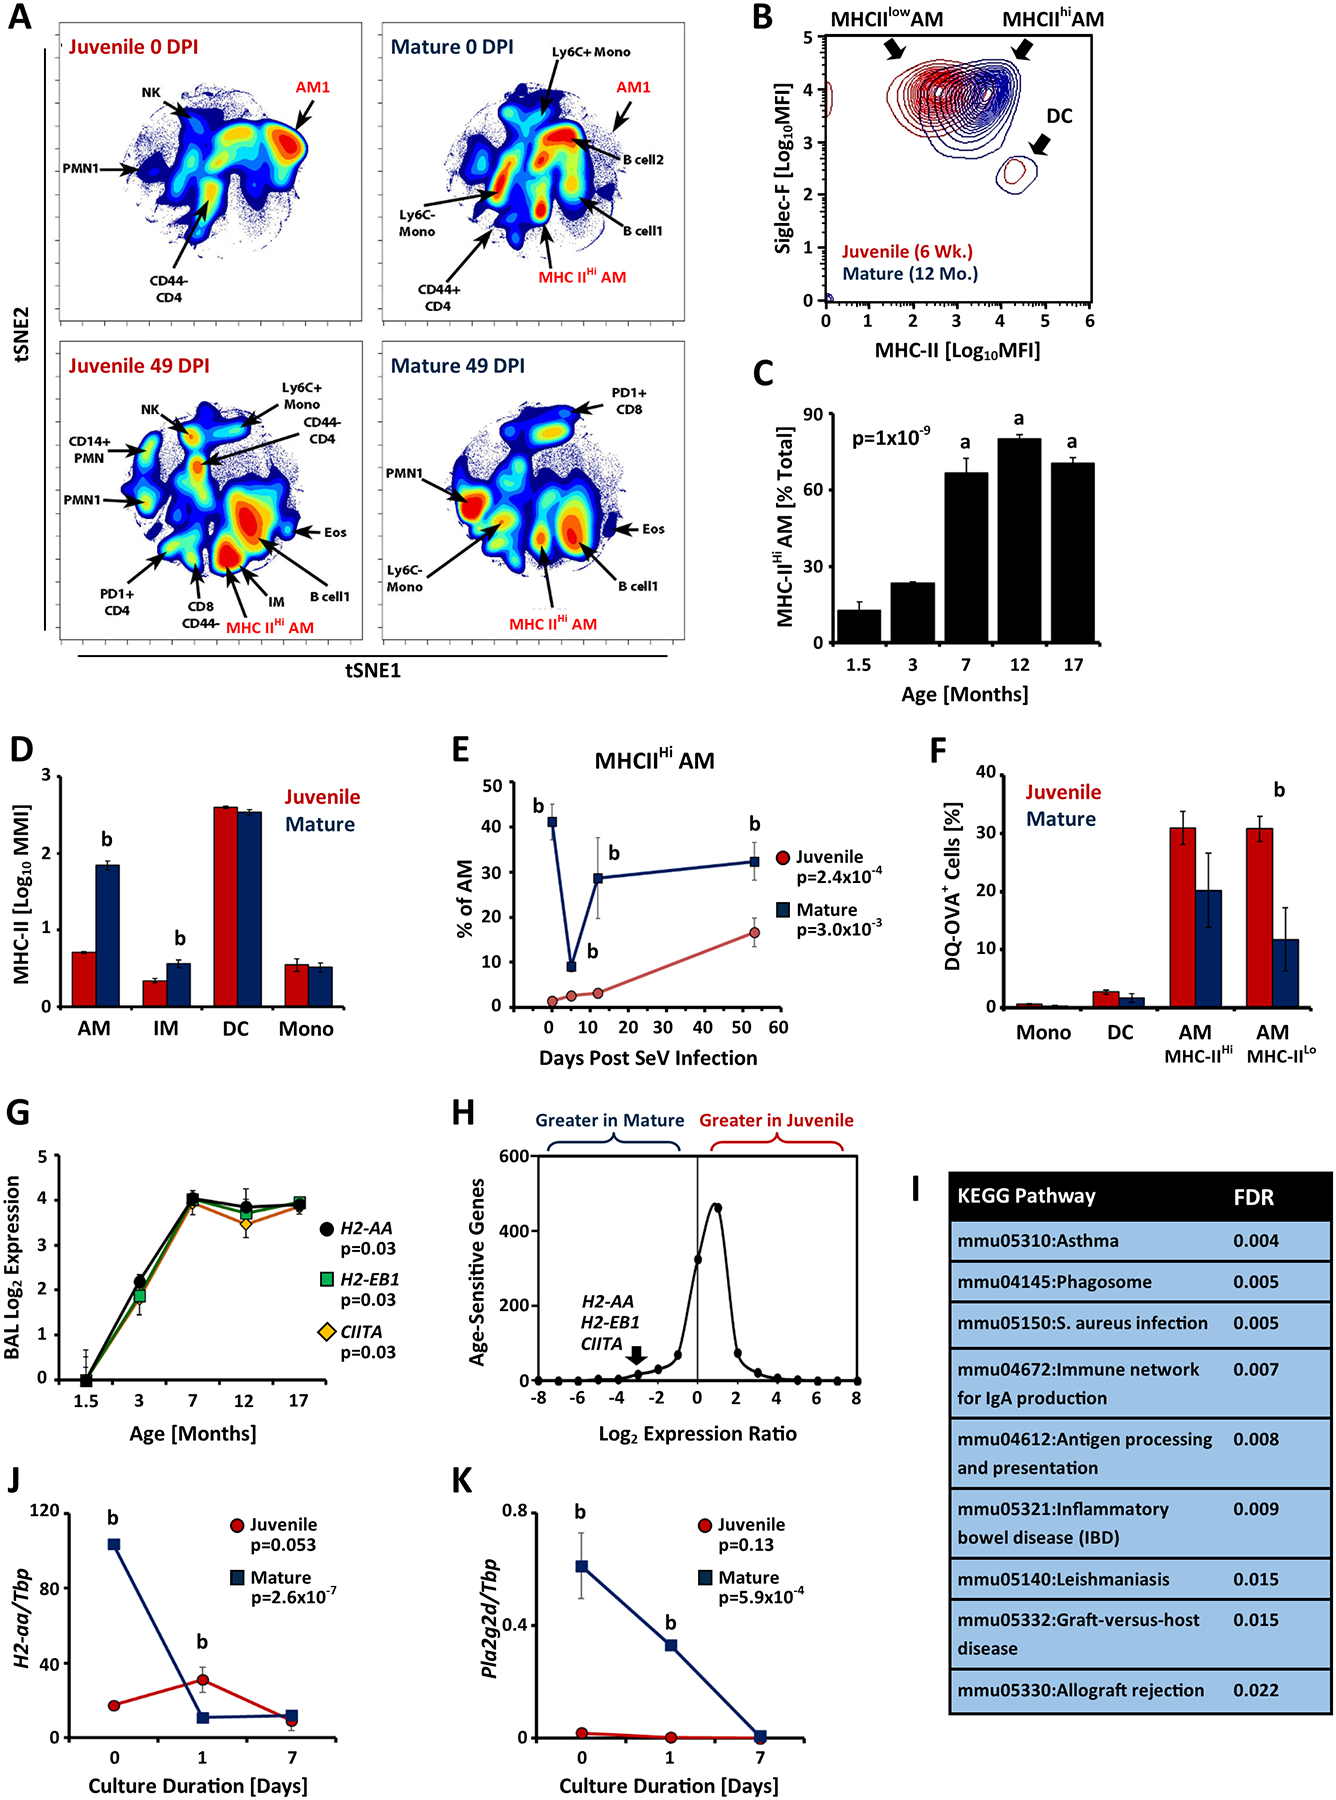
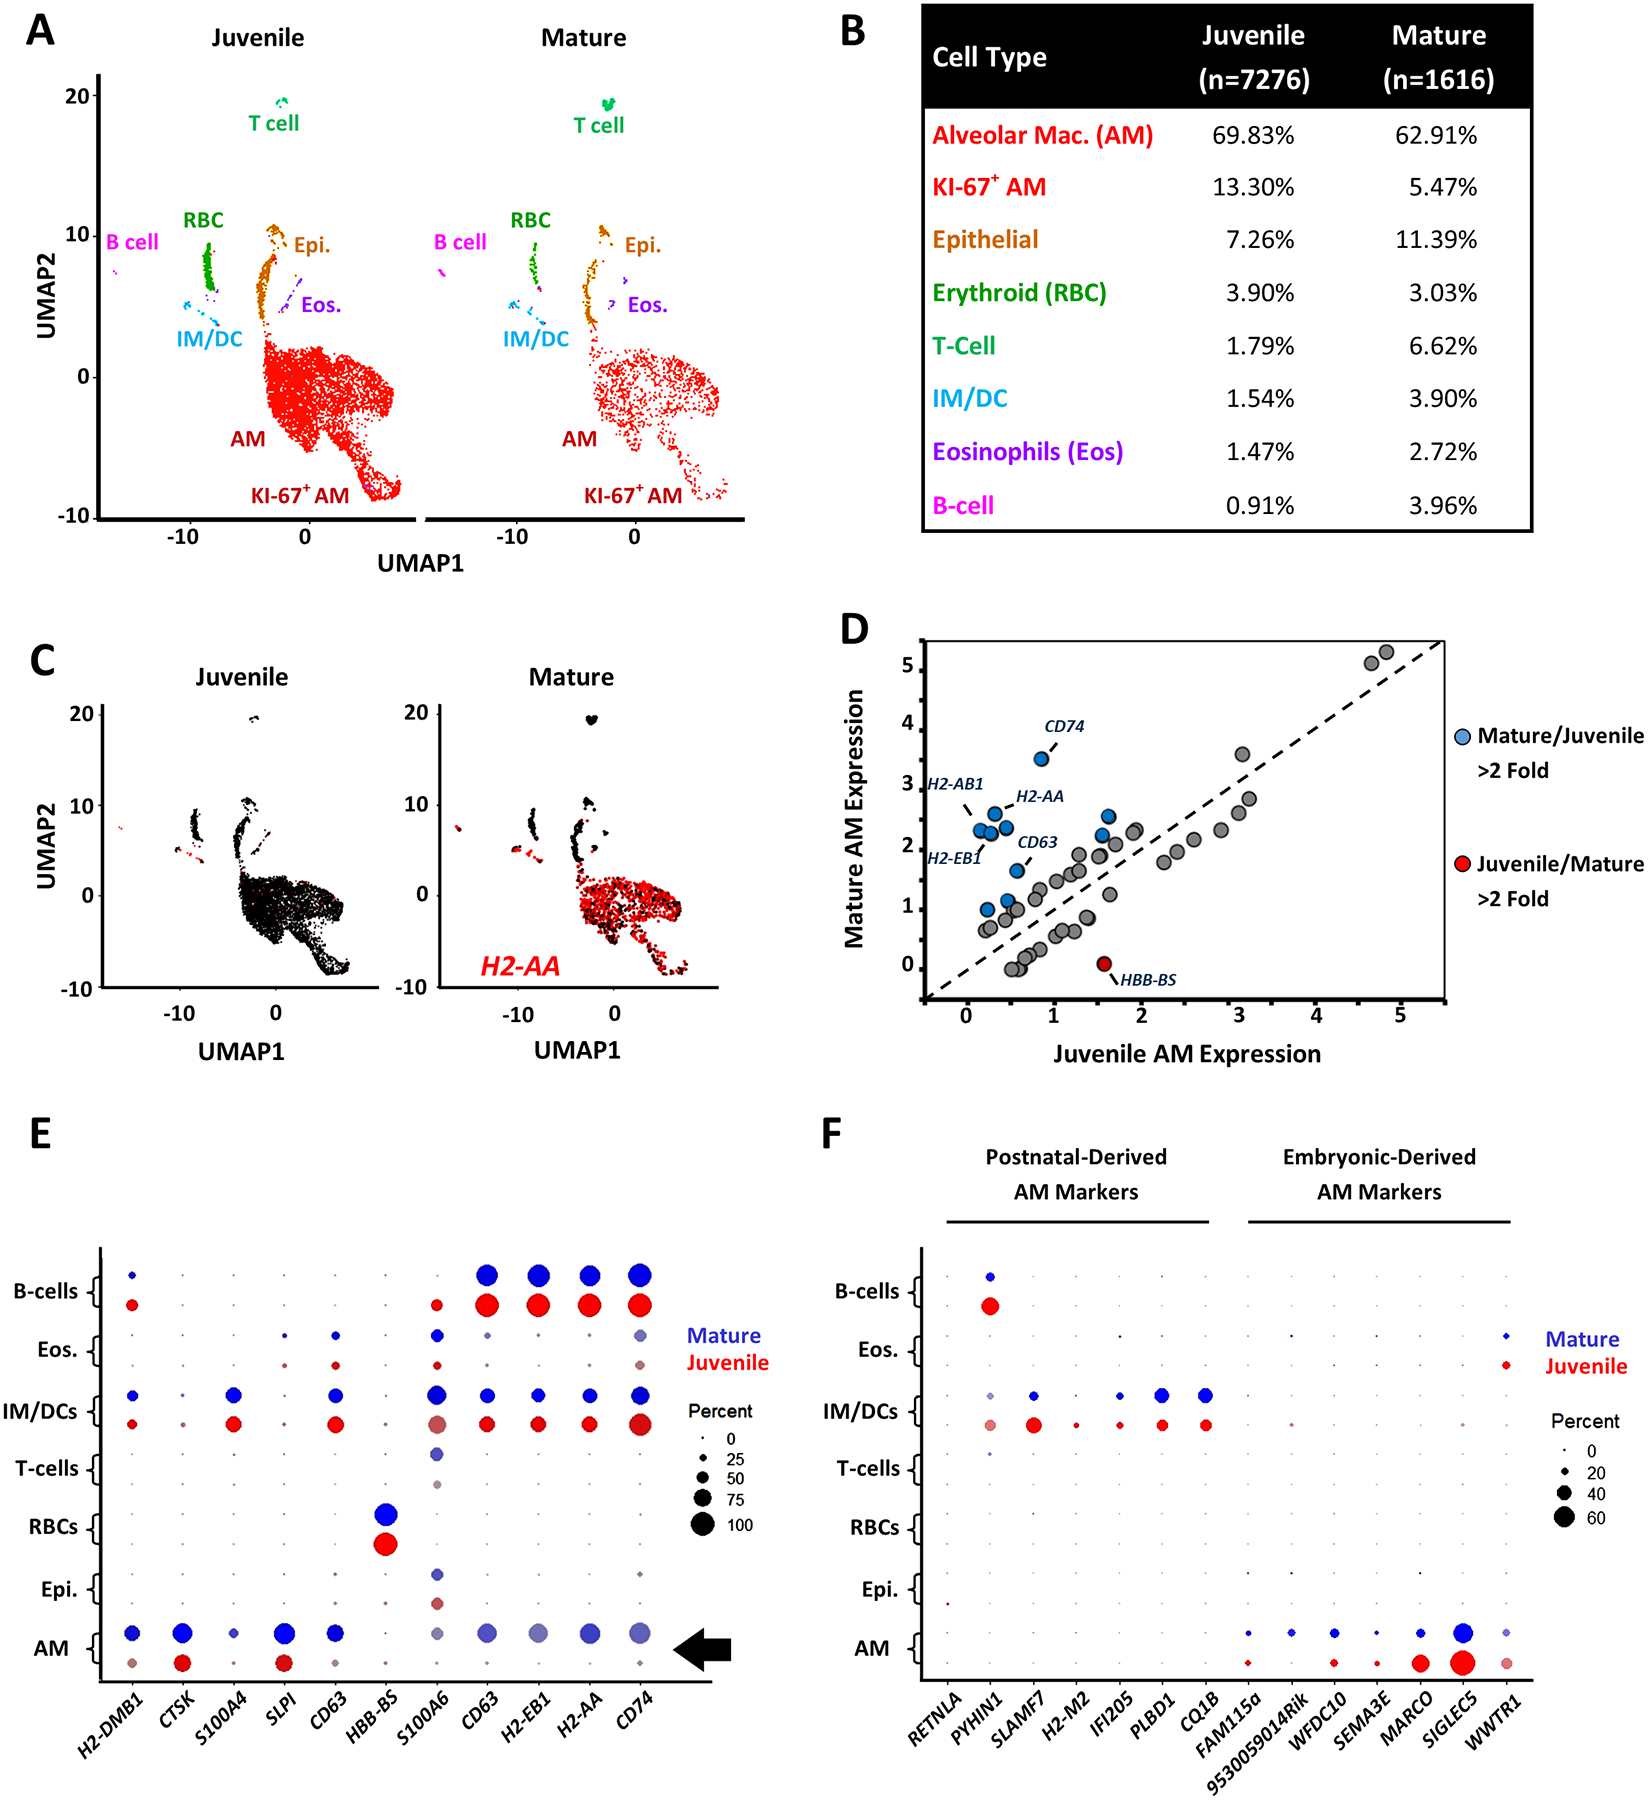
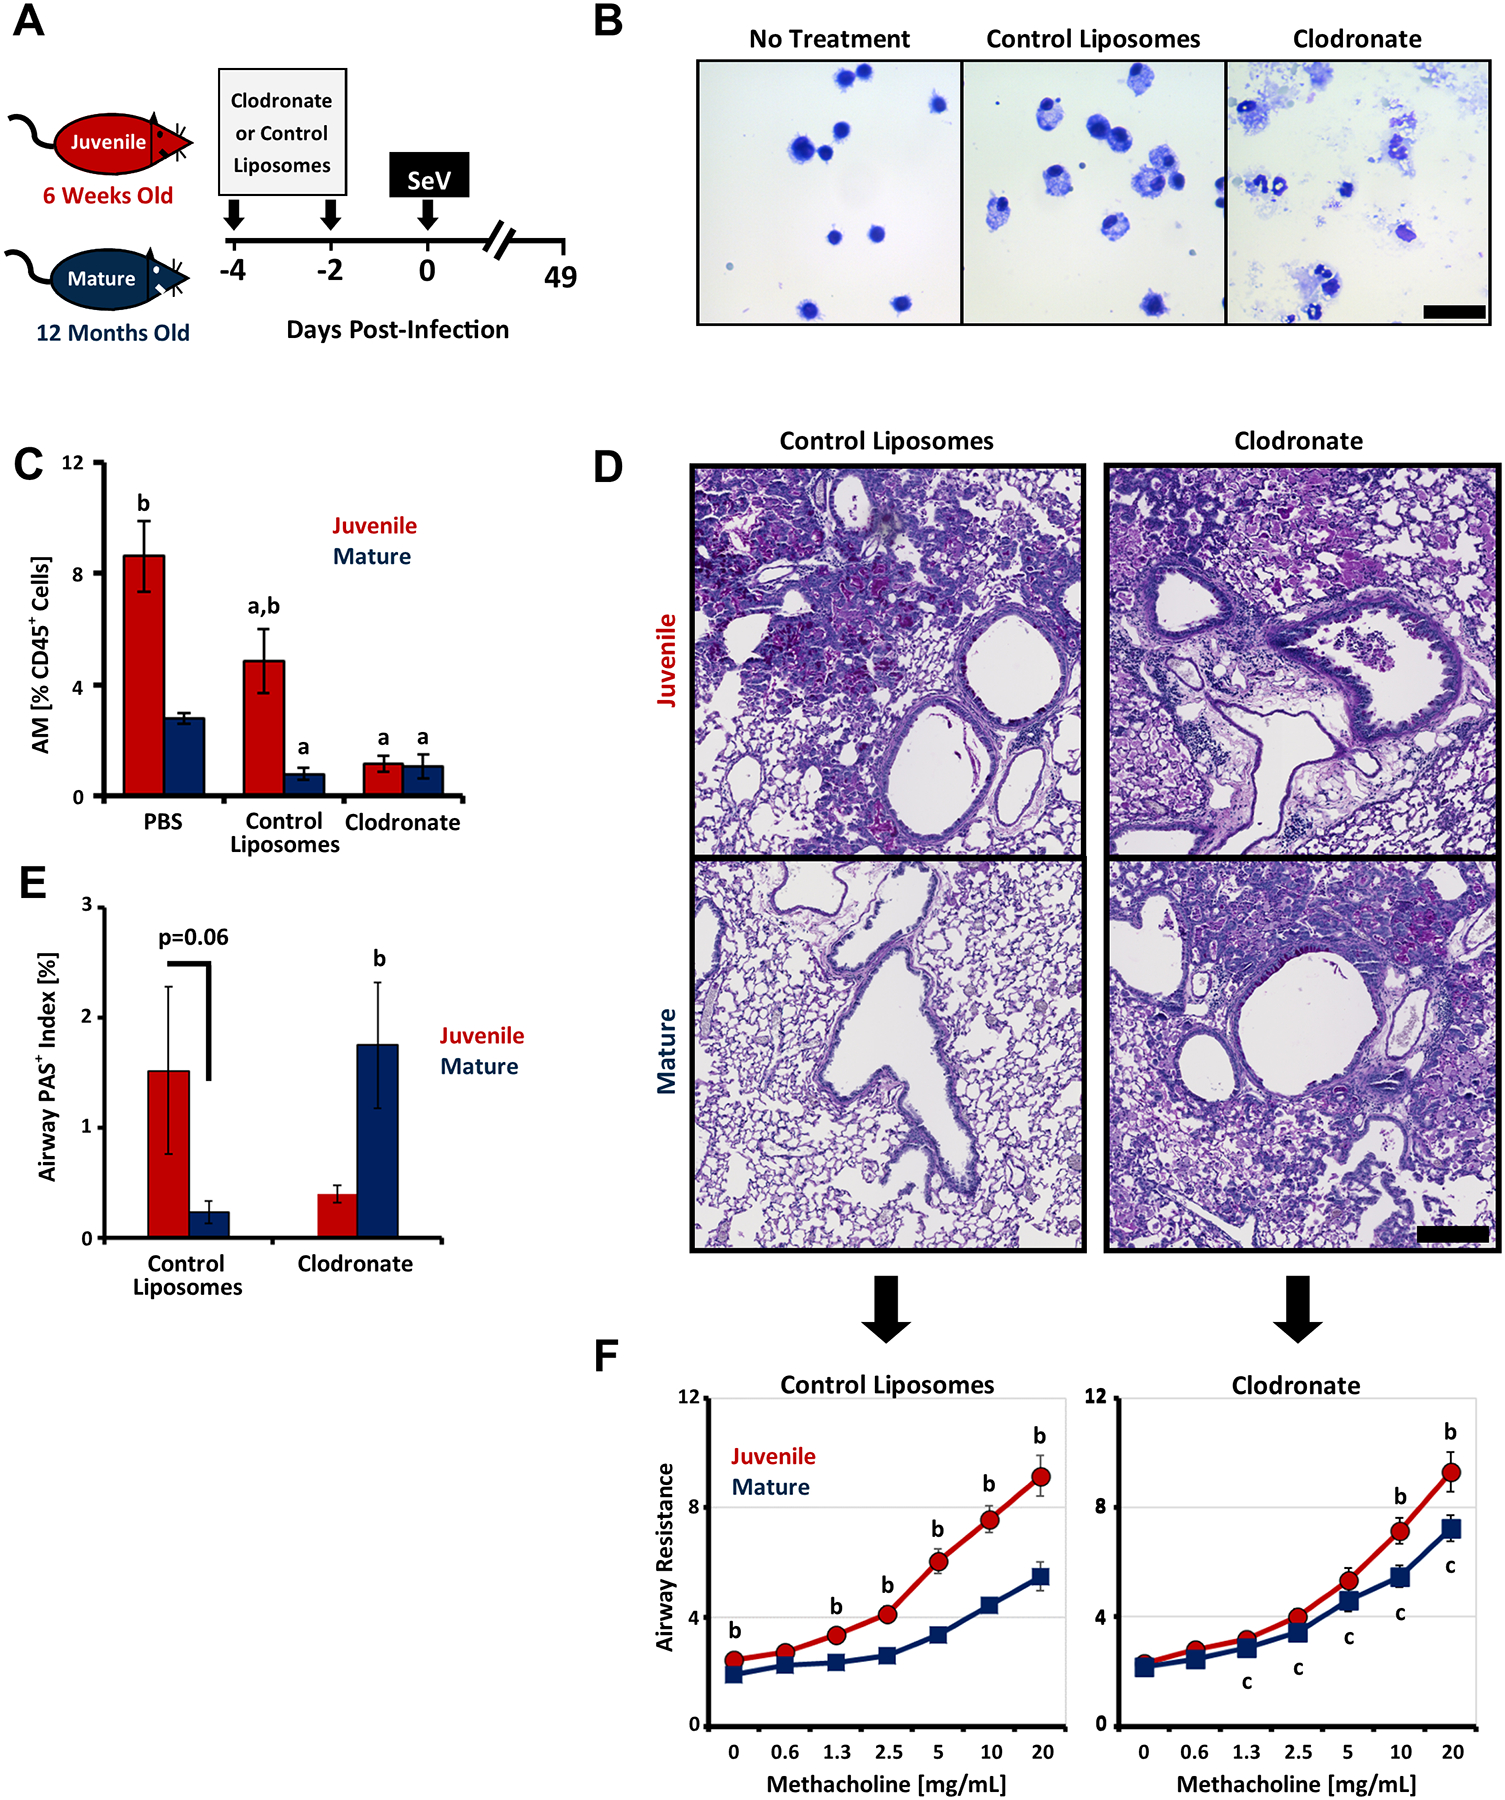
Asthma is a chronic disease of childhood, but for unknown reasons, disease activity sometimes subsides as children mature. In this study, we present clinical and animal model evidence suggesting that the age dependency of childhood asthma stems from an evolving host response to respiratory viral infection. Using clinical data, we show that societal suppression of respiratory virus transmission during coronavirus disease 2019 lockdown disrupted the traditional age gradient in pediatric asthma exacerbations, connecting the phenomenon of asthma remission to virus exposure. In mice, we show that asthmatic lung pathology triggered by Sendai virus (SeV) or influenza A virus is highly age-sensitive: robust in juvenile mice (4-6 wk old) but attenuated in mature mice (>3 mo old). Interestingly, allergen induction of the same asthmatic traits was less dependent on chronological age than viruses. Age-specific responses to SeV included a juvenile bias toward type 2 airway inflammation that emerged early in infection, whereas mature mice exhibited a more restricted bronchiolar distribution of infection that produced a distinct type 2 low inflammatory cytokine profile. In the basal state, aging produced changes to lung leukocyte burden, including the number and transcriptional landscape of alveolar macrophages (AMs). Importantly, depleting AMs in mature mice restored post-SeV pathology to juvenile levels. Thus, aging influences chronic outcomes of respiratory viral infection through regulation of the AM compartment and type 2 inflammatory responses to viruses. Our data provide insight into how asthma remission might develop in children.


Conflict of interest statement

DISCLOSURES

The authors report no conflict of interest.

Figures

Figure 1.
Figure 1.. Viruses are critical for the age effect in pediatric asthma.
(A, B). Histograms depicting ED visits for asthma (A) and allergic reactions (B) binned by patient age. Each age bin represents a 1 year interval (e.g. 2=ages 1–2 years). Blue circles, pre-COVID lockdown data from 2016–2020 (mean ± SE). Red squares, data covering the first 12 months post-lockdown. (C,D) Relative reduction in ED visits for Asthma (C) or allergic reaction (D) in the year post-COVID lockdown vs. the 4 year average pre-lockdown. Best fit linear regression line, Pearson’s r and p values are depicted.
Figure 2.
Figure 2.. Asthmatic phenotypes are age-dependent when provoked by virus.
(A) Cartoon depicting the SeV infection model. Time periods denoting acute SeV bronchiolitis, peak lung viral load, and the development of chronic lung pathology are depicted by shaded bars. (B) Representative Periodic Acid Schiff (PAS)-stained lung sections obtained 49 days post-SeV infection (DPI, 1.5 × 10⁵ pfu/mouse) from juvenile mice (6 weeks old) or mature mice (11 months old). Sham-infected juvenile mice are shown as a negative control. (C) Quantification of mucous cell metaplasia via PAS staining (mean ± SE) in PBS-treated mice (n=3) and SeV-infected mice (n=7–11). (D, E) Induction of lung Muc5ac expression (D) and Il-13 expression (E) at 49 DPI as a function of mouse age and SeV dose (mean ± SE). Expression is normalized to PBS-treated mice. White bars, PBS (n=5–6); grey bars, 1.5 × 10⁵ pfu SeV (n=6–9); black bars, 7.5 × 10⁵ pfu SeV (n=5–6). (F) Induction of M2 gene expression and Il-33 at SeV 49 DPI (1.5 × 10⁵ pfu/mouse, n=5–9). Bars represent the mean ± SE normalized to young PBS-treated mice. (G) Induction of Muc5ac expression by SeV (1.5 × 10⁵ pfu) at 49 DPI in mice of various ages (mean ± SE, n=12/group). Data are pooled from 3 independent experiments. (H) Airway resistance as a function of methacholine exposure at SeV 49 DPI (mean ± SE). Red circles, SeV-infected juveniles (n=10); blue squares, SeV-infected mature mice (n=8); pink circles, PBS-treated juvenile mice (n=6); light blue squares, PBS-treated mature mice (n=3). (I) Effect of sex and age on Muc5ac expression (mean ± SE, n=6–9 per group) at SeV 49 DPI (1.5 × 10⁵ pfu/mouse) relative to PBS-treated mice. ap<0.05 SeV-infected vs. PBS-treated; bp<0.05 juvenile vs. mature mice; cp<0.05 vs. 6 weeks old SeV infected mice. Student’s 2-Tailed t-Test performed on log-normalized data.
Figure 3.
Figure 3.. Chronic lung disease after influenza A virus (IAV) is age-dependent.
Data were pooled from 2 independent experiments. (A) Cartoon depicting our protocol for producing IAV-induced chronic lung disease. Mice were inoculated with 5 pfu IAV/mouse. Lungs were assessed for chronic pathology at 21 days post-infection (DPI). (B) IAV viral gene expression in whole lung homogenates at 5 DPI (mean ± SE, n=6 per group). Expression is normalized to PBS control lungs. (C) Representative PAS-stained lung sections at 21 DPI. Scale bar=500 μm. (D) Airway resistance as a function of methacholine dose (mean ± SE) of IAV-infected juvenile (red circles, n=12), IAV-infected mature (blue squares, n=13), PBS-treated juvenile (pink circles, n=3), and PBS-treated mature (light blue squares, n=6) mice. (E) Quantification of mucous cell metaplasia at IAV 21 DPI as measured by PAS+ morphometry (mean ± SE, n=4–9). (F) Induction of Muc5ac expression by IAV at 21 DPI in juvenile and mature mice. White bars, PBS (n=6); black bars, IAV treated mice (n=7–19). Expression is normalized to PBS-treated controls. ap<0.05 SeV-infected vs. PBS-treated; bp<0.05 juvenile vs. mature mice, Student’s 2-Tailed t-Test performed on log-normalized data.
Figure 4.
Figure 4.. Age-dependent differences in post-viral lung pathology persist in the setting of microbiome suppression.
Data are representative of 2 independent experiments. (A) Schematic depicting the experimental approach. Juvenile (6 weeks old) and mature mice (12 months old) were provided drinking water containing a broad spectrum antibiotic cocktail (grape Koolaid with vancomycin, neomycin, ampicillin, and metronidazole, or VNAM) or control sweetener (grape Koolaid) for 3 weeks (starting on −21 DPI) and then challenged with SeV (1.5 × 10⁵ pfu/mouse) or PBS. Treatment with VNAM or control sweetener continued until 7 DPI, and then mice were provided regular water for the duration of the experiments. Lung pathology was examined at 49 DPI. (B) Stool DNA content at various timepoints (mean ± SE, n=6–9). (C) Effect of VNAM treatment on the observed α-diversity of stool samples as determined by 16S sequencing (see Methods). Each datapoint represents a single biological sample. Note, fewer measurements at SeV 0 DPI and 5 DPI were possible due to the paucity of stool DNA content at these time points. (D) Interindividual differences in stool DNA samples over the course of VNAM treatment as determined by PCoA analysis. Each datapoint represents a single biological sample. Note that group differences between juvenile and mature mice are most evident prior to VNAM treatment (−21 DPI). (E) SeV viral RNA expression at 5 DPI (mean ± SE, n=3 per group). (F) Airway response to methacholine at 49 DPI in control (left panel) versus VNAM treated mice (right panel). Datapoints represent means ± SE (n=4–9). (G) Lung expression at SeV 49 DPI of Muc5ac (left panel), Il33 (middle panel), and Trem2 (right panel). Data are expressed as fold induction over age-matched PBS-challenged controls (mean ± SE, n=6–9). ap<0.05 SeV-infected vs. PBS-treated; bp<0.05 juvenile vs. mature mice, Student’s 2-Tailed t-Test performed on log-normalized data.
Figure 5.
Figure 5.. Acute differences in SeV bronchiolitis between juvenile and mature mice.
Data points represent means ± SE throughout. (A) Weight loss indexed to starting weight (9–12 mice per group) in juvenile (5 weeks old) and mature (11 months old) mice infected with 1.5×10⁵ or 7.5×10⁵ pfu SeV/mouse. Data are representative of 2 independent dose-response experiments. (B, C) Lung SeV RNA expression (B) and BAL cell counts (C) at various times post-SeV infection (1.5×10⁵ pfu/mouse) in juvenile mice (5–6 weeks old, n=4–8) and mature mice (10–12 months old, n=4–7 per group). Data was pooled from 2 independent time course experiments. (D–F) BAL differential cell count for macrophages (D), neutrophils (E), and lymphocytes (F) at various times post-SeV infection. (G-I) Airway resistance as a function of methacholine exposure at 5 days ((G), n=5–13 per group), 8 days ((H), n=5–13 per group), and 12 days ((I), n=3–13 per group) post-SeV infection (1.5×10⁵ pfu/mouse). Data were pooled from 2 independent time-course experiments. (J) Representative immunofluorescence staining of juvenile (5 weeks old) and mature (10 months old) mouse lungs at various times post-SeV infection (1.5×10⁵ pfu/mouse). Green stain, SeV; blue stain, DAPI. Scale bar= 50 μm. (K) Quantification of SeV+ airway cell frequency (n=15 microscopic fields and 3–4 biological replicates per group). ap<0.05 SeV-infected vs. PBS-treated; bp<0.05 juvenile vs. mature mice, Student’s 2-Tailed t-Test performed on log-normalized data.
Figure 6:
Figure 6:. Age-selective cytokine responses to SeV.
(A) Heat map of BAL cytokine abundance as a function of time after SeV infection (1.5×10⁵ pfu/mouse) and mouse age at the time of infection (juvenile, 5 weeks old; mature, 11 months old). Dark blue represents lowest median normalized cytokine concentrations, yellow represents highest concentration (n=4–12 per cell). (B) Principle component analysis of BAL cytokine profiles (n=71). Red and blue font depict significant differential expression at SeV 49 DPI favoring juvenile (red) or mature mice (blue). Underlining depicts cytokine profiles that correlate with airway resistance at 49 DPI (p<0.05, n=17). Representative cytokine profiles for each of the 3 clusters are shown to the right. (C) Magnitude of age-specific differential expression at SeV 49 DPI (mean, n=7–10 per age group) versus correlation to airway resistance in the same animals. For all cytokines depicted there was significant differential expression based on age group (bp<0.05, Student’s 2-Tailed t-Test performed on log-normalized data). Statistically significant correlations are depicted by underlining. D–H. BAL expression post-SeV infection for IL-10 (D), G-CSF (E), IL15/15R (F), IL-4 (G), and IL-5 (H) in juvenile and mature mice. Data points represent the mean ± SE (n=4–12). *p<0.05 juvenile vs. mature mice, Student’s 2-Tailed t-Test performed on log-normalized data.
Figure 7.
Figure 7.. Induction of asthmatic phenotypes by Alternaria exposure is similar in juvenile and mature mice.
Data are pooled from 3 independent experiments comparing juvenile (6 weeks old) mice to mature (12 months old) mice. (A) Protocol for inducing chronic lung disease by serial intranasal (i.n.) instillation of Alternaria extract (see Methods). (B) Representative PAS-stained lung sections 10 days after serial Alternaria exposure. Scale bar=500 μm. (C) Induction of lung Muc5ac, IL5, IL33, and IL13 expression by Alternaria treatment in juvenile mice (n=13) and mature mice (n=14). Data are expressed as fold induction over control (PBS-treated) mice. (D). Morphometric quantification of mucous cell metaplasia via airway PAS staining (mean ± SE) in juvenile mice (n=4–7) and mature mice (n=4–7). (E) Lung eosinophil (CD11b+, SiglecF+,CD11c) frequency (mean ± SE) in PBS treated (n=3) and Alternaria treated mice (n=7–8 per group). (F). Morphometric quantification of airspace consolidation (mean ± SE) in juvenile mice (n=4–7) and mature mice (n=4–7). ap<0.05 SeV-infected vs. PBS-treated; bp<0.05 juvenile vs. mature mice, Student’s 2-Tailed t-Test performed on log-normalized data. (G) Airway resistance as a function of methacholine exposure after Alternaria or PBS treatment. Each data point represents the mean ± SE of Alternaria-treated juveniles (n=10), Alternaria-treated mature mice (n=8), PBS-treated juvenile mice (n=7), and PBS-treated mature mice (n=9).
Figure 8.
Figure 8.. Mass cytometry identifies age-specific leukocyte responses to SeV.
Data are representative of 2 independent mass cytometry analyses. (A) Principal Component Analysis (PCA) of lung leukocyte burden in juvenile (5 weeks old) and mature mice (11 months old) at various times after SeV infection (1.5×10⁵ pfu/mouse). Each symbol represents data from an individual mouse. (B) PCA clustering of leukocyte dynamics after SeV infection. Each data point represents an individual cell type. Co-clustering cell types are circumscribed by ovals. Stacked line graphs depicting the normalized cell frequencies as a percent of CD45+ cells in each of the 3 identified clusters is shown in the center of the panel. Examples of key cell types comprising the clusters are listed to the right. (C) Volcano plot depicting relative overall abundance of specific cell types in juvenile versus mature mice, combining all time points pre- and post-SeV infection. Cell types with statistically significant differences (p<0.05, Student’s 2-Tailed t-Test of log-normalized data) are depicted with colored symbols. Cell types that did not achieve statistical significance are depicted by black symbols. (D–G) Lung burden of B-cells (D), Polymorphonuclear Leukocytes (PMNs, (E)), Eosinophils (F), and Alveolar Macrophages (G) at various points after SeV infection. Data points represent the mean ± SE (n=4–7). ap<0.05 SeV-infected vs. PBS-treated; bp<0.05 juvenile vs. mature mice, Student’s 2-Tailed t-Test performed on log-normalized data. For additional cell types see Supplemental Fig. 1. Representative gates are shown in Supplemental Fig. 3A.
Figure 9.
Figure 9.. Alveolar macrophage reprogramming with aging.
(A) viSNE analysis of mass cytometry from juvenile (5 weeks old) and mature mice (11 months old). The top row represents data from naïve mice (0 DPI) and the bottom row SeV 49 DPI (1.5×10⁵ pfu/mouse). Specific cell types are denoted, and AM populations are labeled in red. (B) Representative flow cytometric contour plot depicting CD45+, CD11bmid/lo, CD11C+ cells from juvenile and mature healthy mice. AM populations are distinguished by high surface expression of Siglec-F and dendritic cells (DCs) by lower surface expression. Data are pooled from two independent experiments (n=5, 300,000 events per age group). See Supplemental Fig. S3B for representative gates. (C) Frequency of MHC-IIHi AMs as a function of age (mean ± SE, n=5 per group). Statistical significance by 1-way ANOVA of log-normalized data is depicted. (D) Expression of MHC-II protein in various lung myeloid cell types as determined by mass cytometry. Bars represent the median metal intensity (MMI) ± SE in healthy juvenile (n=7) and mature mice (n=7). (E) Effect of SeV infection (1×10⁵ pfu/mouse) on the frequency of MHC-IIHi AMs (mean ± SE, n=4–7 per time point) expressed as a percentage of total AMs. (F) Antigen processing activity in various lung myeloid cell types from 6 week juvenile and 12-month mature mice as measured by the DQ-OVA assay (see Methods). Bars represent mean ± SE (n=10 per group pooled from two independent experiments). See Supplemental Fig. 3C for representative gates. (G) BAL expression of H2-AA, H2-EB1, and CIITA in healthy mice as a function of age as measured by bulk RNAseq. Data represents mean Lima-Voom transformed Log2 CPM ± SE (n=3 pools/timepoint each composed of 3 mice). Statistical significance via one-way Kruskal-Wallis test is depicted for each gene. (H) Histogram analysis of 1,024 genes demonstrating age-sensitive expression in BALs (p<0.05, one-way Kruskal-Wallis test). The x-axis represents log2 mean expression ratios for mature (≥7 months old) divided by juvenile gene expression (≤3 months old). The bin containing H2-aa, H2-eb1, and Ciita is highlighted (arrow). (I) KEGG pathway functional enrichment analysis of 1,024 genes demonstrating age-sensitive expression in BALs. Statistically enriched pathways (FDR<0.05) are depicted. Blue highlighting reflects that the enrichment of these pathways is dependent in genes overexpressed in mature vs. juvenile mice. (J, K) BAL cell expression of H2-aa (J) and Pla2g2d (K) as a function on in vitro culture duration (mean ± SE, n=3–7 per time point). Statistical significance via one-way Kruskal-Wallis test is depicted. ap<0.05 SeV-infected vs. PBS-treated; bp<0.05 juvenile vs. mature, Student’s 2-Tailed t-Test on log-normalized data.
Fig. 10.
Fig. 10.. Single cell transcriptomic analysis of AM aging.
(A) UMAP principal component analysis of scRNAseq data obtained from pooled mouse BALs from juvenile (6 weeks old, n=10, 7,276 cells) and mature mice (12 months old, n=9, 1,616 cells). Major cell types observed are depicted. (B) BAL cell differential in healthy juvenile and mature mice. (C) UMAP visualization of H2-AA expression (orange dots) in juvenile and mature AMs. (D) Top 25 differentially expressed genes in AMs. Genes differentially expressed greater than twofold in juvenile and mature mice are depicted with red and blue dots, respectively. The dashed line represents equal expression in juvenile and mature AMs (loge CPM). (E) Dot plot analysis of genes differentially expressed greater than twofold in juvenile and mature mice (see colored symbols, panel (D)). Expression in AMs is highlighted (arrow). (F) “Dot Blot” expression analysis of marker genes specifying embryonically derived tissue resident AMs postnatal (bone marrow-derived) AMs (23).
Figure 11.
Figure 11.. Alveolar macrophages suppress post-viral pathology specifically in mature mice.
Data are pooled from 3 independent experiments comparing juvenile (6–8 weeks old) to mature (10–12 months old) mice. (A) Cartoon depicting our experimental approach for macrophage depletion (also see Methods). Mice received 2 intranasal doses of clodronate or control liposomes prior to infection with SeV (5×10⁵ pfu/mouse). (B) Representative micrographs of Diff-Qwik stained BALs from juvenile mice receiving control liposomes, clodronate liposomes, or no treatment. Scale bar=40 μm. (C) Flow cytometric quantification of AMs as a percentage of CD45+ live cells on the day of SeV infection (mean ± SE, n=3–8 pooled from two independent experiments). (D) Representative PAS-stained micrographs depicting lung pathology 49 days post-SeV infection. Scale bar=400 μm. Arrows point to corresponding methacholine challenge data (panel (E)). (E) Airway resistance (mean ± SE) as a function of methacholine exposure at SeV 49 DPI. The left panel depicts SeV-infected juvenile (n=10–11) and mature (n=7–8) mice pre-treated with control liposomes and the right depicts mice treated with clodronate liposomes. (F) Morphometric quantification of mucous cell metaplasia via airway PAS staining at SeV 49 DPI (mean ± SE) in SeV-infected juvenile (n=7–11) and mature (n=7–8) mice. ap<0.05 SeV-infected vs. PBS-treated; bp<0.05 juvenile vs. mature mice, Student’s 1-Tailed t-Test performed on log-normalized data.

Similar articles

Cited by

  • The breath volatilome is shaped by the gut microbiota.
    Hernandez-Leyva AJ, Berna AZ, Liu Y, Rosen AL, Lint MA, Whiteside SA, Jaeger N, McDonough RT, Joardar N, Santiago-Borges J, Tomera CP, Luo W, John ARO, Kau AL. Hernandez-Leyva AJ, et al. medRxiv [Preprint]. 2024 Aug 8:2024.08.02.24311413. doi: 10.1101/2024.08.02.24311413. medRxiv. 2024. PMID: 39132488 Free PMC article. Preprint.
  • Effect of the COVID-19 Lockdown on Asthma Biological Rhythms.
    Hazan G, Fox C, Eiden E, Anderson N, Friger M, Haspel J. Hazan G, et al. J Biol Rhythms. 2022 Apr;37(2):152-163. doi: 10.1177/07487304221081730. Epub 2022 Mar 23. J Biol Rhythms. 2022. PMID: 35319293 Free PMC article.
  • Age-dependent rebound in asthma exacerbations after COVID-19 lockdown.
    Hazan G, Fox C, Mok H, Haspel J. Hazan G, et al. J Allergy Clin Immunol Glob. 2022 Nov;1(4):314-318. doi: 10.1016/j.jacig.2022.06.001. Epub 2022 Aug 10. J Allergy Clin Immunol Glob. 2022. PMID: 36377231 Free PMC article.
  • Multi-organ phenotypes in mice lacking latent TGFβ binding protein 2 (LTBP2).
    Bodmer NK, Knutsen RH, Roth RA, Castile RM, Brodt MD, Gierasch CM, Broekelmann TJ, Gibson MA, Haspel JA, Lake SP, Koenitzer JR, Brody SL, Silva MJ, Mecham RP, Ornitz DM. Bodmer NK, et al. Dev Dyn. 2024 Feb;253(2):233-254. doi: 10.1002/dvdy.651. Epub 2023 Sep 9. Dev Dyn. 2024. PMID: 37688792 Free PMC article. Review.

References

    1. Mims JW 2015. Asthma: definitions and pathophysiology. Int Forum Allergy Rhinol 5 Suppl 1: S2–6. - PubMed
    1. Yunginger JW, Reed CE, O’Connell EJ, Melton LJ 3rd, O’Fallon WM, and Silverstein MD. 1992. A community-based study of the epidemiology of asthma. Incidence rates, 1964–1983. The American review of respiratory disease 146: 888–894. - PubMed
    1. Dharmage SC, Perret JL, and Custovic A. 2019. Epidemiology of Asthma in Children and Adults. Front Pediatr 7: 246. - PMC - PubMed
    1. Wenzel SE 2012. Asthma phenotypes: the evolution from clinical to molecular approaches. Nature medicine 18: 716–725. - PubMed
    1. Strachan DP, Butland BK, and Anderson HR. 1996. Incidence and prognosis of asthma and wheezing illness from early childhood to age 33 in a national British cohort. BMJ (Clinical research ed.) 312: 1195–1199. - PMC - PubMed

Publication types

MeSH terms