. 2022 Dec;13(1):79-93.
doi: 10.1080/19491034.2022.2034286.

Uip4p modulates nuclear pore complex function in Saccharomyces cerevisiae

Affiliations

Uip4p modulates nuclear pore complex function in Saccharomyces cerevisiae

Pallavi Deolal et al. Nucleus. 2022 Dec.

Abstract

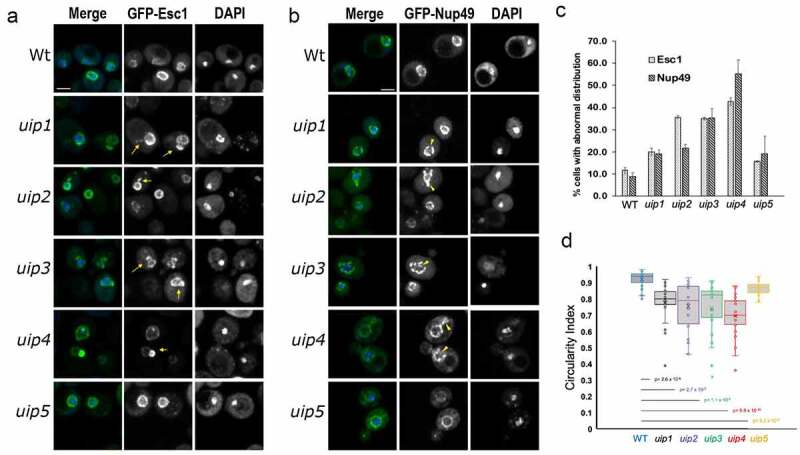
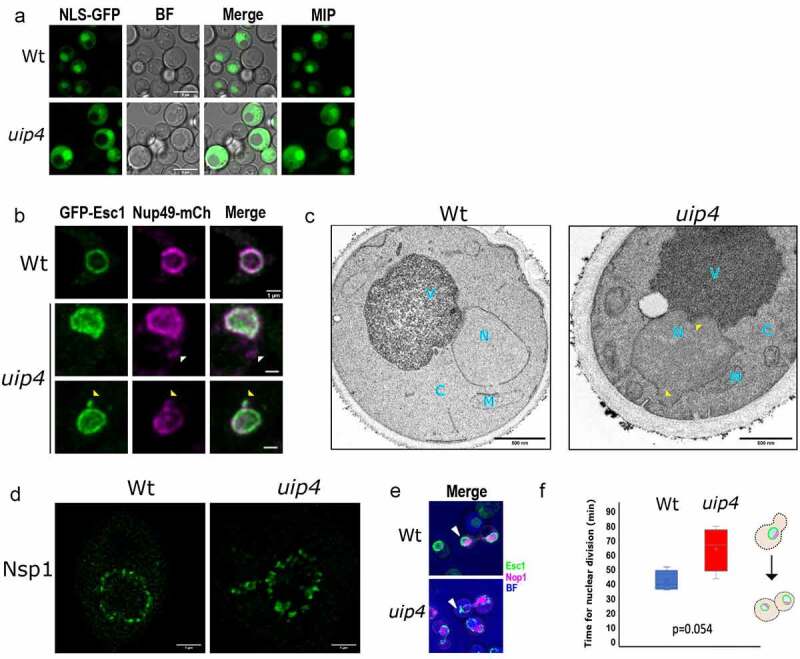
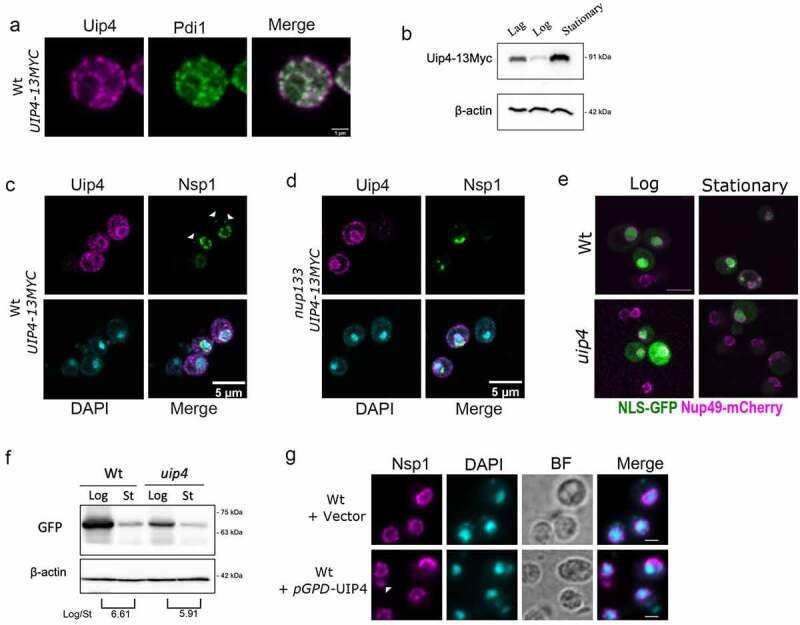
A double membrane bilayer perforated by nuclear pore complexes (NPCs) governs the shape of the nucleus, the prominent distinguishing organelle of a eukaryotic cell. Despite the absence of lamins in yeasts, the nuclear morphology is stably maintained and shape changes occur in a regulated fashion. In a quest to identify factors that contribute to regulation of nuclear shape and function in Saccharomyces cerevisiae, we used a fluorescence imaging based approach. Here we report the identification of a novel protein, Uip4p, that is required for regulation of nuclear morphology. Loss of Uip4 compromises NPC function and loss of nuclear envelope (NE) integrity. Our localization studies show that Uip4 localizes to the NE and endoplasmic reticulum (ER) network. Furthermore, we demonstrate that the localization and expression of Uip4 is regulated during growth, which is crucial for NPC distribution.

Keywords: Nuclear envelope; Uip4; nuclear pore complex; yeast.


Conflict of interest statement

No potential conflict of interest was reported by the author(s).

Figures

Figure 1.
Figure 1.
Loss of UIPs results in altered nuclear shape and nuclear import. a, b) Wt and strains harboring indicated deletions were examined for nuclear morphology and distribution of nuclear pores using GFP-Esc1 (a) and GFP-Nup49 (b) plasmids respectively. The maximum intensity projection (MIP) of representative cells is shown. DAPI staining is used to define the nucleus. The abnormality in the nuclear membrane and pore complex distribution is shown by yellow arrows and arrowheads respectively. Scale-2μm . c) Quantification of defects is shown in the bar graph as the fraction of cell population showing abnormality (n>300, 3 independent experiments, error bars indicate SEM). d)The circularity index of the nuclear envelope for the indicated strains is shown. 25-30 cells picked randomly were used for measurement. The horizontal line shows the mean of the distribution.
Figure 2.
Figure 2.
Loss of UIP4 results in altered nuclear shape and nuclear import. a)Nuclear import was tested in Wt and uip4 bearing NLS-2X GFP plasmid. Representative images are shown. Scale-5μm b)Representative images of Wt and uip4 co-transformed with GFP-Esc1 and Nup49-mCherry are shown. White arrowheads indicate non-NE associated nups and yellow arrowheads indicate NE extensions bearing nups. Scale-1μm c)Transmission electron micrographs for Wt and uip4 are shown. N-nucleus, C-cytoplasm, V-vacuole, M-mitochondria. yellow arrowhead- NE deformity in uip4. Scale-500nm d) Deconvolved STED micrographs for Wt and uip4 are shown. The signal in green shows Nsp1 localization.Scale-1μm e) MIP of dividing Wt and uip4 cells with NE (GFP-Esc1) in green and nucleolus (mRFP-Nop1) in magenta are shown. Arrowheads- associated NE abnormality. f) The plot indicates the time taken by Wt and uip4 cells to complete nuclear division. The horizontal line represents the mean.
Figure 3.
Figure 3.
Loss of UIP4 results in NPC clustering a) Live cell imaging was done for Wt and uip4 strains expressing indicated GFP tagged Nups from their endogenous loci. The spectrum lookup table (LUT) is used to represent the GFP signal. Scale-2μm b) The box plot represents the aggregation index calculated from the GFP signal along the NE in the mid-focal plane of 25-30 individual cells from Wt (blue) and uip4 (red). The horizontal line is the mean value. c) Live cell imaging was done for Wt and uip4 strains expressing Pom33-GFP from its endogenous loci. Spectrum LUT is used for the GFP signal. Scale-2μm The inset shows MIP of a representative nucleus from Wt and uip4 in grayscale. The scale for Spectrum LUT is shown on the right. d) Fluorescence micrographs for Wt and uip4 co-expressing Nup157-GFP and Nup49-mCherry are shown. Scale-2μm. e) The extent of co-localization for Nup157-GFP and Nup49-mCherry shown in D was assessed by measuring the correlation coefficient between the two signals in the non-NE region. The horizontal line represents the mean. f) Western blot analysis was done to compare the expression levels of Nsp1, Nup157, and Nup188 in Wt and uip4 cells harvested from the mid-log phase. α-GFP was used to detect endogenously tagged Nup157 and Nup188, and actin is the loading control. g) Overnight cultures of the indicated strains were taken and sub-cultured by inoculating an equal number of cells in a fresh medium for 4 hours. Cells were then harvested and 10-fold dilutions were serially spotted on an SC plate. The plates were incubated at 30ºC for 2 days prior to imaging.
Figure 4.
Figure 4.
Uip4 localizes to NE/ER and its overexpression exacerbated NE defects a) Indirect immunofluorescence using α-myc was performed in the strain encoding UIP4-13xMyc to check the localization of Uip4. Co-staining with an ER marker Pdi1 is shown. Scale-1μm b) The western blot is representative of the expression level of Uip4 in cells harvested from either lag (O.D.600- 0.2-0.4), mid-log (O.D.600- 0.8-1.2), or stationary phase (O.D.600- 3.0-3.5). Uip4 was detected using α-myc. Actin is used as a loading control. c) Co-staining of Uip4 with an NPC marker, Nsp1, was done in cells harvested from the stationary phase. White arrowheads indicate non-NE associated cytosolic spots. Scale-5μm d) Localization of Uip4 in nup133 background was checked. Co-staining of Uip4 with an NPC marker, Nsp1, is shown. Scale-5μm e) Live cell imaging was performed in Wt and uip4 cells bearing NLS-GFP plasmid harvested from either mid-log or stationary phase. The overlay images showing NLS-GFP (green) and Nup49-mCherry (magenta) are indicative of the observation. Scale-5μm f) Western blot showing protein level of NLS-GFP detected using α-GFP is shown for wild type and uip4 cells harvested from log and stationary (St) phase. The quantification of the NLS-GFP in the Log/Stationary phase is shown (Average of 2 independent experiments). Actin is used as a loading control. g) The distribution of NPCs upon UIP4 OE was checked by monitoring the localization of Nsp1, an FG nucleoporin. Indirect immunofluorescence was performed in WT cells transformed with either E-pBevyL or pGPD-UIP4-pBevyL. White arrowhead indicates non-nuclear spots of Nsp1. Scale-2μm

Similar articles

Cited by

References

    1. Katta SS, Smoyer CJ, Jaspersen SL.. Destination: inner nuclear membrane. Trends Cell Biol. 2014;24:221–229. - PubMed
    1. Mekhail K, Moazed D. The nuclear envelope in genome organization, expression and stability. Nat Rev Cell Biol. 2010;11:317–328. - PMC - PubMed
    1. Beck M, Hurt E. The nuclear pore complex: understanding its function through structural insight. Nat Rev Mol Cell Biol. 2016;18:73–89. - PubMed
    1. Rajoo S, Vallotton P, Onischenko E, et al. Stoichiometry and compositional plasticity of the yeast nuclear pore complex revealed by quantitative fluorescence microscopy. Proc Natl Acad Sci U S A. 2018;201719398. DOI:10.1073/pnas.1719398115 - DOI - PMC - PubMed
    1. Rout MP, Aitchison JD, Suprapto A, et al. The yeast nuclear pore complex: composition, architecture, and transport mechanism. J Cell Biol. 2000;148:635–651. - PMC - PubMed

Publication types

MeSH terms

Substances

Grants and funding

Work in the laboratory of KM is supported by Council of Scientific and Industrial Research (CSIR) Council of Scientific and Industrial Research, India 37 (1725)/19/EMR-II and Department of Biotechnology (Department of Science and Technology, India BT/PR15450/COE/34/46/2016), SERB (Science and Engineering Research Board EMR /2017/003020), University Grants Commission- DRS and DST-FIST, Government of India. PD thanks the CSIR for the fellowship. IJ thanks Nagaland University for support.

LinkOut - more resources