. 2022 Jan 19;25(2):103784.
doi: 10.1016/j.isci.2022.103784. eCollection 2022 Feb 18.

Single-cell resolution of MET- and EMT-like programs in osteoblasts during zebrafish fin regeneration

Affiliations

Single-cell resolution of MET- and EMT-like programs in osteoblasts during zebrafish fin regeneration

W Joyce Tang et al. iScience. .

Abstract

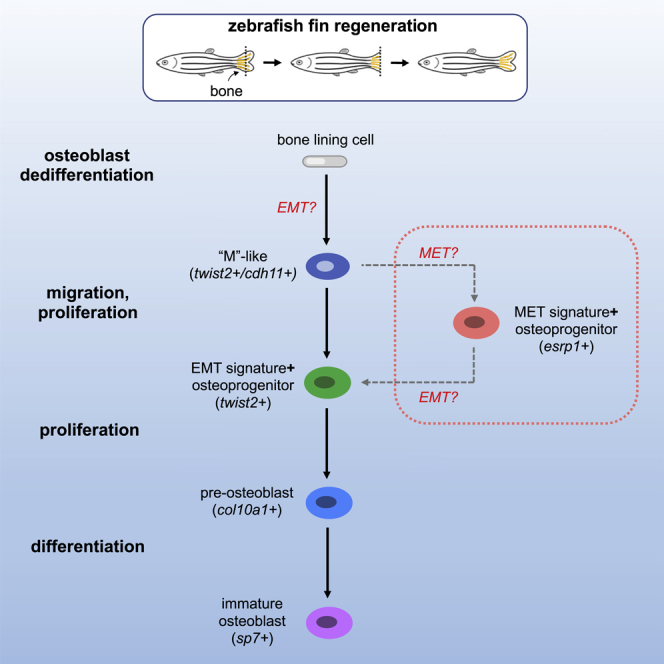
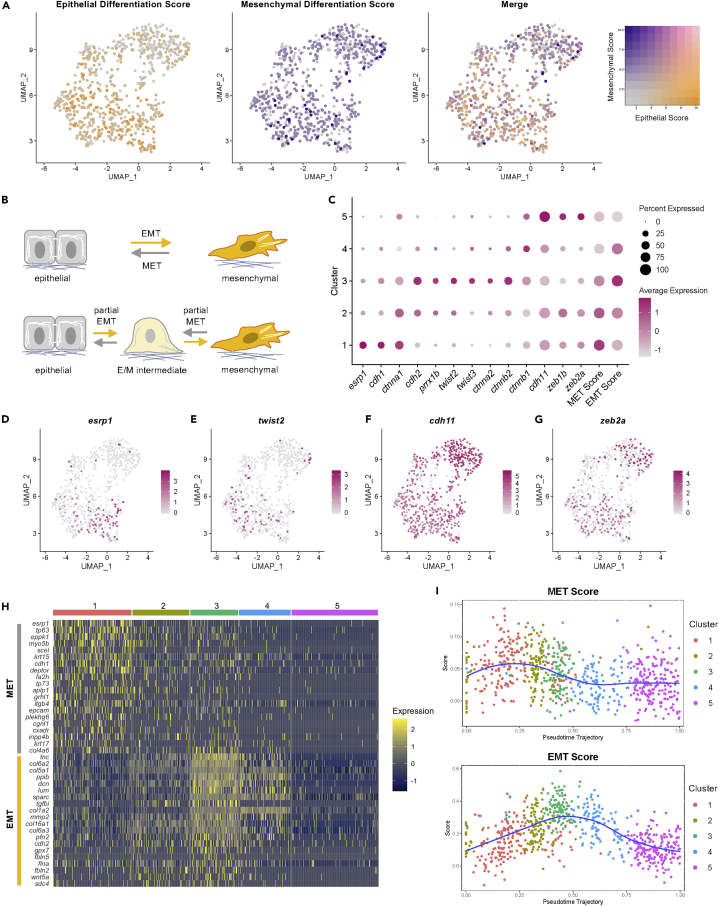
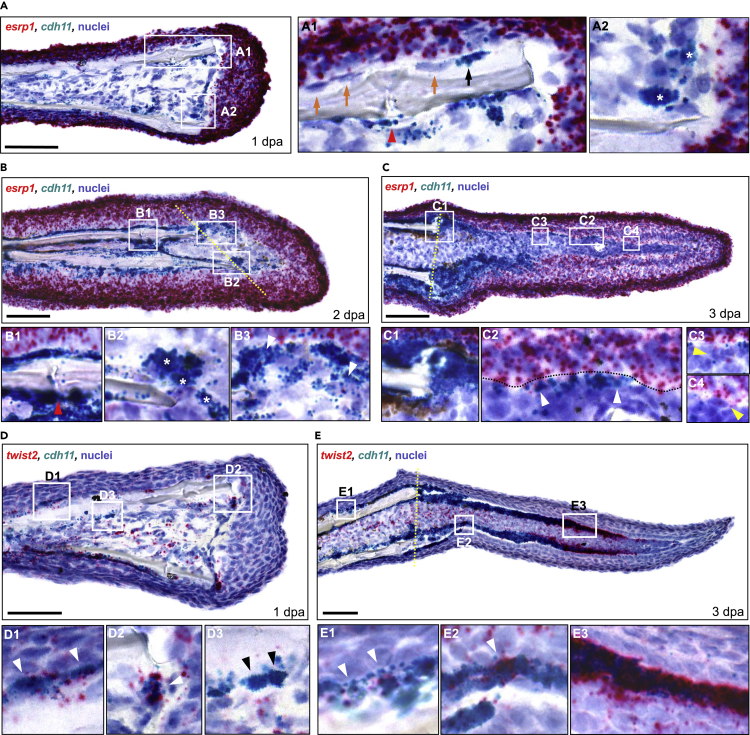
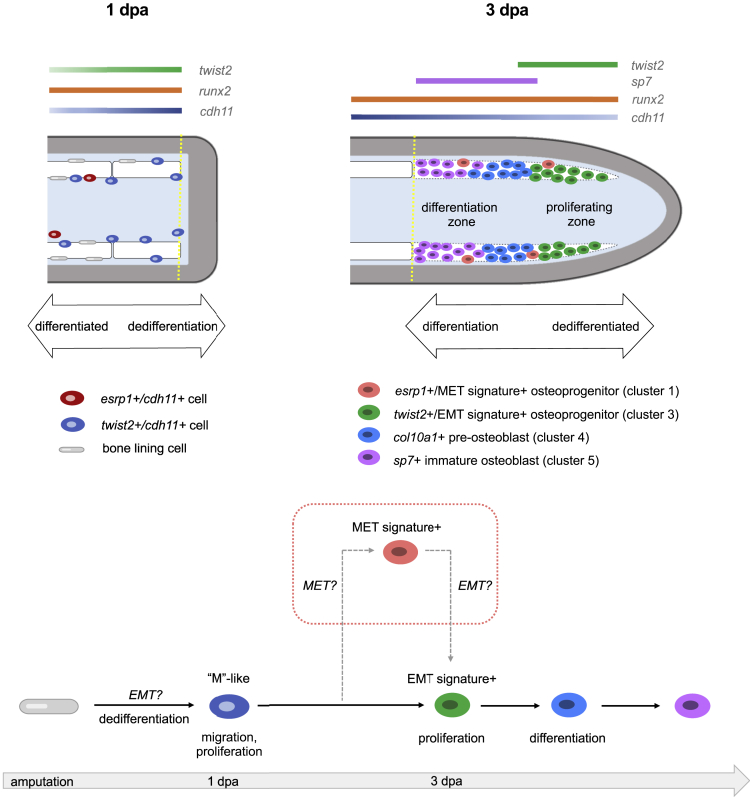
Zebrafish regenerate fin rays following amputation through epimorphic regeneration, a process that has been proposed to involve the epithelial-to-mesenchymal transition (EMT). We performed single-cell RNA sequencing (scRNA-seq) to elucidate osteoblastic transcriptional programs during zebrafish caudal fin regeneration. We show that osteoprogenitors are enriched with components associated with EMT and its reverse, mesenchymal-to-epithelial transition (MET), and provide evidence that the EMT markers cdh11 and twist2 are co-expressed in dedifferentiating cells at the amputation stump at 1 dpa, and in differentiating osteoblastic cells in the regenerate, the latter of which are enriched in EMT signatures. We also show that esrp1, a regulator of alternative splicing in epithelial cells that is associated with MET, is expressed in a subset of osteoprogenitors during outgrowth. This study provides a single cell resource for the study of osteoblastic cells during zebrafish fin regeneration, and supports the contribution of MET- and EMT-associated components to this process.

Keywords: Biological sciences; Developmental biology; Omics; Transcriptomics.


Conflict of interest statement

The authors declare no competing interests.

Figures

None
Graphical abstract
Figure 1
Figure 1
Molecular profiling of fin regeneration reveals distinct cell types including two osteoblast populations (A) Schematic of zebrafish fin regeneration showing tissues and corresponding gene markers. (B) UMAP plot visualizing 19,603 cells from sci-RNA-seq analysis of regenerated fins at 3 and 5 dpa. Of the 12 distinct clusters, 10 tissue types could be identified by molecular markers, including two osteoblast populations. (C) Dotplot visualizing expression of genes demarcating the 12 cell clusters. Circle size represents the percentage of cells expressing the gene, and color indicates average gene expression. See also Figure S1
Figure 2
Figure 2
Osteoblast1 and osteoblast2 are likely enriched with cells fated to become joint cells and osteoblasts, respectively (A) Schematic of osteoprogenitor differentiation into either osteoblasts or joint-forming cells and corresponding gene markers (adapted from McMillan et al., 2018). (B) Dotplot comparing the expression of joint cell markers and bone markers in the two osteoblast populations. The clusters osteoblast1 and osteoblast2 are enriched with genes associated with joint-forming cells and osteoblasts, respectively. (C–E) Feature plots for lmx1ba, slc8a4b, and cdh11. (F-H) Dual RNA in situ hybridization in 3 dpa fin cryosections for the indicated genes. All scale bars are 200 μm. Amputation planes are indicated with a yellow dotted line. (F) lmx1ba+/runx2a+ cells were present in cells near the native joint (F1 inset, black arrowheads), and in presumptive joint cells in the regenerate (F2 inset). (G) slc8a4b+/runx2a+ cells were present at the amputation stump, near the regenerating bone, and in cells along the proximal lateral mesenchymal compartment. (H) cdh11+ cells lined the native bone (H1 inset), the regenerating bone near the amputation stump, and cells along the lateral edges of the mesenchymal compartment of the blastema (H2 inset).
Figure 3
Figure 3
Clustering and trajectory analysis of osteoblast 2 population (A) UMAP plot showing five distinct osteoblastic subclusters. (B) Dotplot visualizing expression of known genes marking the different stages of osteoblast differentiation and osteoblast differentiation scores. (C) Percentage of cells in each cell cycle phase for each osteoblast subcluster. (D) Dotplot showing selected genes found to be differentially expressed within each osteoblastic subcluster. (E–G) Pseudotemporal ordering of osteoblast 2 cells. (E) Slingshot pseudotime ordering yields two trajectories. Trajectory 1 starts in cluster 3, whereas trajectory 2 starts in cluster 1. (F) Closed curve analysis suggests a similar trajectory to trajectory 2 derived from Slingshot analysis. (G) Comparison of the closed curve trajectory to trajectory 2 derived from Slingshot shows that the orderings from open (Slingshot) and closed curve analyses are highly similar
Figure 4
Figure 4
Osteoblastic cells express EMT- and MET-associated genes (A) Osteoblastic cells colored by epithelial differentiation score (left), mesenchymal differentiation score (second from left), and merged epithelial and mesenchymal differentiation scores (third from left). Color legend at right. (B) Partial EMT and MET result in intermediate cellular phenotypes that encompass dual epithelial and mesenchymal phenotypes (bottom). (C) Dotplot of the expression of canonical EMT and MET markers in the osteoblastic subclusters. Clusters were also scored for the expression of EMT and MET gene signatures. (D–G) Feature plots for esrp1, twist2, cdh11, and zeb2a. (H) Top differentially expressed MET and EMT genes in the osteoblasts as visualized by heatmap. (I) Pseudotemporal expression of MET (top) and EMT (bottom) gene signatures in the osteoblast 2 cells using trajectory 2
Figure 5
Figure 5
Osteoprogenitors express esrp1 and cdh11 in a temporal pattern during fin regeneration (A–C) Dual RNA ISH on cryosections from 1, 2, and 3 dpa fin regenerates using RNAScope. (A) Expression of esrp1 and cdh11 in a 1 dpa fin cryosection. (A1 inset) cdh11 only stained some cells lining the bone (black arrow, positive staining; orange arrows, no staining). cdh11 staining was also observed in cells around the fin ray joints (red arrowhead). (A2 inset) Cells staining for cdh11 were observed along the amputation plane, lining the distal border of the mesenchymal compartment (stars). (B) Expression of esrp1 and cdh11 in a 2 dpa fin cryosection. (B1 inset) cdh11+ cells were prominent along the fin bone, including near the fin joint (red arrowhead). (B2 inset) Multiple cdh11+ cells were observed near the amputation stump (stars). (B3 inset) Arrowhead indicates a cell staining positive for both esrp1 and cdh11 in the forming blastema. (C) Expression of esrp1 and cdh11 in a 3 dpa fin cryosection. (C1 inset) Prominent cdh11 expression is observed at the amputation stump. (C2 inset) Multiple cells showed staining for both cdh11 and esrp1 (arrowheads). (C3, C4 insets) Multiple cells in the lateral mesenchymal compartment were positive for esrp1 but not cdh11 (yellow arrowheads). (D–E) Dual RNA ISH for twist2 and cdh11 on cryosections from 1 and 3 dpa fin regenerates. twist2+/cdh11- cells were scattered throughout the mesenchyme at both timepoints. (D) twist2 and cdh11 expression in a 1 dpa fin cryosection. twist2+/cdh11+ cells were detected along the native bone (D1 inset) and the amputation stump (D2 inset) (white arrowheads). (D3 inset) Some cdh11+ cells along the native bone did not express twist2 (black arrowheads). (E) twist2 and cdh11 expression in a 3 dpa fin cryosection. (E1 inset) twist2+/cdh11+ cells were detected along the native bone (white arrowheads). (E2 inset) Expression of twist2 was less prominent in the proximal lateral mesenchymal compartment than cdh11, although small clusters of cdh11+ cells stained strongly for twist2 (white arrowhead). (E3 inset) Robust twist2 expression was observed in distal cdh11+ cells. All scale bars are 60 μm. Amputation plane is indicated with dashed yellow line.
Figure 6
Figure 6
Schematics showing predicted spatial locations of the different osteoprogenitors from osteoblast2 within the fin (top) and predicted model of osteoblastic de- and redifferentiation during fin regeneration (bottom) Amputation plane is indicated with a dashed yellow line. (top left) At 1 dpa, dedifferentiated osteoblasts expressing cdh11 and twist2 are observed along the native bone, at fin ray joints, and at the amputation stump. Elongated bone lining cells are still present but are twist2-/cdh11-. esrp1+/cdh11+ cells are occasionally found near the native bone. (top right) At 3 dpa, osteoprogenitors in the blastema are located along the lateral edges of the mesenchymal compartment as indicated by the dashed white region. Early cycling osteoprogenitors expressing a strong EMT gene signature are distally located. These cells also exhibit robust expression of runx2a and twist2, and comparably less cdh11 than in proximal regions of the regenerate. Proximal osteoprogenitors exhibit strong cdh11 expression and have begun maturing into differentiated osteoblasts, first expressing col10a1, then sp7. Non-cycling osteoprogenitors, some of which express a strong MET gene signature, are sporadically located among both the proximal and distal osteoprogenitors. (bottom) Model of osteoblastic de- and redifferentiation during fin regeneration. Bone lining cells dedifferentiate into twist2+/cdh11+ cells, which are mesenchymal-like (“M”-like). These cells then migrate into the blastema and proliferate. A majority of the cells then follow the solid black arrows and progress through redifferentiation and become mature osteoblasts to regenerate bone. Some of the cells follow the dashed gray arrows, first expressing MET components before expressing EMT components, prior to differentiating into mature osteoblasts.

Similar articles

Cited by

References

    1. Albano G., Dolder S., Siegrist M., Mercier-Zuber A., Auberson M., Stoudmann C., Hofstetter W., Bonny O., Fuster D.G. Increased bone resorption by osteoclast-specific deletion of the sodium/calcium exchanger isoform 1 (NCX1) Pflugers Arch. 2017;469:225–233. doi: 10.1007/s00424-016-1923-5. - DOI - PubMed
    1. Alimperti S., Andreadis S.T. CDH2 and CDH11 act as regulators of stem cell fate decisions. Stem Cell Res. 2015;14:270–282. doi: 10.1016/j.scr.2015.02.002. - DOI - PMC - PubMed
    1. Anbalagan S., Gordon L., Blechman J., Matsuoka R.L., Rajamannar P., Wircer E., Biran J., Reuveny A., Leshkowitz D., Stainier D.Y.R., Levkowitz G. Pituicyte cues regulate the development of permeable neuro-vascular interfaces. Dev.Cell. 2018;47:711–726.e715. doi: 10.1016/j.devcel.2018.10.017. - DOI - PubMed
    1. Ando K., Shibata E., Hans S., Brand M., Kawakami A. Osteoblast production by reserved progenitor cells in zebrafish bone regeneration and maintenance. Dev.Cell. 2017;43:643–650.e643. doi: 10.1016/j.devcel.2017.10.015. - DOI - PubMed
    1. Ansieau S., Bastid J., Doreau A., Morel A.P., Bouchet B.P., Thomas C., Fauvet F., Puisieux I., Doglioni C., Piccinin S., et al. Induction of EMT by twist proteins as a collateral effect of tumor-promoting inactivation of premature senescence. Cancer Cell. 2008;14:79–89. doi: 10.1016/j.ccr.2008.06.005. - DOI - PubMed