Endogenous retroviruses co-opted as divergently transcribed regulatory elements shape the regulatory landscape of embryonic stem cells
- PMID: 35166831
- PMCID: PMC8887488
- DOI: 10.1093/nar/gkac088
Endogenous retroviruses co-opted as divergently transcribed regulatory elements shape the regulatory landscape of embryonic stem cells
Abstract
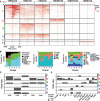
Transposable elements are an abundant source of transcription factor binding sites, and favorable genomic integration may lead to their recruitment by the host genome for gene regulatory functions. However, it is unclear how frequent co-option of transposable elements as regulatory elements is, to which regulatory programs they contribute and how they compare to regulatory elements devoid of transposable elements. Here, we report a transcription initiation-centric, in-depth characterization of the transposon-derived regulatory landscape of mouse embryonic stem cells. We demonstrate that a substantial number of transposable element insertions, in particular endogenous retroviral elements, are associated with open chromatin regions that are divergently transcribed into unstable RNAs in a cell-type specific manner, and that these elements contribute to a sizable proportion of active enhancers and gene promoters. We further show that transposon subfamilies contribute differently and distinctly to the pluripotency regulatory program through their repertoires of transcription factor binding site sequences, shedding light on the formation of regulatory programs and the origins of regulatory elements.
© The Author(s) 2022. Published by Oxford University Press on behalf of Nucleic Acids Research.
Figures


Similar articles
-
The majority of primate-specific regulatory sequences are derived from transposable elements.PLoS Genet. 2013 May;9(5):e1003504. doi: 10.1371/journal.pgen.1003504. Epub 2013 May 9. PLoS Genet. 2013. PMID: 23675311 Free PMC article.
-
Dynamic transcription of distinct classes of endogenous retroviral elements marks specific populations of early human embryonic cells.Cell Stem Cell. 2015 Feb 5;16(2):135-41. doi: 10.1016/j.stem.2015.01.005. Cell Stem Cell. 2015. PMID: 25658370
-
H4K16ac activates the transcription of transposable elements and contributes to their cis-regulatory function.Nat Struct Mol Biol. 2023 Jul;30(7):935-947. doi: 10.1038/s41594-023-01016-5. Epub 2023 Jun 12. Nat Struct Mol Biol. 2023. PMID: 37308596 Free PMC article.
-
Retroviral transcriptional regulation and embryonic stem cells: war and peace.Mol Cell Biol. 2015 Mar;35(5):770-7. doi: 10.1128/MCB.01293-14. Epub 2014 Dec 29. Mol Cell Biol. 2015. PMID: 25547290 Free PMC article. Review.
-
Host Gene Regulation by Transposable Elements: The New, the Old and the Ugly.Viruses. 2020 Sep 26;12(10):1089. doi: 10.3390/v12101089. Viruses. 2020. PMID: 32993145 Free PMC article. Review.
Cited by
-
Globally elevated levels of histone H3 lysine 9 trimethylation in early infancy are associated with poor growth trajectory in Bangladeshi children.Clin Epigenetics. 2023 Aug 11;15(1):129. doi: 10.1186/s13148-023-01548-z. Clin Epigenetics. 2023. PMID: 37568218 Free PMC article.
-
Nuclear RNA catabolism controls endogenous retroviruses, gene expression asymmetry, and dedifferentiation.Mol Cell. 2023 Dec 7;83(23):4255-4271.e9. doi: 10.1016/j.molcel.2023.10.036. Epub 2023 Nov 22. Mol Cell. 2023. PMID: 37995687 Free PMC article.
-
Symmetric inheritance of parental histones governs epigenome maintenance and embryonic stem cell identity.Nat Genet. 2023 Sep;55(9):1567-1578. doi: 10.1038/s41588-023-01476-x. Epub 2023 Sep 4. Nat Genet. 2023. PMID: 37666988 Free PMC article.
-
ChimeraTE: a pipeline to detect chimeric transcripts derived from genes and transposable elements.Nucleic Acids Res. 2023 Oct 13;51(18):9764-9784. doi: 10.1093/nar/gkad671. Nucleic Acids Res. 2023. PMID: 37615575 Free PMC article.
-
Transposable Elements in Pluripotent Stem Cells and Human Disease.Front Genet. 2022 Jun 2;13:902541. doi: 10.3389/fgene.2022.902541. eCollection 2022. Front Genet. 2022. PMID: 35719395 Free PMC article. Review.
References
-
- Beagrie R.A., Pombo A.. Gene activation by metazoan enhancers: diverse mechanisms stimulate distinct steps of transcription. Bioessays. 2016; 38:881–893. - PubMed
-
- Shlyueva D., Stampfel G., Stark A.. Transcriptional enhancers: from properties to genome-wide predictions. Nat. Rev. Genet. 2014; 15:272–286. - PubMed
-
- Andersson R., Sandelin A.. Determinants of enhancer and promoter activities of regulatory elements. Nat. Rev. Genet. 2020; 21:71–87. - PubMed
Publication types
MeSH terms
Substances
LinkOut - more resources
Full Text Sources

