. 2022 Feb;602(7898):647-653.
doi: 10.1038/s41586-022-04396-8. Epub 2022 Feb 14.

A gut-derived metabolite alters brain activity and anxiety behaviour in mice

Affiliations

A gut-derived metabolite alters brain activity and anxiety behaviour in mice

Brittany D Needham et al. Nature. 2022 Feb.

Abstract

Integration of sensory and molecular inputs from the environment shapes animal behaviour. A major site of exposure to environmental molecules is the gastrointestinal tract, in which dietary components are chemically transformed by the microbiota1 and gut-derived metabolites are disseminated to all organs, including the brain2. In mice, the gut microbiota impacts behaviour3, modulates neurotransmitter production in the gut and brain4,5, and influences brain development and myelination patterns6,7. The mechanisms that mediate the gut-brain interactions remain poorly defined, although they broadly involve humoral or neuronal connections. We previously reported that the levels of the microbial metabolite 4-ethylphenyl sulfate (4EPS) were increased in a mouse model of atypical neurodevelopment8. Here we identified biosynthetic genes from the gut microbiome that mediate the conversion of dietary tyrosine to 4-ethylphenol (4EP), and bioengineered gut bacteria to selectively produce 4EPS in mice. 4EPS entered the brain and was associated with changes in region-specific activity and functional connectivity. Gene expression signatures revealed altered oligodendrocyte function in the brain, and 4EPS impaired oligodendrocyte maturation in mice and decreased oligodendrocyte-neuron interactions in ex vivo brain cultures. Mice colonized with 4EP-producing bacteria exhibited reduced myelination of neuronal axons. Altered myelination dynamics in the brain have been associated with behavioural outcomes7,9-14. Accordingly, we observed that mice exposed to 4EPS displayed anxiety-like behaviours, and pharmacological treatments that promote oligodendrocyte differentiation prevented the behavioural effects of 4EPS. These findings reveal that a gut-derived molecule influences complex behaviours in mice through effects on oligodendrocyte function and myelin patterning in the brain.


Conflict of interest statement

Competing interests: S.K.M. has financial interests in Axial Biotherapeutics. All other authors declare no competing interests related to this work.

Figures

Extended Data Fig. 1
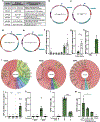
Extended Data Fig. 1. Strain engineering and 4EPS quantification.
a, Strain legend corresponding to Figure 1b-d, containing further details for strain names and cloning strategy. Additional information can be found in Methods and Supplementary Information Tables 1-3. b-e, Maps for integration vectors. b, The BO1194 gene was cloned into the pNBU2 vector with an erythromycin resistant marker under the phage promoter. c, The PAD gene was cloned into pNBU2 vector with an erythromycin resistant marker under the phage promoter. d, The PAD gene was cloned into the pNBU2 vector with a tetracycline resistant marker under the phage promoter. e, BO1194 and PAD were tandemly connected, putting the phage promoter in front of both genes, then icloned into the pNBU2 vector with the erythromycin resistant marker. f, Creatinine corrected urinary levels of 4EPS from SPF, GF, gnotobiotic mice colonized with strains as labeled, and a mouse model of atypical behavior including anxiety-like phenotypes. This data corresponds to abbreviated data in Fig. 1f. SPF, specific pathogen free mice; GF, germ-free mice; BO, Bacteroides ovatus mono-colonized mice; 4EP-, GF mice colonized with non-producing strain pair (B. ovatus Δ1194 and WT L. plantarum with endogenous VPR) used throughout; WT, GF mice colonized with wild type strain pair (WT B. ovatus and WT L. plantarum with endogenous VPR) before optimal engineering; 4EP+, colonized with strain pair engineered for higher production of 4EP+ (B. ovatus+1194/PAD and WT L. plantarum with endogenous VPR), used throughout; CNTNAP2, conventionally colonized mouse model of atypical behavior (left to right columns: n=15, 5, 5, 9, 7, 9, 11). g, 4EPS levels (creatinine corrected) in urine of wild type, specific pathogen free (SPF) mice fed one of two isocaloric diets matched for protein, mineral, carbohydrate, and fat levels but differing in either high tyrosine fish meal (fish diet), or a high plant protein (soy diet) (n=8 each group)p=0.002. h, 4EPS levels (creatinine corrected) in urine of gnotobiotic mice colonized with isogenic strain pairs of B. ovatus and wild type L. plantarum, which differ only in the presence or absence of gene 1194, and thus the tyrosine lyase activity requires to convert tyrosine to p-coumaric acid (n=2 each group). i, Alignments of genes used to engineer the 4EP synthesis pathway to the reference genomes in the WoL database, showing that these genes are found in ~25 genomes each, most of which are common human gut lineages. j, 4EP and 4EPS levels (ug/ml) in serum of colonized mice (n=7 each group). k, 4EP+ and 4EP- colonized mice were injected with the organic anion transporter to inhibit potential 4EPS transport out of the brain, then analyzed by LCMS (n=6 each group). Extended data from Figure 1G. l, Conventionally colonized (SPF) mice were injected with probenecid and then injected with high dose 4EPS (n=8) or saline vehicle (n=8), and whole brain lysate was analyzed by LCMS compared to 4EPS injection alone (n=4)p<0.0001. m, Conventionally colonized (SPF) mice were injected with probenecid and then gavaged with 4EP, then whole brains were harvested at 30-minute intervals and 4EPS levels were quantified by LCMS (n=4; vehicle group n=3)p=0.01. Two independent trials on biological replicates were used for the experiments in the figure. Abbreviations: SPF, specific pathogen-free; GF, germ-free; BO, Bacteroides ovatus; WT, wild type; LP, Lactobacillus plantarum. Data represent mean ± SEM analyzed by a two-tailed Welch’s t-test or one-way ANOVA with Dunnett multiple comparisons test as appropriate. * p ≤ 0.05; ** p ≤ 0.01; *** p ≤ 0.001; **** p ≤0.0001.
Extended Data Fig. 2
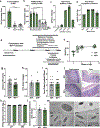
Extended Data Fig. 2. 4EP sulfation, experimental timeline, normal weight gain, colonization and intestinal barrier of 4EP+ mice.
a, In vitro recombinant SULT1A1 sulfotransferase assay with 4EP as potential sulfate acceptor (n=5)p<0.0001. b, Results of the sulfotransferase assay using various recombinant SULTs (n=3)p<0.0001. c, 4EP sulfation capacity of cytosolic fractions of brain, colon, liver, and small intestinal tissue, each containing endogenous sulfotransferases (n=2 datapoints of samples pooled from triplicate biological replicates, with only 1 pool for SI). Ion intensity of 4EPS measured by LCMS is plotted along the y-axis. d, Confirmation of expression of the Sult1a1 gene measured by qPCR in tissue from the brain, colon, liver, and small intestine of colonized mice (n=8; brain n=6)p<0.0001. e, Schematic of mouse experimental timeline, showing ages of mice at colonization of GF mice with 4EP+/− strains, behavior testing and tissue collection. f, Weights of mice (grams) after colonization of GF mice with 4EP- or 4EP+ bacteria (n=13). g, Ambulatory activity of 4EP- and 4EP+ mice over ten minutes, measured by distance moved when mice were placed in an open arena and allowed to explore (4EP- n=21; 4EP+ n=24). h, FITC-dextran levels in serum as a measure of intestinal permeability (4EP- n=5, 4EP+ n=6). i, Fecal output of colonized mice over 10 minutes (n=13). j, Images of hematoxylin and eosin (H&E) stained small intestine and colon of 4EP+/− mice (representative images of n=4). Scale bar 50μm. k, Colonization of ex-GF mice with engineered Bacteroides ovatus (BO) and Lactobacillus plantarum (LP), plotted as colony forming units (CFU) per gram of intestinal contents (n=4). l, Quantification of bacterial distance from the intestinal epithelium imaged by electron tomography, where each data point represents a separate animal comprised of an average of 5–10 bacterial cells per image per mouse (4EP- n=4; 4EP+ n=5). m, Example images of bacterial cells near the intestinal epithelial layer of 4EP+/− mice. Two independent trials using multiple randomized litters were used for the experiments in the figure. Abbreviations: SULT, sulfotransferase; SI, small intestine. Data represent mean ± SEM. Panel f was analyzed by a 2-way ANOVA with a Bonferroni multiple comparison correction. Panels g-i and l were analyzed using two-tailed Welch’s t-tests and panels a-d, k by a one-way ANOVA with Dunnett multiple comparisons test.
Extended Data Fig. 3
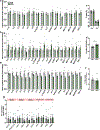
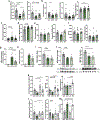
Extended Data Fig. 3. Lack of inflammatory signals in peripheral and brain cytokine and immune profiles of 4EP+/− mice.
a-b, Cytokine and chemokine levels presented in bar graph where grey (−) is 4EP- and green (+) is 4EP+, measured by bioplex in colon (n=9) a, and serum (n=9) b. No significant differences were observed. c-d, Flow cytometry of spleens of 4EP+ and 4EP- mice. For gating strategy see Supplementary Information Figure 2. c, Percentages of CD4+ or CD8+ T cells (4EP- n=11, 4EP+ n=10). d, Percentage of B cells (4EP- n=11, 4EP+ n=10)p<0.0001. e, Cytokine and chemokine levels presented in bar graph where grey (−) is 4EP- and green (+) is 4EP+, measured by bioplex (n=9) in brain tissue (Il-3 p=0.046; Il-5 p=0.01; KC p=0.02; TNF-a p=0.01). f, Flow cytometry percentages of microglia in the brain of 4EP- and 4EP+ mice. For gating strategy see Supplementary Information Figure 2. g, Relative expression of microglial genes in microglial-enriched samples (n=8). Multiple randomized litters were used for the experiments in the figure. Each data point represents biologically independent mice from multiple randomized litters examined over one (a-b) or two (c-h) respective experiments. Data represent mean ± SEM. Panels a, b, d, f, and h were analyzed by one-way ANOVA with Dunnett multiple comparisons test comparing each 4EP+/4EP- pair, and panels g and e by a two-tailed Welch’s t-test. * p ≤ 0.05; ** p ≤ 0.01; *** p ≤ 0.001.
Extended Data Fig. 4
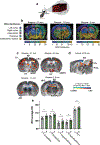
Extended Data Fig. 4. Extended information on functional connectivity experiments fUSi and autoradiography.
a, Schematic representation of the functional ultrasound (fUSi) set-up. Functional acquisitions are acquired non-invasively through intact skull and scalp in anesthetized mice during 15 minutes per coronal plane. Created with BioRender.com. b, Maps overlaid with regions of interest colored in a gradient for easier visualization. Significant pairs are indicated, corresponding to the data in main Fig. 2b. Three coronal planes per mouse were studied: Bregma −0.9 mm, Bregma −1.6 mm, Bregma −2mm. 50, 52 and 52 ROIS are respectively delineated for each plane according the Paxinos Atlas. Coronal plane B-0.9mm: ROIs #1 to #8 are located in the left cortex, ROI#9 is the left hippocampus, ROIs#11 to #21 are located in the thalamus, ROI#22 is the right hippocampus, ROIs#23 to #30 are located in the right cortex and finally ROIs#31 to #48 are subthalamic regions. Coronal plane B-1.6mm: ROIs #1 to #20 are located in the cortex, ROIs#21 #22 are the left and right hippocampi, ROIs#23 to #38 are located in the thalamus and ROIs#39 to #42 are subthalamic regions. Coronal plane B-2mm: ROIs #1 to #9 are located in the left cortex, ROI#10 is the left hippocampus, ROIs#11 to #22 are located in the thalamus, ROI#23 is the right hippocampus, ROIs#24 to #32 are located in the right cortex and finally ROIs#33 to #50 are subthalamic regions. c-d, Color-coded overlays over representative coronal (c) and sagittal (d) sections of the mouse brain template showing significant differences in regional cerebral glucose uptake following open field exposure in 4EP+ mice compared to 4EP- mice (n=11) (t-test, p ≤ 0.05, extent threshold > 200 contiguous voxels, with both conditions met to be deemed significant; red/blue: increase/decrease in glucose uptake in 4EP+ compared to 4EP- mice). e, Quantitated 2DG-uptake by region of interest, including the amygdala, hypothalamus and PVT, confirming changes in relative 2DG uptake in the open field groups (n=11 each group) From left to right, p=0.01; 0.03; 0.02; 0.009; 0.003). Average optical density of each ROI in each animal was normalized to whole-brain average of that animal. Abbreviations: AM, amygdala; HY, hypothalamus; PVT, paraventricular nucleus of the thalamus; BNST, bed nucleus of the stria terminalis; S1, primary somatosensory cortex; CPu, caudate putamen; Hb, habenular nucleus; RT, reticular nucleus of the thalamus; VPL/VPM, Posterior Lateral/Ventral Posterior Medial Thalamus; R, right; L, left. Two cohorts of mice from multiple litters were used for each experiment in this figure. Panel e was analyzed by one-way ANOVA with multiple comparison correction and two-stage linear step-up procedure of Benjamini, Krieger and Yekutieli. * p ≤ 0.05.
Extended Data Fig. 5
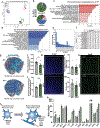
Extended Data Fig. 5. Extended results of mRNA high throughput sequencing (QuantSeq), and oligodendrocyte analysis by immunofluorescence implicating oligodendrocyte differences in 4EP+ mice.
a, Principal component analysis of all samples analyzed by QuantSeq, with tight clustering by brain region. Each brain region is colored according to the legend. b, Differential gene analysis summary showing number of significantly different genes in 6 tested brain regions. Top pie chart refers to total number of differential genes by one-way group ANOVA with all the 4EP- and 4EP+, at baseline and post-EPM. The bottom pie chart was generated according to the specific significant (p<0.05) contrasts between 4EP+ and 4EP- conditions of post-EPM conditions as calculated with the post-hoc Tukey HSD test. c-d, Gene ontology terms enriched in genes that are upregulated (c) or downregulated (d) in the PVT in 4EP+ relative to 4EP- mice in the baseline, home cage condition. X-axis represents -log10(P) of enrichment analysis. e, p-value histogram of PVT sequencing at baseline, graphed as p-values binned by 0.05 along the x-axis and number of genes along the y-axis. f, Adjusted p-values for 4EP+/4EP- comparison of expression of oligodendrocyte specific genes in all 6 brain regions analyzed by QuantSeq, corresponding to data presented in Main Figure 3c for the PVT. p<0.05 in bold. g, PVT seed analysis correlating 2DG uptake in the PVT to the rest of the brain. Images show 3D rendered, average whole brain correlation data (n=11). The center of the PVT is indicated at the cross section of the red lines, and the number of negatively correlated voxels is shown below in each. Significance is illustrated according to the legend. A minimum threshold of 200 contiguous voxels with p<0.05 was used. h, Schematic of immature OPC and mature, myelinating oligodendrocyte markers used for immunostaining, flow cytometry, or western blots in this study. i, Raw counts of mature oligodendrocytes, measured by CC1+ and OLIG2+ staining in 4EP+ and 4EP- mice in the PVT, used to calculate maturity quotient in Figure 3f (n=8). p=0.04. j, Raw counts of immature oligodendrocytes, measured by NG2+ and OLIG2+ staining in 4EP+ and 4EP- mice in the PVT, used to calculate maturity quotient in Figure 3f (n=8 each group). p=0.055. k, Representative images (corresponding to main Fig. 3e-f) of the PVT in brain sections from 4EP- and 4EP+ mice, stained for OLIG2, using total cumulative counts from 3–5 images per replicate (n=8). Scale bar 100µm. l, Raw counts of OLIG2+ cells in the PVT of 4EP+/− mice. Each data point represents an individual mouse, with total cumulative counts from the PVT (n=8) p=0.8. m, Raw counts of NeuN+ staining in the PVT (4EP- n=10, 4EP+ n=9), using average counts from 3–5 images per replicate. n, Representative images of pan-neuronal NeuN staining in the PVT, with 3–5 images per replicate (4EP- n=10, 4EP+ n=9). Scale bar 100µm. o, NG2+ staining in extended regions of the brain (n=3 each group) p=0.009. Abbreviations: PVT, the paraventricular nucleus of the thalamus; BNST, bed nucleus of the stria terminalis; BLA, basolateral amygdala; mPFC, medial prefrontal cortex; HY, hypothalamus; vHPC, ventral hippocampus; OLIG2, oligodendrocyte transcription factor 2; NG2, neural/glial antigen 2; CC1, antibody (anti-adenomatous polyposis coli (APC) clone) that binds mature oligodendrocyte marker; MOG, myelin oligodendrocyte glycoprotein; MBP, myelin basic protein; ACA, anterior commissure; CC, corpus callosum; LHB, lateral habenula; LS, lateral septum; MHB, medial habenula; MS, medial septum; ME, median eminence; PFC, prefrontal cortex; PVN, paraventricular nucleus of the hypothalamus; SM, stria medullaris of thalamus. Two cohorts of mice from multiple litters were used for experiments in panels g-o in this figure. Data represent mean ± SEM. Analysis performed using two-tailed Welch’s t-tests (i-m) or one-way ANOVA with Dunnett multiple comparison between 4EP+/− pairs (o). * p ≤ 0.05.
Extended Data Fig. 6
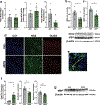
Extended Data Fig. 6. Extended results of oligodendrocyte analysis implicating oligodendrocyte differences in 4EP+ mice in vivo and in vitro.
a, Extended quantitation of flow cytometry with MOG+/NG2+ ratio by quadrant in the cerebellum, cortex, and hypothalamus (n=4). b-c, Western blot analysis of MOG (p=0.03) and MBP (p=0.002) markers (respectively) of mature oligodendrocytes from the PVT brain region. PVT punches from two mice were pooled per data point in quantitative data (n=6 pooled samples each group). For gel source data, see Supplementary Information Figure 1. d-g, Organotypic brain slices were cultured in the presence of 10uM 4EPS. d, Representative images of CC1, NG2 and Olig2 staining. Two cohorts of mice were used, with each data point in Fig 3i representing quantified images from samples from individual mice. Scale bar 20µm. e, Example high-magnification image of axon in organotypic brain slices, stained with antibodies specific to NF (red), and PLP (green), with DAPI (blue), taken from image set used for quantification in 3i and Extended Data Fig 6d. Scale bar 8µm. f, qPCR results of oligodendrocyte genes, Cspg4 (p=0.04), Mog (p=0.03), and Mpb from organotypic brain slices (n=7). g, Western blot image of mature oligodendrocyte marker MBP (quantified in main Fig. 3l). For gel source data, see Supplementary Figure 1. Abbreviations: NG2, neural/glial antigen 2; CC1, antibody (anti-adenomatous polyposis coli (APC) clone) that binds mature oligodendrocyte marker; MOG, myelin oligodendrocyte glycoprotein; MBP, myelin basic protein. Two cohorts of mice from multiple litters were used for experiments in this figure. Data represent mean ± SEM. Statistics were performed using two-tailed Welch’s t-tests. * p ≤ 0.05; ** p ≤ 0.01.
Extended Data Fig. 7
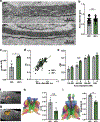
Extended Data Fig. 7. Extended results of myelin analysis by electron microscopy and DTI.
a, Additional ET of myelinated axons in 4EP- (top) and 4EP+ (bottom) mice visualized longitudinally along an axon (n=3; 4 images each). These longitudinal images were used only for qualitative visual assessment of myelin to accompany the other quantitative measures. b, Axon diameters (measured from cell membrane, not including myelin layer) from all axons used to calculate g-ratio (4EP-, 56; 4EP+, 70 axons) (n=4; 4 images each). p=0.1. c, g-ratio (r/R), the inner axon diameter/outer diameter of the myelin sheath, of 4EP+ and 4EP- mice. Each data point represents a mouse (n=4), which is an average of the g-ratio of all axons quantified from 4 images per mouse, where a larger g-ratio indicates a thinner layer of myelin. p=0.046. d, Plot of g-ratio (r/R) on the y-axis and axon diameter on the x-axis, with linear regression noted by lines (4EP-, 56; 4EP+, 70 axons) (n=4; 4 images each). e, Average g-ratio of each animal, binned by axon size, indicating that mid-sized range of axons are driving the change in overall g-ratio phenotype observed in the mice (n=4). f-g, Defined regions of interest for the PVT and corpus callosum (CC) overlaid on representative sagittal MRI image. h-i, representative tracts observed from a bilateral coronal plane view (left) and fractional anisotropy (FA) analysis (right) for the corpus callosum (CC), and whole brain (p=0.009), respectively (n=4). Two independent trials using multiple litters were used for experiments in this figure. Data represent mean ± SEM. Statistics were performed using two-tailed Welch’s t-tests (b,c,h,i), simple linear regression test (d), or one-way ANOVA with Dunnett multiple comparison between 4EP+/− groups at each size group. * p ≤ 0.05; ** p ≤ 0.01.
Extended Data Fig. 8
Extended Data Fig. 8. Additional behavior tests in 4EP- and 4EP+ mice.
a, Distance traveled (p=0.06), time in center (p=0.01), and thigmotaxis time (p=0.007), during open field test over a period of 10 minutes (distance traveled data was also shown in Extended Data Fig. 2g) (4EP- n=21, 4EP+ n=24). b, Time spent in the open arms of the elevated plus maze (EPM) (left)(p=0.02) and ratio of time spent in the open/time spent in the closed arms of the EPM (right) (4EP- n=21, 4EP+ n=24). c, Light/dark box: time mice spent in the open, lit portion of the arena. Test time, 10 minutes (4EP- n=25, 4EP+ n=23) p=0.02. d, Grooming: total time mice spent self-grooming over a period of 10 minutes (4EP- n=27, 4EP+ n=24). e, Social interaction: with an unfamiliar, age-matched male intruder. Total time socializing (left) and percent of total socializing that is anogenital sniffing (right) (4EP- n=25, 4EP+ n=22) p=0.0009. f, Ultrasonic vocalization: time spent vocalizing to an unfamiliar, age-matched female for 3 minutes (4EP- n=23, 4EP+ n=21) p=0.01. g, Novel object recognition (NOR): time spent investigating a novel object when presented with a novel and a familiar object (n=22). h, Y-maze alternations: percent of times mice repeated entry into an arm it had just visited rather than alternate to all arms in succession (4EP- n=15, 4EP+ n=16). i, Beam traversal: time required for the mouse to cross the narrowing beam (4EP- n=19, 4EP+ n=22). j, Pole descent: time required for the mouse to descend from the pole to the home cage (4EP- n=19, 4EP+ n=22). k, Wire hang: time the mouse hung on and explored the underside of the wire grid before releasing into cage below (4EP- n=19, 4EP+ n=22). l, Fecal 16s profiles of 4EP+/− mice after behavior tests, where tan is the colonization group and contamination from exposure to behavior tests is colored according to the legend (left panel) and a magnified view of contaminants only (right panel) (4EP- n=8, 4EP+ n=10). Two independent cohorts of mice from multiple litters were used for each experiment in this figure. Data a-k represent mean ± SEM analyzed by two-tailed Welch’s t-test. * p ≤ 0.05; ** p ≤ 0.01.
Extended Data Fig. 9
Extended Data Fig. 9. Behavior results from 4EP or 4EPS administration by drinking water and anxiety behavior tests of 4EP+/− mice relative to GF and SPF mice.
a-f, Behavior tests of conventionally colonized mice administered 4EP or 4EPS by drinking water. a, Left panel: EPM, time spent in open arms over time spent in closed arms (seconds). Right panel: time spent at terminus (outer 1/3 of open arms)(Veh. n=15; 4EPS n=17; 4EP n=16) (Open/closed: Veh. vs 4EPS p<0.0001; Veh vs 4EP p=0.007; 4EPS vs 4EP p=0.03; Terminus: Veh vs 4EPS p=0.004). b, Open field test, from left to right: time spent in center area over thigmotaxis, time spent in center (seconds), distance moved in open field test, showing an increase in activity in 4EP-treated animals (Veh. n=16; 4EPS n=16; 4EP n=18) p=02. c, Grooming test, total percent of time spent grooming, showing an increase in grooming in the 4EPS-treated animals (Veh. n=16; 4EPS n=18; 4EP n=17). d, Number of marbles buried (Veh. n=16; 4EPS n=17; 4EP n=18). e, Social interaction. Left panel: total socialization time (seconds). Right panel: % of total socialization time spent as anogenital sniffing (Veh. n=8; 4EPS n=7; 4EP n=7). f, USV test. Left panel: Vocalization events. Right panel: Total duration spent vocalizing (seconds) (Veh. n=16; 4EPS n=15; 4EP n=18). g, 4EPS levels in urine of mice administered 4EP or 4EPS in the drinking water (creatinine corrected)(Veh. n=12; 4EPS n=9; 4EP n=11)(Veh. vs 4EPS p=0.0005; Veh vs 4EP p=0.008; 4EPS vs 4EP p=0.03). h, 4EPS levels in serum of mice administered 4EP or 4EPS in the drinking water (Veh. n=4; 4EPS n=4; 4EP n=3). i, Quantified flow cytometry data of PVT of mice administered 4EP or 4EPS in the drinking water, with ratio of MOG+ quartile percentages/NG2+ quartile percentages presented (Veh. n=5; 4EPS n=5; 4EP n=4) p=0.03. For gating strategy see Supplementary Information Figure 2 and main Fig. 3h. j, Quantified western blot data for MOG and MBP in the PVT of mice administered 4EP or 4EPS in the drinking water, with blots shown below (n=4 each group). (MBP: H2O vs 4EPS p=0.04; vs 4EP p=0.02). For gel source data, see Supplementary Figure 1. k-m, Anxiety behavior tests contextualizing 4EP+/− mice to GF and SPF mice. k, Open field test, from left to right: time spent in center area over time spent along walls (4EP- vs 4EP+ p=0.04; 4EP+ vs GF p=0.02; 4EP+ vs SPF p=0.04), time spent in center (seconds), distance moved in open field test(4EP+ vs SPF p=0.047; GF vs SPF p-0.01) (4EP- n=8; 4EP+ n=9; GF n=9; SPF n=11). l, Elevated plus maze, time spent in the open arms/time spent in the closed arms ration (left)(4EP- vs 4EP+ p=0.03; 4EP+ vs SPF p=0.03) and time spent at the terminus (right) (4EP- n=9; 4EP+ n=9; GF n=11; SPF n=13). m, Marble burying (4EP- n=9; 4EP+ n=9; GF n=9; SPF n=112)(4EP- vs 4EP+ p=0.02; 4EP- vs SPF p=0.03; 4EP+ vs GF p=0.02; GF vs SPF p=0.03). Abbreviations: Veh., vehicle control; MOG, myelin oligodendrocyte glycoprotein; MBP, myelin basic protein. Two independent cohorts of mice from multiple litters were used for the experiments in this figure. Data represent mean ± SEM analyzed by one-way ANOVA with Dunnett multiple comparison between all groups. * p ≤ 0.05; ** p ≤ 0.01; *** p ≤ 0.001; **** p ≤0.0001.
Extended Data Fig. 10
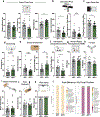
Extended Data Fig. 10. Fluorescence imaging and extended behavior test results of clemastine fumarate and miconazole-treated mice, and preliminary behavior tests performed on both sexes, used to determine continued studies on males for the study.
a-i, 4EP+/− mice were administered vehicle (control), clemastine fumarate (clem.), or miconazole and then behavior tested and imaged.. a, Representative images of CC1 (green), NG2 (red), and OLIG2 (blue) staining in 4EP+/− mice with or without treatment. Representative of group of individual mice used for quantification: 4EP- control=7, treated=10; 4EP+ control=6, treated=6, which came from two cohorts (Scale bar 100µm). b, Quantification of fluorescent imaging, presented as a ratio of CC1+/NG2+ cells (from left to right n=7, 10, 6, 6, 4, 4). The first four columns are also shown in Main Fig. 4i (Cont 4EP-vs 4EP+ p=0.04; 4EP+Cont vs 4EP+Clem p=0.01). c-d, Confirmation that treatment does not reduce 4EPS levels with clemastine (c) (Control. 4EP- n=4; Control. 4EP+ n=6, Clem 4EP- n=3; Clem 4EP+ n=4) or miconazole (d) (Control. 4EP- n=4; Control. 4EP+ n=4, Mic 4EP- n=4; Mic 4EP+ n=5) treatment. e, Extended EPM results (Control 4EP- n=13; Control 4EP+ n=13; Clem 4EP- n=12; Clem 4EP+ n=14). f, Extended open field results (Control 4EP- n=15; Control 4EP+ n=17; Clem 4EP- n=17; Clem 4EP+ n=17). g-i, Behavioral results for mice treated with miconazole, including g, Open field (Control 4EP- n=24; Control 4EP+ n=25; Mic. 4EP- n=18; Mic. 4EP+ n=20)(left graph: 4EP-Cont vs 4EP+ Cont p=0.02; 4EP+cont vs 4EP+Mic p=0.008)(middle graph: 4EP-Cont vs 4EP+ Cont p=0.02; 4EP+cont vs 4EP+Mic p=0.005). h, EPM (Control 4EP- n=24; Control 4EP+ n=25; Mic. 4EP- n=15; Mic. 4EP+ n=17)(left graph: 4EP-Cont vs 4EP+ Cont p=0.002; 4EP+cont vs 4EP+Mic p=0.03)(right graph: 4EP-Cont vs 4EP+Cont p=0.0009). i, Marble Burying (Control 4EP- n=24; Control 4EP+ n=26; Mic. 4EP- n=21; Mic. 4EP+ n=21)(p=0.001) j, Left panel: EPM, time spent in open arms over time spent in closed arms. Right panel: time spent at terminus (outer 1/3 of open arms) (Males 4EP- n=17; Males 4EP+ n=17; Females 4EP- n=20; Females 4EP+ n=21)p=0.02. k, Open field test, time spent in center area over time spent in thigmotaxis left), time spent in center (right) (Males 4EP- n=16; Males 4EP+ n=14; Females 4EP- n=18; Females 4EP+ n=13)p-values left to right: 0.005, 0.003. l, Number of marbles buried in marble burying test (Males 4EP- n=24; Males 4EP+ n=23; Females 4EP- n=17; Females 4EP+ n=26)p=0.03. Abbreviations: NG2, neural/glial antigen 2; CC1, antibody (anti-adenomatous polyposis coli (APC) clone) that binds mature oligodendrocyte marker; OLIG2, oligodendrocyte transcription factor 2; clem, clemastine fumarate; mic, miconazole. Two independent cohorts of mice from multiple litters were used for each experiment in this figure. Data represent mean ± SEM analyzed by two-way ANOVA with Dunnett multiple comparison to 4EP+ group (panels b-i) or Sidak multiple comparison between 4EP+/− groups within each sex (panels j-l). * p ≤ 0.05, ** p ≤ 0.01.
Fig. 1 |
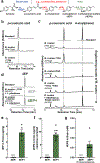
Fig. 1 |. Discovery of a 4EP biosynthetic pathway, strain engineering of gut bacteria, and colonization of mice to produce 4EPS.
a, Proposed biosynthetic pathway of 4EP in gut bacteria via tyrosine ammonia lyase (AL), phenolic acid decarboxylase (PAD), and vinyl phenol reductase (VPR) enzymes, and subsequent sulfation to 4EPS by host sulfotransferase (SULT1A1). The genes identified and cloned for bacterial strain engineering can convert tyrosine to 4EP via two chemical intermediates. b and c, 4EP precursors, p-coumaric acid and 4-vinylphenol from in vitro cultures of Bacteroides ovatus strains provided tyrosine as substrate. b, Conversion, or lack thereof, of tyrosine to p-coumaric acid by BACOVA_01194 gene (AL/1194 in figure) and deletion mutant (MFA01), respectively. c, The BACOVA_01194 gene (AL/1194 in figure) was introduced separately (MFA02), in addition to the pad gene (MFA04), or both genes as a single, highly expressed operon (MFA05). Standards are shown at top. Further details in Extended Data Figure 1, Methods, and Supplementary Information Tables 1-3. d, 4EP levels from in vitro cultures (provided with tyrosine) of 4EP- strain pair (B. ovatus Δ1194 (MFA01) and Lactobacillus plantarum) or the highest 4-vinylphenol producing engineered strain, B. ovatus 1194/PAD (MFA05) with L. plantarum (4EP+ strain pair). A standard is shown at the top. e, Levels of 4EP in feces (μg/mg) of mice colonized with bacterial strains lacking (4EP-) and producing (4EP+) 4EP (n=5). f, Levels of 4EPS in urine of mice colonized with 4EP- or 4EP+ (n=9) bacterial strains. Additional urine data, Extended Data Fig. 1k. g, Brain levels of 4EPS (after injection with probenecid) in mice colonized with 4EP- (n=4) and 4EP+ (n=6) bacterial strains. Additional controls, Extended Data Fig. 1f. At least two biologically independent trials were performed for each experiment. Abbreviations: N.D., not detectable. Data in panels e-g represent mean ± SEM.
Fig. 2 |
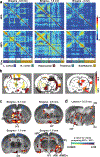
Fig. 2 |. Functional brain connectivity and regional activation is altered in response to colonization by 4EP-producing bacteria.
a, fUSi mean connectivity matrices correlating signal in brain regions for each group, 4EP+ and 4EP- (n=7), and each coronal plane, bregma −0.9mm, −1.6mm, and −2mm. Pearson correlation coefficient (r) is indicated by color according to the legend on right. Location of regions of interest (ROI) is categorized below, with further details found in Ext. Data Fig. 4a,b and Supplementary Information Table 4. b, Region pairs with significantly different connectivity in 4EP+ compared to 4EP- groups. Regions pairs are indicated by identical color of p-value (according to legend), and further indicated by dotted lines where necessary. Landmark brain regions are labeled in black, and specific ROIs are defined in Extended Data Fig. 4b and Supplementary Information Table 4. Analysis was performed using a paired t-test of each of the connectivity matrices with a Bonferroni correction to control for multiple comparisons. c-d, Color-coded overlays over representative coronal (c) and sagittal (d) sections of the mouse brain template showing significant differences in regional cerebral glucose uptake 4EP+ mice compared to 4EP- mice (n=11) (t-test, p ≤ 0.05, extent threshold > 200 contiguous voxels, with both conditions met to be deemed significant; red/blue: increase/decrease in glucose uptake in 4EP+ compared to 4EP- mice). Two independent cohorts of mice from multiple litters were used for each experiment in the figure. Abbreviations: AM, amygdala; TH, thalamus; HY, hypothalamus; CC, corpus callosum; HPC, hippocampus; CTX, cortex; GP, globus pallidus; LS, lateral septum; PVT, paraventricular nucleus of the thalamus; BNST, bed nucleus of the stria terminalis; RT/VPL: reticular/ventral posterolateral thalamic nuclei; Cb: cerebellar vermis; Pn: pontine reticular nucleus.
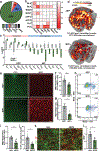
Fig. 3 |
Fig. 3 |. Reduced oligodendrocyte maturation in 4EP+ mice.
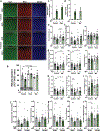
a, Number of differential genes in brain regions (n=5) of baseline mice; QuantSeq, one-way ANOVA Tukey test. b, Cell-specific enrichment analysis; p-values<0.05 in white. c, Representative subset of differential OPC and MO genes, one-way ANOVA Tukey with boxes showing 25–75th percentiles, median, and min/max points (n=5). d, Whole brain correlation to PVT seed using 2DG uptake data (n=11). PVT (red cross-section) is indicated. One-tailed multiple linear regression with minimum threshold of 200 contiguous voxels with p<0.05 was performed. e, Representative images of brain sections from 4EP- and 4EP+ mice; NG2 (red) and CC1 (green). Scale 100µm. f, Maturity quotient of oligodendrocytes in the PVT (n=8 cumulative totals used from biologically independent mice). p=0.004. g, Quantitative flow cytometry of PVT cells comparing the MOG+ quadrant 4 population over the NG2+ quadrant 1 population (n=4 pools of 5 PVTs). p=0.03. h, Representative flow plots. i-l, Organotypic brain slices treated with 10μM 4EPS. Each datapoint represents separate biological replicates. i, Maturity quotient of oligodendrocytes; using total cumulative counts from 3–5 images per replicate (vehicle, n=9; 4EPS, n=10). p=0.003. j, Percent colocalization of neurofilament (NF) and proteolipid protein (PLP) antibody stain (n=6). p=0.01. k, Representative images of panel j. Scale 20µm. l, Western blot for MBP of slices (n=6). p=0.04. Abbreviations: PVT, paraventricular nucleus of thalamus; BNST, bed nucleus of stria terminalis; BLA, basolateral amygdala; mPFC, medial prefrontal cortex; HY, hypothalamus; vHPC, ventral hippocampus; Astro, astrocyte; OPC, oligodendrocyte precursor cell; NFO, newly formed oligodendrocytes; MO, mature oligodendrocytes; Micro, microglia; Endo, endothelia; CC1, adenomatous polyposis coli; NG2, neural/glial antigen 2; MBP, myelin basic protein. Biologically independent mice from multiple randomized litters examined over one (a-c) or two respective experiments (d-l). Data represent mean ± SEM. Panels e-l analyzed by two-tailed Welch’s t-test. *p ≤ 0.05; **p ≤ 0.01.
Fig. 4 |
Fig. 4 |. 4EP(S) alters myelination and anxiety-like behavior.
a, Percent of unmyelinated axons (n=3; 4 images scored from each biological replicate). p=0.005. b, G-ratio (r/R) of all axons (4EP-, 56; 4EP+, 70 axons)(n=4; 4 images scored from each biological replicate). p=0.0001. c, Width of myelin; (4EP-, 56; 4EP+, 70 axons) (n=4; 4 images scored from each biological replicate). p=0.003. d, Representative electron tomography images. Several myelinated and unmyelinated axons marked by blue and orange arrows, respectively. e, Fractional anisotropy (FA) measured by diffusion tensor imaging (DTI) (n=4). p=0.04. f, Elevated plus maze: time spent in the terminus (outer one-third) of the open arms (4EP+ n=21; 4EP- n=24). p=0.003. g, Open field test (4EP+ n=21; 4EP- n=24). p=0.002. h, Number of marbles buried (4EP+ n=24; 4EP- n=23). p=0.02. i, Maturity quotient of oligodendrocytes in the PVT of 4EP- and 4EP+ mice ±clemastine fumarate (Cumulative totals used from individual mice: 4EP- control=7, treated=10; 4EP+ control=6, treated=6)(Cont 4EP-vs 4EP+ p=0.03; 4EP+Cont vs Treatment p=0.01). j, Representative images of brain sections from mice ±clemastine fumarate, stained for CC1 (green) and NG2 (red). k-m, Behavioral tests of mice (independent of cohorts used previously) ±clemastine fumarate. k, EPM (4EP- control n=13, treated n=13; 4EP+ control n=12, treated n=14)(4EP+Cont vs Treatment p=0.05). l, Open field test (4EP- control =15, treated n=17; 4EP+ control n=17, treated n=17) p=0.04. m, Number of marbles buried(4EP- control =15, treated n=17; 4EP+ control n=17, treated n=17)(Cont 4EP-vs 4EP+ p=0.009; 4EP+Cont vs Treatment p=0.03). Abbreviations: FA, fractional anisotropy; NG2; neural/glial antigen 2; CC1, adenomatous polyposis coli. Biologically independent mice from multiple randomized litters examined over two respective experiments used for all experiments. Data represent mean ± SEM analyzed by two-tailed Welch’s t-test (a-h) or two-way ANOVA with Dunnett multiple comparison to the 4EP+control group (i-m). *p ≤ 0.05; **p ≤ 0.01; ***p ≤ 0.001.

Comment in

Similar articles

Cited by

References

    1. Sharon G et al. Specialized metabolites from the microbiome in health and disease. Cell Metab 20, 719–730 (2014). - PMC - PubMed
    1. Swann JR et al. Application of 1H NMR spectroscopy to the metabolic phenotyping of rodent brain extracts: A metabonomic study of gut microbial influence on host brain metabolism. J Pharm Biomed Anal 143, 141–146 (2017). - PubMed
    1. Vuong HE, Yano JM, Fung TC & Hsiao EY The Microbiome and Host Behavior. Annu. Rev. Neurosci 40, 21–49 (2017). - PMC - PubMed
    1. Needham BD, Kaddurah-Daouk R & Mazmanian SK Gut microbial molecules in behavioural and neurodegenerative conditions. Nature Reviews Neuroscience 1–15 (2020) doi:10.1038/s41583-020-00381-0. - DOI - PubMed
    1. Huang F & Wu X Brain Neurotransmitter Modulation by Gut Microbiota in Anxiety and Depression. Front Cell Dev Biol 9, 649103 (2021). - PMC - PubMed

Method References:

    1. Holdeman Lillian V. & Moore WEC Anaerobe laboratory manual (4th ed). (Virginia Polytechnic Institute and State University, 1977).
    1. Martens EC, Chiang HC & Gordon JI Mucosal Glycan Foraging Enhances Fitness and Transmission of a Saccharolytic Human Gut Bacterial Symbiont. Cell Host Microbe 4, 447–457 (2008). - PMC - PubMed
    1. Koropatkin NM, Martens EC, Gordon JI & Smith TJ Starch catabolism by a prominent human gut symbiont is directed by the recognition of amylose helices. Structure 16, 1105–1115 (2008). - PMC - PubMed
    1. Bolyen E et al. Reproducible, interactive, scalable and extensible microbiome data science using QIIME 2. Nature Biotechnology 37, 852–857 (2019). - PMC - PubMed
    1. Callahan BJ et al. DADA2: High-resolution sample inference from Illumina amplicon data. Nature Methods 13, 581–583 (2016). - PMC - PubMed