

The low abundance of CpG in the SARS-CoV-2 genome is not an evolutionarily signature of ZAP
- PMID: 35165300
- PMCID: PMC8844275
- DOI: 10.1038/s41598-022-06046-5
The low abundance of CpG in the SARS-CoV-2 genome is not an evolutionarily signature of ZAP
Abstract
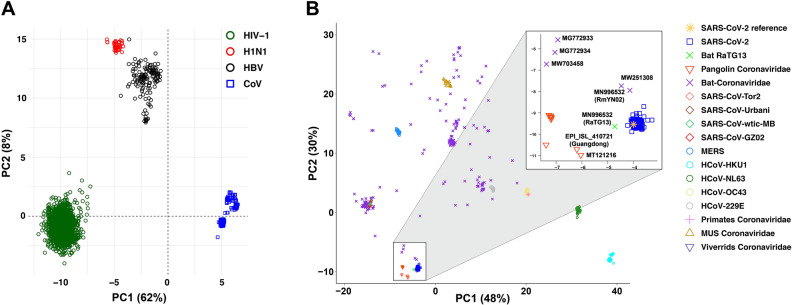
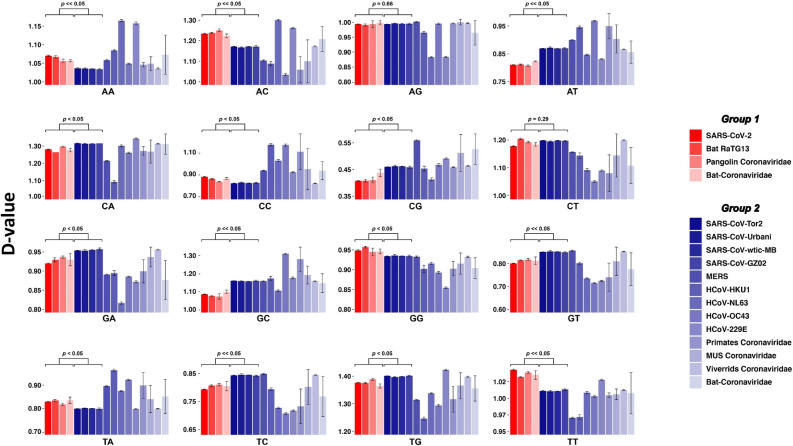
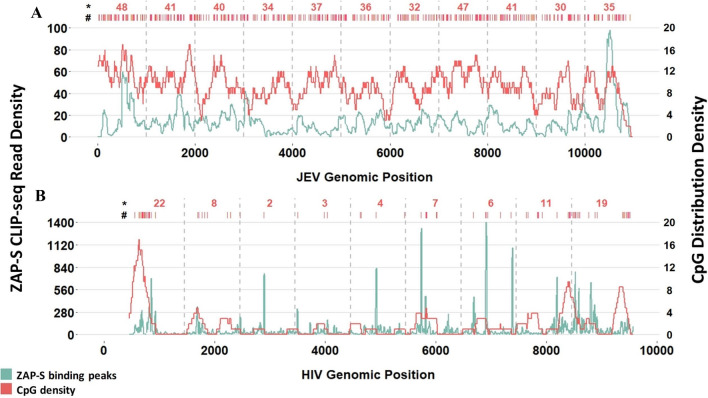
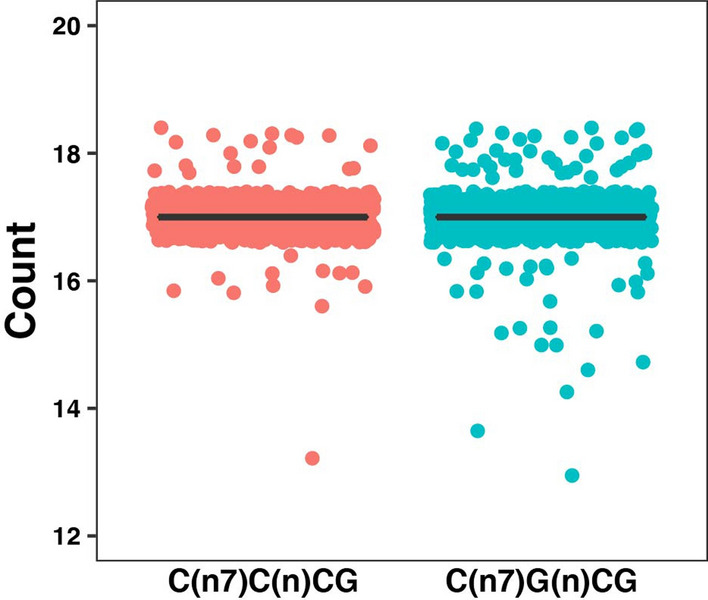
The zinc finger antiviral protein (ZAP) is known to restrict viral replication by binding to the CpG rich regions of viral RNA, and subsequently inducing viral RNA degradation. This enzyme has recently been shown to be capable of restricting SARS-CoV-2. These data have led to the hypothesis that the low abundance of CpG in the SARS-CoV-2 genome is due to an evolutionary pressure exerted by the host ZAP. To investigate this hypothesis, we performed a detailed analysis of many coronavirus sequences and ZAP RNA binding preference data. Our analyses showed neither evidence for an evolutionary pressure acting specifically on CpG dinucleotides, nor a link between the activity of ZAP and the low CpG abundance of the SARS-CoV-2 genome.
© 2022. The Author(s).
Conflict of interest statement
The authors declare no competing interests.
Figures
Similar articles
-
SARS-CoV-2 Is Restricted by Zinc Finger Antiviral Protein despite Preadaptation to the Low-CpG Environment in Humans.mBio. 2020 Oct 16;11(5):e01930-20. doi: 10.1128/mBio.01930-20. mBio. 2020. PMID: 33067384 Free PMC article.
-
CpG Dinucleotides Inhibit HIV-1 Replication through Zinc Finger Antiviral Protein (ZAP)-Dependent and -Independent Mechanisms.J Virol. 2020 Feb 28;94(6):e01337-19. doi: 10.1128/JVI.01337-19. Print 2020 Feb 28. J Virol. 2020. PMID: 31748389 Free PMC article.
-
Coronavirus genomes carry the signatures of their habitats.PLoS One. 2020 Dec 22;15(12):e0244025. doi: 10.1371/journal.pone.0244025. eCollection 2020. PLoS One. 2020. PMID: 33351847 Free PMC article.
-
Does the Zinc Finger Antiviral Protein (ZAP) Shape the Evolution of Herpesvirus Genomes?Viruses. 2021 Sep 17;13(9):1857. doi: 10.3390/v13091857. Viruses. 2021. PMID: 34578438 Free PMC article. Review.
-
Host-directed editing of the SARS-CoV-2 genome.Biochem Biophys Res Commun. 2021 Jan 29;538:35-39. doi: 10.1016/j.bbrc.2020.10.092. Epub 2020 Nov 5. Biochem Biophys Res Commun. 2021. PMID: 33234239 Free PMC article. Review.
Cited by
-
KARAJ: An Efficient Adaptive Multi-Processor Tool to Streamline Genomic and Transcriptomic Sequence Data Acquisition.Int J Mol Sci. 2022 Nov 20;23(22):14418. doi: 10.3390/ijms232214418. Int J Mol Sci. 2022. PMID: 36430895 Free PMC article.
-
Antiviral Activity of Zinc Finger Antiviral Protein (ZAP) in Different Virus Families.Pathogens. 2023 Dec 17;12(12):1461. doi: 10.3390/pathogens12121461. Pathogens. 2023. PMID: 38133344 Free PMC article. Review.
References
Publication types
MeSH terms
Substances
Grants and funding
LinkOut - more resources
Full Text Sources
Medical
Molecular Biology Databases
Miscellaneous
