

Novel epigenetic network biomarkers for early detection of esophageal cancer
- PMID: 35164838
- PMCID: PMC8845366
- DOI: 10.1186/s13148-022-01243-5
Novel epigenetic network biomarkers for early detection of esophageal cancer
Abstract
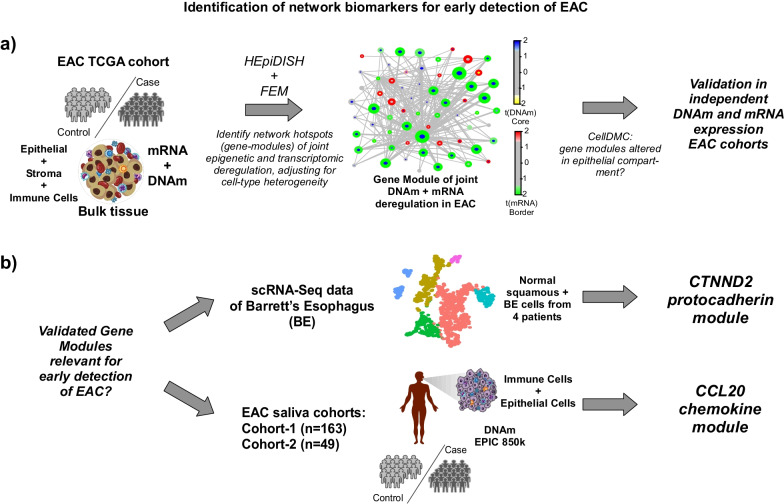
Background: Early detection of esophageal cancer is critical to improve survival. Whilst studies have identified biomarkers, their interpretation and validity is often confounded by cell-type heterogeneity.
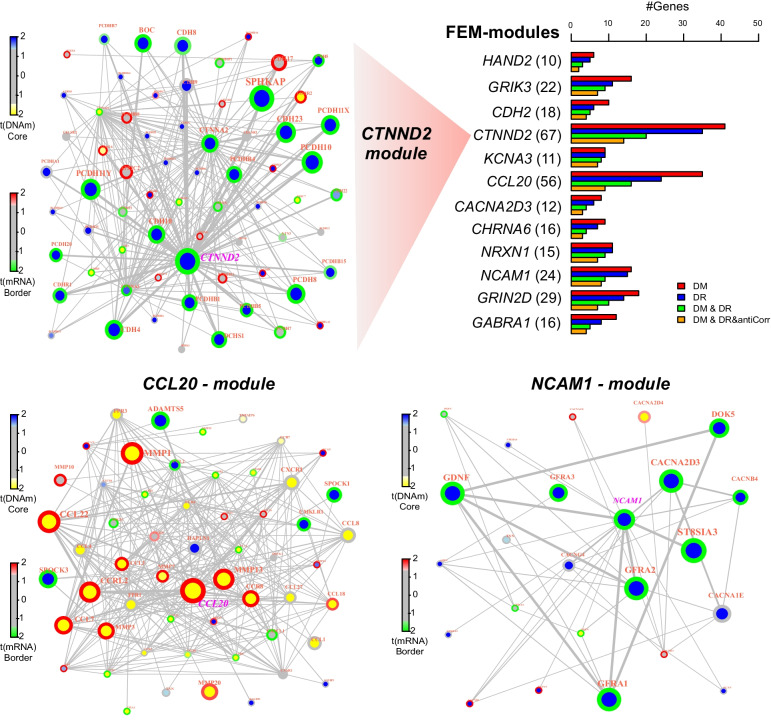
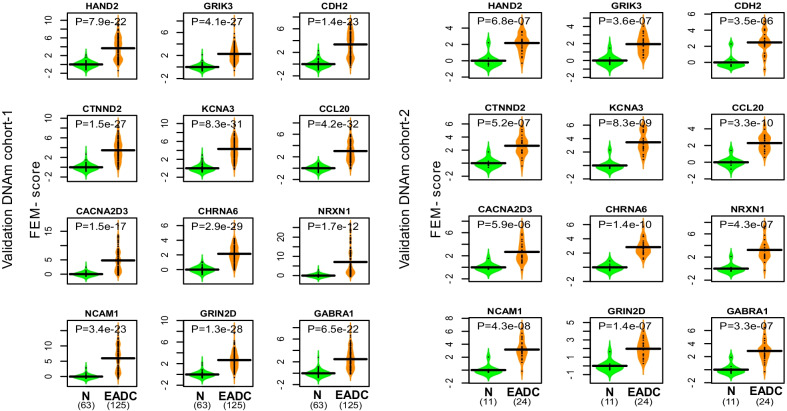
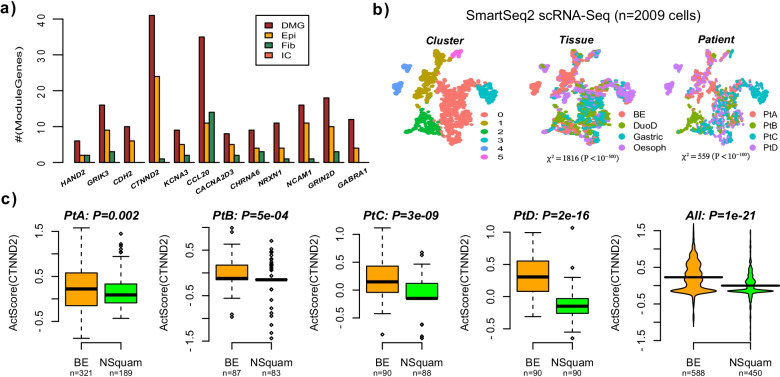
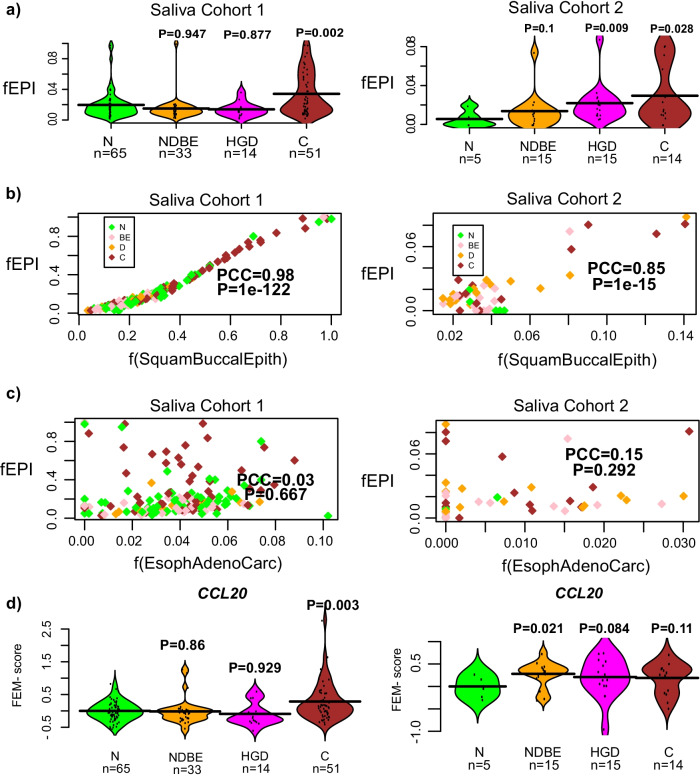
Results: Here we applied systems-epigenomic and cell-type deconvolution algorithms to a discovery set encompassing RNA-Seq and DNA methylation data from esophageal adenocarcinoma (EAC) patients and matched normal-adjacent tissue, in order to identify robust biomarkers, free from the confounding effect posed by cell-type heterogeneity. We identify 12 gene-modules that are epigenetically deregulated in EAC, and are able to validate all 12 modules in 4 independent EAC cohorts. We demonstrate that the epigenetic deregulation is present in the epithelial compartment of EAC-tissue. Using single-cell RNA-Seq data we show that one of these modules, a proto-cadherin module centered around CTNND2, is inactivated in Barrett's Esophagus, a precursor lesion to EAC. By measuring DNA methylation in saliva from EAC cases and controls, we identify a chemokine module centered around CCL20, whose methylation patterns in saliva correlate with EAC status.
Conclusions: Given our observations that a CCL20 chemokine network is overactivated in EAC tissue and saliva from EAC patients, and that in independent studies CCL20 has been found to be overactivated in EAC tissue infected with the bacterium F. nucleatum, a bacterium that normally inhabits the oral cavity, our results highlight the possibility of using DNAm measurements in saliva as a proxy for changes occurring in the esophageal epithelium. Both the CTNND2/CCL20 modules represent novel promising network biomarkers for EAC that merit further investigation.
Keywords: Barrett’s esophagus; Biological networks; DNA methylation; Esophageal adenocarcinoma; Saliva; Single-cell RNA-Seq.
© 2022. The Author(s).
Conflict of interest statement
The authors declare no competing interests.
Figures
Similar articles
-
Identification of Subtypes of Barrett's Esophagus and Esophageal Adenocarcinoma Based on DNA Methylation Profiles and Integration of Transcriptome and Genome Data.Gastroenterology. 2020 May;158(6):1682-1697.e1. doi: 10.1053/j.gastro.2020.01.044. Epub 2020 Feb 4. Gastroenterology. 2020. PMID: 32032585 Free PMC article.
-
Epigenetic biomarkers in esophageal cancer.Cancer Lett. 2014 Jan 28;342(2):193-9. doi: 10.1016/j.canlet.2012.02.036. Epub 2012 Mar 7. Cancer Lett. 2014. PMID: 22406828 Free PMC article. Review.
-
Biomarker identification and trans-regulatory network analyses in esophageal adenocarcinoma and Barrett's esophagus.World J Gastroenterol. 2019 Jan 14;25(2):233-244. doi: 10.3748/wjg.v25.i2.233. World J Gastroenterol. 2019. PMID: 30670912 Free PMC article.
-
Hypermethylation of the AKAP12 promoter is a biomarker of Barrett's-associated esophageal neoplastic progression.Cancer Epidemiol Biomarkers Prev. 2008 Jan;17(1):111-7. doi: 10.1158/1055-9965.EPI-07-0407. Cancer Epidemiol Biomarkers Prev. 2008. PMID: 18199717
-
Molecular Evolution of Metaplasia to Adenocarcinoma in the Esophagus.Dig Dis Sci. 2018 Aug;63(8):2059-2069. doi: 10.1007/s10620-018-5090-8. Dig Dis Sci. 2018. PMID: 29766388 Free PMC article. Review.
Cited by
-
Deterministic evolution and stringent selection during preneoplasia.Nature. 2023 Jun;618(7964):383-393. doi: 10.1038/s41586-023-06102-8. Epub 2023 May 31. Nature. 2023. PMID: 37258665 Free PMC article.
-
An improved epigenetic counter to track mitotic age in normal and precancerous tissues.Nat Commun. 2024 May 17;15(1):4211. doi: 10.1038/s41467-024-48649-8. Nat Commun. 2024. PMID: 38760334 Free PMC article.
-
Quantifying the stochastic component of epigenetic aging.Nat Aging. 2024 Jun;4(6):886-901. doi: 10.1038/s43587-024-00600-8. Epub 2024 May 9. Nat Aging. 2024. PMID: 38724732 Free PMC article.
-
Biomarkers for Early Detection, Prognosis, and Therapeutics of Esophageal Cancers.Int J Mol Sci. 2023 Feb 7;24(4):3316. doi: 10.3390/ijms24043316. Int J Mol Sci. 2023. PMID: 36834728 Free PMC article. Review.
-
A meta-analysis of immune-cell fractions at high resolution reveals novel associations with common phenotypes and health outcomes.Genome Med. 2023 Jul 31;15(1):59. doi: 10.1186/s13073-023-01211-5. Genome Med. 2023. PMID: 37525279 Free PMC article.
References
-
- Enzinger PC, Mayer RJ. Esophageal cancer. N Engl J Med. 2003;349:2241–2252. - PubMed
-
- Ross-Innes CS, Chettouh H, Achilleos A, Galeano-Dalmau N, Debiram-Beecham I, MacRae S, Fessas P, Walker E, Varghese S, Evan T, et al. Risk stratification of Barrett's oesophagus using a non-endoscopic sampling method coupled with a biomarker panel: a cohort study. Lancet Gastroenterol Hepatol. 2017;2:23–31. - PubMed
-
- Adil Butt M, Pye H, Haidry RJ, Oukrif D, Khan SU, Puccio I, Gandy M, Reinert HW, Bloom E, Rashid M, et al. Upregulation of mucin glycoprotein MUC1 in the progression to esophageal adenocarcinoma and therapeutic potential with a targeted photoactive antibody-drug conjugate. Oncotarget. 2017;8:25080–25096. - PMC - PubMed
Publication types
MeSH terms
Substances
Associated data
Grants and funding
LinkOut - more resources
Full Text Sources
Medical
