Comparative Phosphoproteomic Analysis of Sporulated Oocysts and Tachyzoites of Toxoplasma gondii Reveals Stage-Specific Patterns
- PMID: 35164288
- PMCID: PMC8839046
- DOI: 10.3390/molecules27031022
Comparative Phosphoproteomic Analysis of Sporulated Oocysts and Tachyzoites of Toxoplasma gondii Reveals Stage-Specific Patterns
Abstract
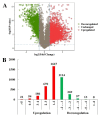
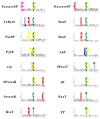
Toxoplasma gondii is an obligate intracellular protozoan of severe threat to humans and livestock, whose life history harbors both gamic and apogamic stages. Chinese 1 (ToxoDB#9) was a preponderant genotype epidemic in food-derived animals and humans in China, with a different pathogenesis from the strains from the other nations of the world. Posttranslational modifications (PTMs) of proteins were critical mediators of the biology, developmental transforms, and pathogenesis of protozoan parasites. The phosphoprotein profiling and the difference between the developmental phases of T. gondii, contributing to development and infectivity, remain unknown. A quantitative phosphoproteomic approach using IBT integrated with TiO2 affinity chromatography was applied to identify and analyze the difference in the phosphoproteomes between the sporulated oocysts and the tachyzoites of the virulent ToxoDB#9 (PYS) strain of T. gondii. A total of 4058 differential phosphopeptides, consisting of 2597 upregulated and 1461 downregulated phosphopeptides, were characterized between sporulated the oocysts and tachyzoites. Twenty-one motifs extracted from the upregulated phosphopeptides contained 19 serine motifs and 2 threonine motifs (GxxTP and TP), whereas 16 motifs identified from downregulated phosphopeptides included 13 serine motifs and 3 threonine motifs (KxxT, RxxT, and TP). Beyond the traditional kinases, some infrequent classes of kinases, including Ab1, EGFR, INSR, Jak, Src and Syk, were found to be corresponding to motifs from the upregulated and downregulated phosphopeptides. Remarkable functional properties of the differentially expressed phosphoproteins were discovered by GO analysis, KEGG pathway analysis, and STRING analysis. S8GFS8 (DNMT1-RFD domain-containing protein) and S8F5G5 (Histone kinase SNF1) were the two most connected peptides in the kinase-associated network. Out of these, phosphorylated modifications in histone kinase SNF1 have functioned in mitosis and interphase of T. gondii, as well as in the regulation of gene expression relevant to differentiation. Our study discovered a remarkable difference in the abundance of phosphopeptides between the sporulated oocysts and tachyzoites of the virulent ToxoDB#9 (PYS) strain of T. gondii, which may provide a new resource for understanding stage-specific differences in PTMs and may enhance the illustration of the regulatory mechanisms contributing to the development and infectivity of T. gondii.
Keywords: IBT; Toxoplasma gondii; life cycle; phosphoproteomics.
Conflict of interest statement
The authors confirm that the research was performed without any mercantile or monetary relations and that no potential controversy exists in the research.
Figures


Similar articles
-
Global phosphoproteome analysis reveals significant differences between sporulated oocysts of virulent and avirulent strains of Toxoplasma gondii.Microb Pathog. 2021 Dec;161(Pt A):105240. doi: 10.1016/j.micpath.2021.105240. Epub 2021 Oct 13. Microb Pathog. 2021. PMID: 34655729
-
Global iTRAQ-based proteomic profiling of Toxoplasma gondii oocysts during sporulation.J Proteomics. 2016 Oct 4;148:12-9. doi: 10.1016/j.jprot.2016.07.010. Epub 2016 Jul 12. J Proteomics. 2016. PMID: 27422377
-
iTRAQ-Based Global Phosphoproteomics Reveals Novel Molecular Differences Between Toxoplasma gondii Strains of Different Genotypes.Front Cell Infect Microbiol. 2019 Aug 23;9:307. doi: 10.3389/fcimb.2019.00307. eCollection 2019. Front Cell Infect Microbiol. 2019. PMID: 31508380 Free PMC article.
-
Host sensing and signal transduction during Toxoplasma stage conversion.Mol Microbiol. 2021 May;115(5):839-848. doi: 10.1111/mmi.14634. Epub 2020 Nov 21. Mol Microbiol. 2021. PMID: 33118234 Free PMC article. Review.
-
[Antigens of Toxoplasma gondii].Wiad Parazytol. 2000;46(3):327-34. Wiad Parazytol. 2000. PMID: 16883687 Review. Polish.
Cited by
-
iTRAQ-Based Phosphoproteomic Analysis Exposes Molecular Changes in the Small Intestinal Epithelia of Cats after Toxoplasma gondii Infection.Animals (Basel). 2023 Nov 16;13(22):3537. doi: 10.3390/ani13223537. Animals (Basel). 2023. PMID: 38003154 Free PMC article.
-
Proteomics Applications in Toxoplasma gondii: Unveiling the Host-Parasite Interactions and Therapeutic Target Discovery.Pathogens. 2023 Dec 29;13(1):33. doi: 10.3390/pathogens13010033. Pathogens. 2023. PMID: 38251340 Free PMC article. Review.
References
MeSH terms
Substances
Grants and funding
LinkOut - more resources
Full Text Sources
Molecular Biology Databases
Research Materials
Miscellaneous

