. 2022 Jan 26;23(3):1422.
doi: 10.3390/ijms23031422.

Hypoxia/Ischemia-Induced Rod Microglia Phenotype in CA1 Hippocampal Slices

Affiliations

Hypoxia/Ischemia-Induced Rod Microglia Phenotype in CA1 Hippocampal Slices

Daniele Lana et al. Int J Mol Sci. .

Abstract

The complexity of microglia phenotypes and their related functions compels the continuous study of microglia in diseases animal models. We demonstrated that oxygen-glucose deprivation (OGD) induced rapid, time- and space-dependent phenotypic microglia modifications in CA1 stratum pyramidalis (SP) and stratum radiatum (SR) of rat organotypic hippocampal slices as well as the degeneration of pyramidal neurons, especially in the outer layer of SP. Twenty-four h following OGD, many rod microglia formed trains of elongated cells spanning from the SR throughout the CA1, reaching the SP outer layer where they acquired a round-shaped amoeboid phagocytic head and phagocytosed most of the pyknotic, damaged neurons. NIR-laser treatment, known to preserve neuronal viability after OGD, prevented rod microglia formation. In CA3 SP, pyramidal neurons were less damaged, no rod microglia were found. Thirty-six h after OGD, neuronal damage was more pronounced in SP outer and inner layers of CA1, rod microglia cells were no longer detectable, and most microglia were amoeboid/phagocytic. Damaged neurons, more numerous 36 h after OGD, were phagocytosed by amoeboid microglia in both inner and outer layers of CA1. In response to OGD, microglia can acquire different morphofunctional phenotypes which depend on the time after the insult and on the subregion where microglia are located.

Keywords: CA3 hippocampus; confocal microscopy; immunofluorescence; neurodegeneration; oxygen glucose deprivation; phagocytosis; rod microglia train.


Conflict of interest statement

The authors declare no conflict of interest.

Figures
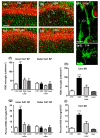
Figure 1
Figure 1
(ad) Representative confocal images of NeuN+ neurons (red) and IBA1+ total microglia (green) in CA1 hippocampus of a CTR (a), an OGD (b), an OGD+Laser (c) and a Laser (d) organotypic hippocampal slices captured with a 20× objective. Images were obtained by stacking 3 consecutive confocal scans (z step 1.2 µm, total thickness 3.6 µm). Numerous rod microglia are present in CA1 SP and CA1 SR of OGD slices (open arrows). The dotted lines delineate the inner and outer CA1 SP layers. Scale bar: 50 µm. (e) Confocal 3D-rendering of an IBA1-positive rod microglia (green, open arrow) NeuN-positive neurons (red), captured with a 63× objective in an OGD organotypic hippocampal slice. The 3D-rendering was obtained stacking 15 consecutive confocal scans (z step 0.3 µm, total thickness 4.5 µm). Scale bar: 20 µm. (e1) Confocal 3D-rendering of an IBA1-positive (green) resting microglia captured with a 63× objective in a CTR organotypic hippocampal slice. The 3D-rendering is obtained stacking 12 consecutive confocal scans (z step 0.3 µm, total thickness 3.6 µm). Scale bar: 20 µm. (f) Quantitative analyses of rod microglia density (cells/mm2) in the inner and outer layers of CA1 SP. Statistical analysis: Inner CA1 SP: *** p < 0.001, OGD vs. all other experimental groups; Outer CA1 SP: no significant differences were found among the 4 experimental groups. (g) Quantitative analyses of the percent of rod microglia on total microglia in inner and outer layers of CA1 SP. Statistical analysis: Inner CA1 SP: *** p < 0.001, OGD vs. all experimental groups; Outer CA1 SP: no significant differences were found among the 4 experimental groups; (h) Quantitative analyses of rod microglia density (cells/mm2) in CA1 SR. Statistical analysis: *** p < 0.001 OGD vs. all experimental groups. (i) Quantitative analyses of the percent of rod microglia on total microglia in CA1 SR. Statistical analysis: *** p < 0.001 OGD vs. all experimental groups. In the bar graphs, each bar represents the mean ± SEM of 5–7 independent slices. All statistical analyses were performed by One-way ANOVA followed by Newman-Keuls post hoc test.
Figure 2
Figure 2
(a,b) Representative confocal images of NeuN-positive neurons (red), and IBA1-positive total microglia (green) in CA1 of a CTR (a), and an OGD (b) organotypic hippocampal slice captured with a 40× objective. The images were obtained stacking 5 consecutive confocal scans (z step 0.5 µm, total thickness 2.5 µm). The dotted lines delineate the inner and outer CA1 SP layers. Scale bar: 20 µm. (c) Quantitative analyses of total microglia density (cells/mm2) in the inner and outer layers of CA1 SP. Statistical analysis: n.s. (d) Quantitative analyses of total microglia density (cells/mm2) in CA1 SR. Statistical analysis: n.s. In the bar graphs, each bar represents the mean ± SEM of 6–7 independent slices. All statistical analyses were performed by One-way ANOVA followed by Newman-Keuls post hoc test.
Figure 3
Figure 3
(a) Representative confocal images of NeuN-positive neurons (green) in CA1 of an OGD organotypic hippocampal slice. The image was obtained from a single confocal scan captured with a 20× objective, total thickness 1.2 µm. The dotted line delineates the inner and outer CA1 SP layers. Numerous HDN neurons (open arrows) are located mainly in the outer layer of CA1 SP. Scale bar: 50 µm. (b) Quantitative analyses of HDN neurons density (cells/mm2) in the inner and outer CA1 SP. Statistical analysis: ** p < 0.01, Outer CA1 SP OGD vs. Inner CA1 SP OGD. (c) Quantitative analyses of HDN neurons density (cells/mm2) in the proximal and distal CA1 SP. Statistical analysis: * p < 0.05, Distal CA1 SP OGD vs. Proximal CA1 SP OGD. (dd3) Representative confocal images of NeuN-positive neurons (green, (d1)), OX6-positive active microglia (red, (d2)) and IBA1-positive total microglia (blue, (d3)) in CA1 of an OGD organotypic hippocampal slice captured with a 63× objective. The merge of the three immunofluorescent staining is shown in (d) in which the pink-purple color is indicative of active (OX6-positive) microglia cells (IBA1-positive). The images were obtained stacking 10 consecutive confocal scans (z step 0.3 µm, total thickness 3 µm). Numerous active microglia cell bodies phagocytosing HDN neurons are present in the outer CA1 SP (open arrows). The dotted lines delineate the inner and outer CA1 SP. Scale bar: 25 µm. (e) Quantitative analyses of the density of phagocytic microglia (cells/mm2) in the inner and outer layers of CA1 SP. Statistical analysis: ** p < 0.01, Outer CA1 SP OGD vs. Inner CA1 SP OGD. In the bar graphs, each bar represents the mean ± SEM of 7–9 independent slices. All statistical analyses were performed by Student’s paired t test. (ff3) Representative confocal images of NeuN-positive neurons (green, (f1)), OX6-positive active microglia (red, (f2)) and IBA1-positive total microglia (blue, (f3)) in CA1 of an OGD organotypic hippocampal slice captured with a 63× objective. The merge of the three immunofluorescent staining is shown in (f). The images were obtained stacking 10 consecutive confocal scans (z step 0.3 µm, total thickness 3 µm) taken in the outer CA1 SP and show two active (OX6-positive, (f2)) microglia cells phagocytosing HDN neurons. Scale bar: 10 µm. (g) Enlargement of the IBA1-positive (blue) and OX6-positive (red) microglia cells indicated by the white arrows in (d). The images were obtained stacking 10 consecutive confocal scans (z step 0.3 µm, total thickness 3 µm) and show rod microglia with a rod “tail” (arrowheads) and a phagocytic “head” (arrows). The neurons were eliminated for clarity. Scale bar: 7.5 µm. (h) Representative confocal images of IBA1-positive microglia (green) and DAPI-positive nuclei (open arrows, blue) in CA1 of an OGD organotypic hippocampal slice captured with a 63× objective. The image was obtained by stacking 10 consecutive confocal scans (z step 0.3 µm, total thickness 3 µm). It is clearly visible that 5 rod microglia cells form a train. Scale bar: 15 µm.
Figure 4
Figure 4
(ac3) Representative confocal images of NeuN-positive neurons (green, (a1,b1,c1)), OX6-positive active microglia (red, (a2,b2,c2)) and IBA1-positive total microglia (blue, (a3,b3,c3)) in CA1 SP of OGD organotypic hippocampal slices captured with a 63× objective, stacking 5 consecutive confocal scans (z step 0.3 µm, total thickness 1.5 µm). The merge of the three immunofluorescent staining is shown in (ac) in which the pink-purple color is indicative of active (OX6-positive) microglia cells (IBA1-positive). (aa3,bb3) It is possible to notice that active (OX6-positive, a2, b2, open arrow) microglia cells (IBA1-positive, a3, b3, open arrow) phagocytose an LDN neurons (NeuN-positive, (a,a1), (b,b1), arrowhead). Scale bar (aa3): 15 µm. Scale bar (bb3): 7.5 µm. (cc3) It is possible to notice in pink-purple color ((c), arrowheads) an active (OX6-positive, (c2), arrowheads) microglia cells (IBA1-positive, (c3), arrowheads) adjacent to apical dendrites of pyramidal neurons that project in the SR (NeuN-positive, (c,c1), open arrows).
Figure 5
Figure 5
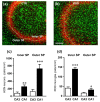
(a,b) Representative confocal images of NeuN-positive neurons (red) and IBA1-positive total microglia (green) in CA3 hippocampus of a CTR (a) and an OGD (b) organotypic hippocampal slices captured with a 20× objective. Images were obtained stacking 3 consecutive confocal scans (z step 1.2 µm, total thickness 3.6 µm). It appears that HDN neurons and rod microglia were not significantly more numerous in the OGD slice than in the control slice. The dotted lines delineate the inner and outer CA3 SP layers. Scale bar: 125 µm. (c) Quantitative analysis of HDN neurons density (cells/mm2) in the inner and outer layers of CA3 and CA1 SP of slices subjected to OGD. HDN neurons were significantly more numerous in both the inner and outer CA1 SP than in the inner and outer CA3 SP, respectively. Statistical analysis: ** p < 0.01, inner CA1 SP vs. inner CA3 SP; *** p < 0.001, outer CA1 SP vs. outer CA3 SP. (d) Quantitative analysis of rod microglia density (cells/mm2) in the inner and outer layers of CA3 and CA1 SP of slices subjected to OGD. Rod microglia were significantly more numerous in both the inner and outer CA1 SP than in the inner and outer CA3 SP, respectively. Statistical analysis: *** p < 0.001, inner CA1 SP vs. inner CA3 SP; * p < 0.05, outer CA1 SP vs. outer CA3 SP. In the bar graphs, each bar represents the mean ± SEM of 7–11 independent slices. All statistical analyses were performed by Student’s paired t test.
Figure 6
Figure 6
(a) Representative confocal images of NeuN-positive neurons (red) and IBA1-positive microglia (green) in CA1 hippocampus of an OGD organotypic hippocampal slices, harvested 36 h after the insult. The images, captured with a 40× objective, were obtained stacking 5 consecutive confocal scans (z step 0.5 µm, total thickness 2.5 µm). (a1) Enlargement of the framed area in A. In CA1 SP, most microglia cells had acquired an amoeboid phagocytic conformation and numerous HDN neurons were phagocytosed by microglia (arrows). (b) Quantitative analysis of rod microglia density (cells/mm2) in the inner and outer CA1 SP of OGD 24 h and OGD 36 h slices. Rod microglia were significantly less numerous in both the inner and outer CA1 SP 36 h after OGD than 24 h after OGD. Statistical analysis: *** p < 0.001, OGD 36 h vs. OGD 24 h; * p < 0.05, OGD 36 h vs. OGD 24 h. In the bar graphs, each bar represents the mean ± SEM of 6–8 experiments. All statistical analyses were performed by Student’s paired t test. (c) Quantitative analysis of HDN neurons density (cells/mm2) in the inner and outer CA1 SP of OGD 24 h and OGD 36 h slices. HDN neurons were significantly more numerous in both the inner and outer CA1 SP 36 h after OGD than 24 h after OGD. Statistical analysis: *** p < 0.001, OGD 36 h vs. OGD 24 h; ** p < 0.001, OGD 36 h vs. OGD 24 h. (d) Quantitative analyses of the density of amoeboid/phagocytic microglia (cells/mm2) in the inner and outer layers of CA1 SP. Statistical analysis: *** p < 0.001, OGD 36 h vs. OGD 24 h. In the bar graphs, each bar represents the mean ± SEM of 4–9 independent slices. All statistical analyses were performed by Student’s paired t test.
Figure 7
Figure 7
Schematic representation of the healthy CA1 hippocampus (a) and the morphofunctional modifications of microglia and neurons at 24 (b) and 36 h (c) after the OGD. Resting microglia (blue), activated rod microglia (pink-purple), amoeboid/phagocytic microglia (red). A train of rod microglia is shown (b).

Similar articles

Cited by

References

    1. Frost J.L., Schafer D.P. Microglia: Architects of the Developing Nervous System. Trends Cell Biol. 2016;26:587–597. doi: 10.1016/j.tcb.2016.02.006. - DOI - PMC - PubMed
    1. Aguzzi A., Barres B.A., Bennett M.L. Microglia: Scapegoat, saboteur, or something else? Science. 2013;339:156–161. doi: 10.1126/science.1227901. - DOI - PMC - PubMed
    1. Nimmerjahn A., Kirchhoff F., Helmchen F. Neuroscience: Resting microglial cells are highly dynamic surveillants of brain parenchyma in vivo. Science. 2005;308:1314–1318. doi: 10.1126/science.1110647. - DOI - PubMed
    1. Kettenmann H., Hanisch U.K., Noda M., Verkhratsky A. Physiology of microglia. Physiol. Rev. 2011;91:461–553. doi: 10.1152/physrev.00011.2010. - DOI - PubMed
    1. Crotti A., Glass C.K. The choreography of neuroinflammation in Huntington’s disease. Trends Immunol. 2015;36:364–373. doi: 10.1016/j.it.2015.04.007. - DOI - PMC - PubMed