. 2022 Feb 2;14(3):776.
doi: 10.3390/cancers14030776.

Dissecting the Mechanism of Action of Spiperone-A Candidate for Drug Repurposing for Colorectal Cancer

Affiliations

Dissecting the Mechanism of Action of Spiperone-A Candidate for Drug Repurposing for Colorectal Cancer

Annamaria Antona et al. Cancers (Basel). .

Abstract

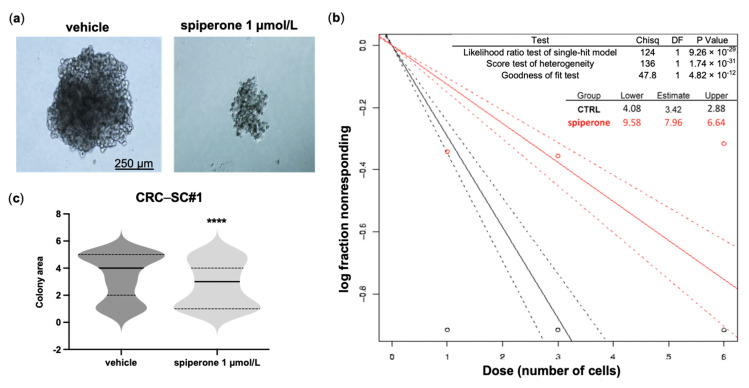
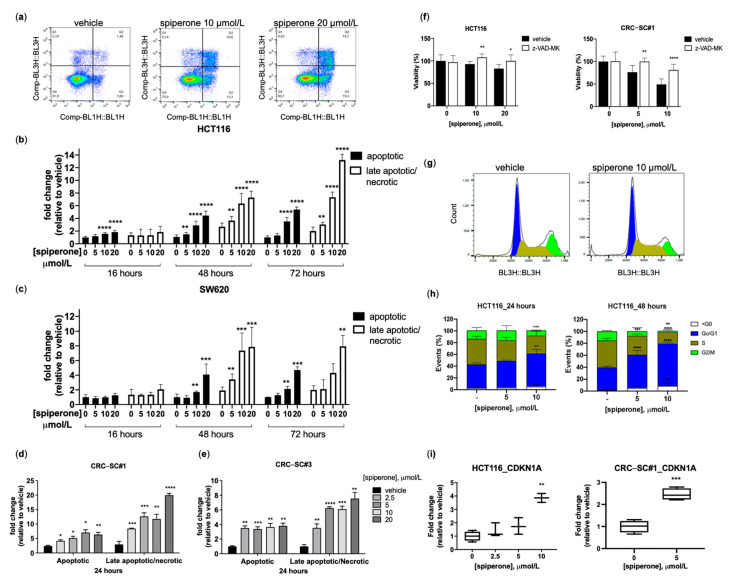
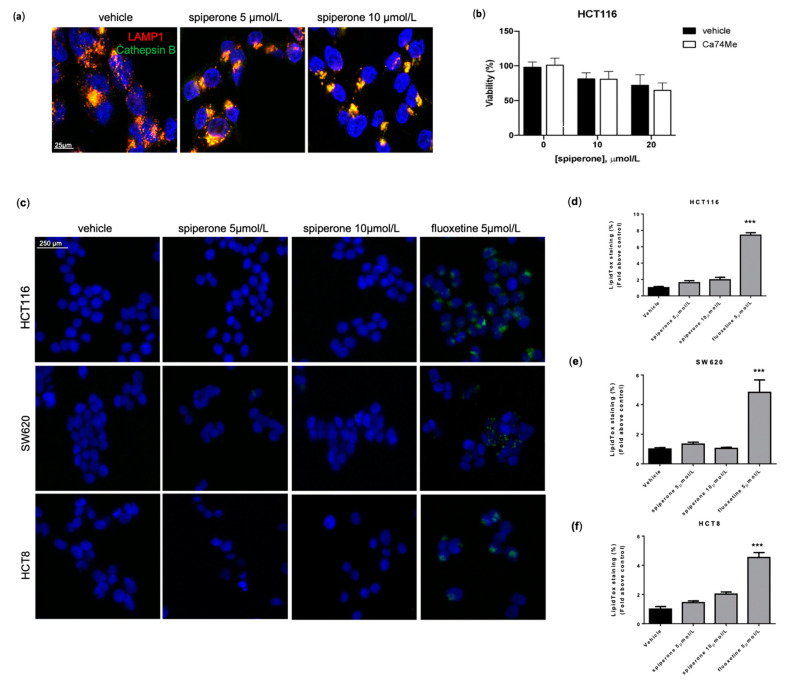
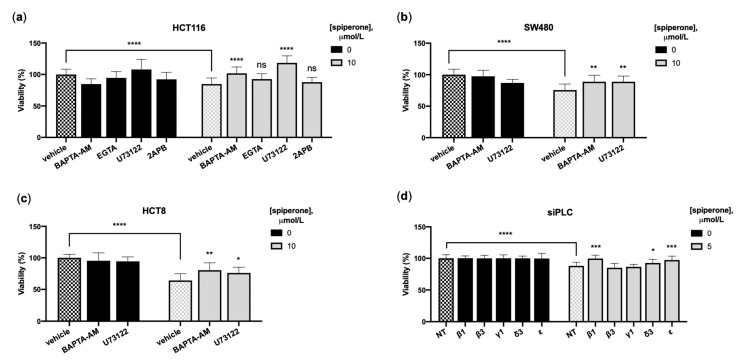
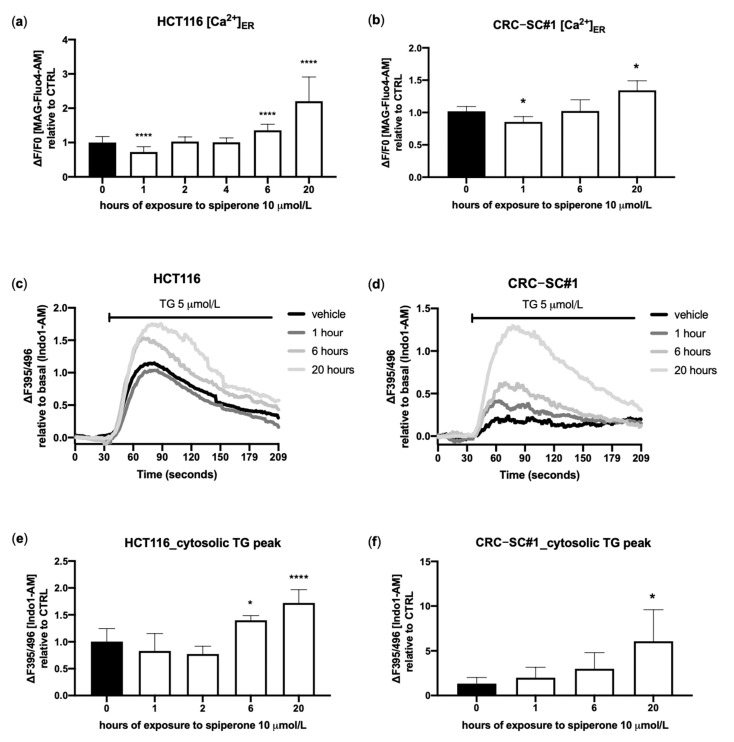
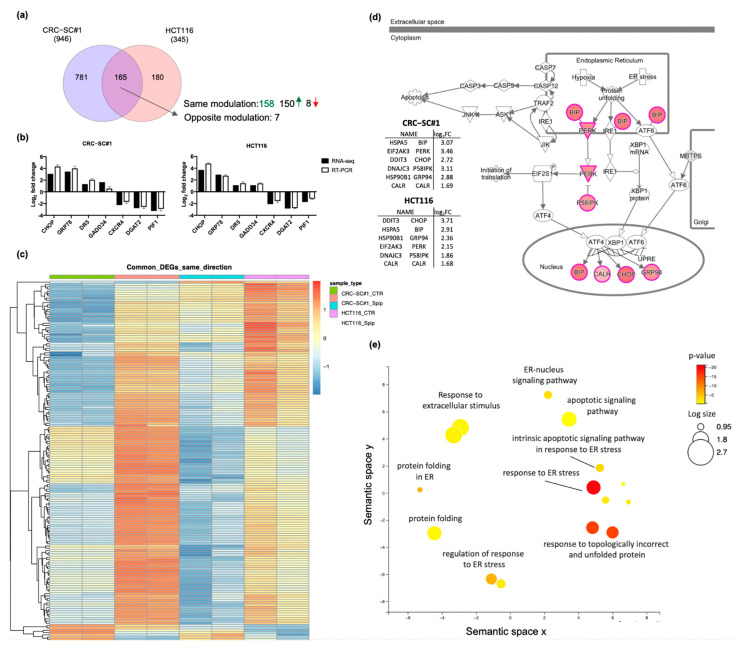
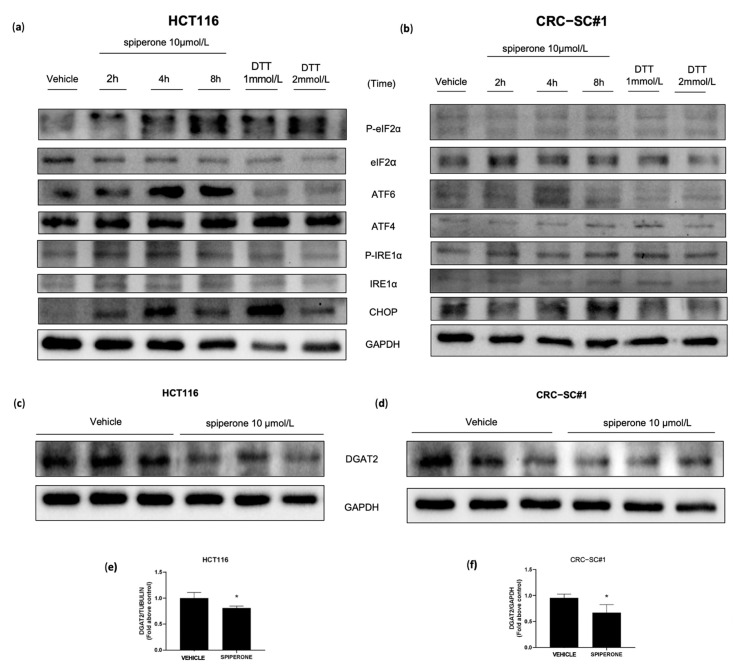
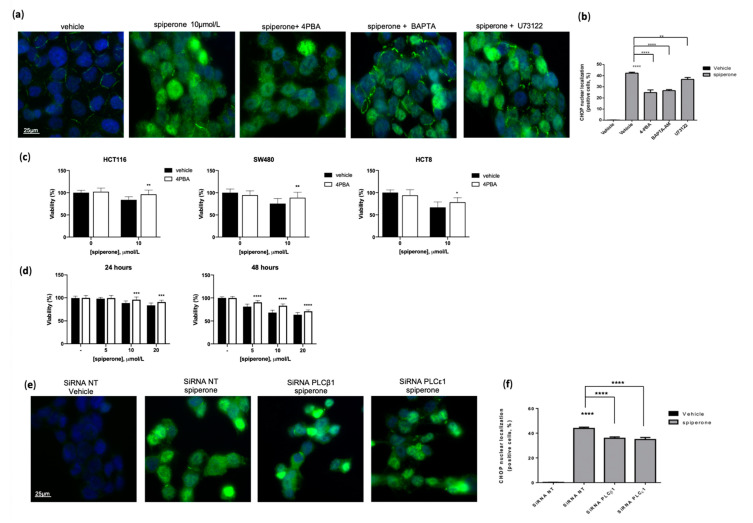
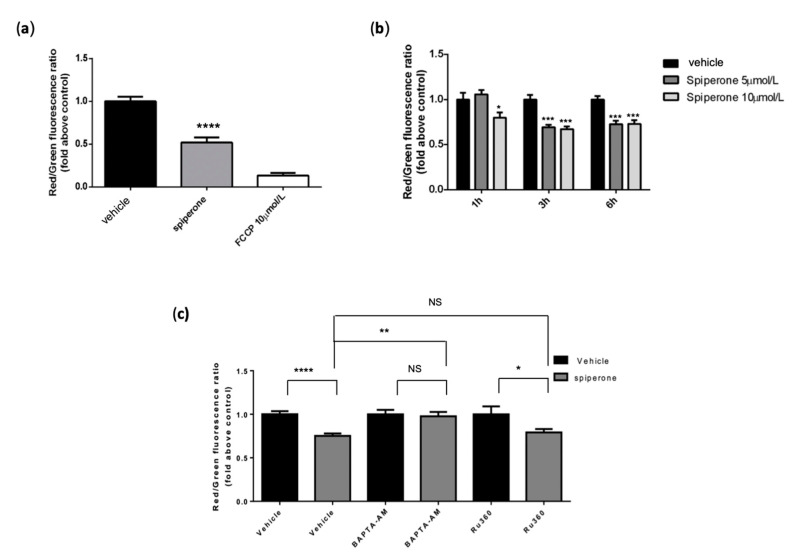
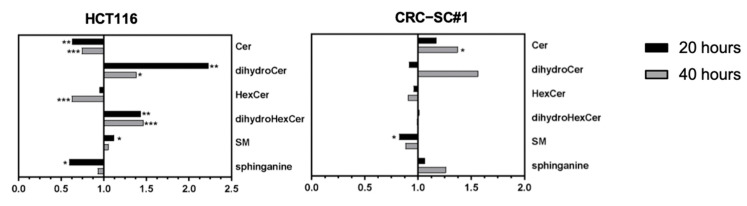
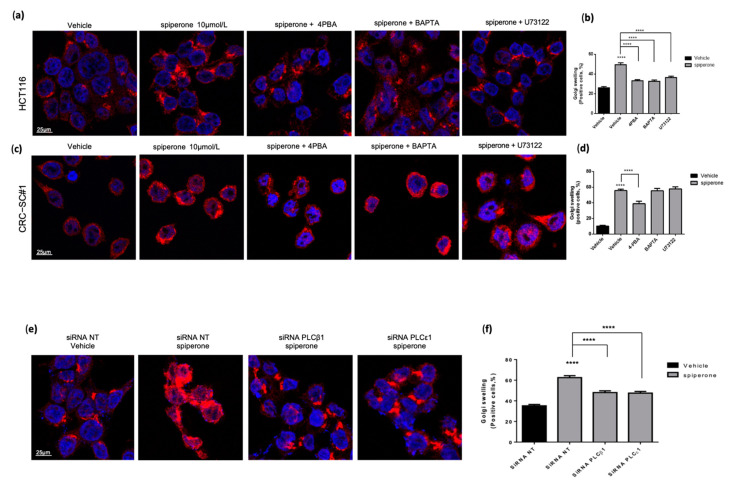
Approximately 50% of colorectal cancer (CRC) patients still die from recurrence and metastatic disease, highlighting the need for novel therapeutic strategies. Drug repurposing is attracting increasing attention because, compared to traditional de novo drug discovery processes, it may reduce drug development periods and costs. Epidemiological and preclinical evidence support the antitumor activity of antipsychotic drugs. Herein, we dissect the mechanism of action of the typical antipsychotic spiperone in CRC. Spiperone can reduce the clonogenic potential of stem-like CRC cells (CRC-SCs) and induce cell cycle arrest and apoptosis, in both differentiated and CRC-SCs, at clinically relevant concentrations whose toxicity is negligible for non-neoplastic cells. Analysis of intracellular Ca2+ kinetics upon spiperone treatment revealed a massive phospholipase C (PLC)-dependent endoplasmic reticulum (ER) Ca2+ release, resulting in ER Ca2+ homeostasis disruption. RNA sequencing revealed unfolded protein response (UPR) activation, ER stress, and induction of apoptosis, along with IRE1-dependent decay of mRNA (RIDD) activation. Lipidomic analysis showed a significant alteration of lipid profile and, in particular, of sphingolipids. Damage to the Golgi apparatus was also observed. Our data suggest that spiperone can represent an effective drug in the treatment of CRC, and that ER stress induction, along with lipid metabolism alteration, represents effective druggable pathways in CRC.

Keywords: Golgi; cancer stem cells; colorectal cancer; endoplasmic reticulum stress; intracellular calcium; lipid metabolism; mitochondria; phospholipase C; psychotropic drugs; repurposing.


Conflict of interest statement

The authors declare no conflict of interest. The funders had no role in the design of the study; in the collection, analyses, or interpretation of data; in the writing of the manuscript, or in the decision to publish the results.

Figures

Figure 1
Figure 1
In vitro analysis of CRC-SCs’ self-renewal using the limiting dilution assay. CRC-SCs were dissociated to single cells and plated into 96-well plates. The number of wells containing spheres was then evaluated along with the size of each colonosphere. A sphere formation assay was performed on CRC-SC populations to evaluate their stemness and clonogenic potential. Representative image of CRC-SC#1 colonospheres (vehicle vs. treated) (a). Output of the ELDA software: the amount of initially seeded cells (x-axis) is plotted against the log fraction of wells without any detected spheres (y-axis). The slope of the line represents the log-active cell fraction (b). Distribution of colonospheres’ size (vehicle vs. treatment) (c). Data represent the mean ± SD from three independent experiments; ****: Student’s t-test p < 0.0001.
Figure 2
Figure 2
Spiperone induces apoptosis in CRC cells and induces cell cycle arrest in the G1 phase. Representative dot plots showing cell distribution of HCT116 cells treated for 48 h with different concentrations of spiperone after Annexin V/PI (Ax/PI) staining (a). Graph showing the analysis of HCT116 (b) and SW620 (c) cells treated with different concentrations of spiperone at different time points. Graphs showing the analysis of CRC-SC#1 (d) and CRC-SC#2 (e) cells treated with different concentrations of spiperone for 24 h. Cell populations are indicated as apoptotic (Ax+/PI−) and late apoptotic/necrotic (Ax+/PI+). Data represent the mean ± SD of at least three independent experiments performed in duplicate. *: Student’s t-test p < 0.05; **: Student’s t-test p < 0.01; ***: Student’s t-test p < 0.001; ****: Student’s t-test p < 0.0001. Cell viability was performed on HCTT16 and CRC-SC#1 cells co-treated for 24 h with different doses of spiperone along with vehicle or 10 μmol/L zVAD-FMK. Graphs displaying cell viability as the percentage of viable cells; data represent the mean ± SD of at least three independent experiments performed in triplicate. *: Student’s t-test p < 0.05; **: Student’s t-test p < 0.01; ****: Student’s t-test p < 0.0001 (f). Representative frequencies of distribution of PI staining were analyzed by flow cytometry of HCT116 cells treated with spiperone for 24 h (g). Numbers of cells in the G0, G1, S, and G2 phases of the cell cycle after 24 h and 48 h of treatment with scalar doses of spiperone (h); data represent the mean ± SD of at least three independent experiments performed in triplicate. **: Student’s t-test p < 0.01; ***: Student’s t-test p < 0.001; ****: Student’s t-test p < 0.0001. Gene expression analysis of CDKN1A by RT-qPCR. Relative expressions were determined by the ΔΔCt method and normalized with the control gene GUSB (i); data represent the mean ± SD of at least three independent experiments performed in duplicate. **: Student’s t-test p < 0.01; ***: Student’s t-test p < 0.001.
Figure 3
Figure 3
Treatment with spiperone does not induce lysosomal damage in CRC cells. Colocalization of cathepsin B and lysosomes was evaluated in HCT116 cells by using cathepsin B (green) and LAMP1 (red) antibodies after 16 h of treatment with spiperone. Nuclei were stained using DAPI. Pictures were acquired with a Leica SP8 confocal microscope (magnification: 63×) (a). Effect of the co-treatment with spiperone and the cathepsin B inhibitor Ca74Me at 10 μmol/L. After 30 min of pretreatment, HCT116 cells were treated with vehicle or 10 and 20 μmol/L spiperone for 24 h. Graph displaying cell viability as the percentage of viable cells. Data represent the mean ± SD of three independent experiments performed in triplicate (b). Accumulation of phospholipids was evaluated after 16 h of treatment with drugs using LipidTOX Green staining. Nuclei were stained using Hoechst 33342. Pictures were acquired by fluorescence microscopy (magnification: 20×). Representative images of cells treated with vehicle or 5 and 10 μmol/L spiperone (c). Histograms showing quantification of LipidTOX Green staining/blue nuclei staining ratio as the fold change relative to control in HCT116, SW620, and HCT8 cells. Data are presented as the mean ± SD from three independent experiments, each performed in triplicate. ***: Student’s t-test p < 0.001 (df).
Figure 4
Figure 4
Spiperone increases intracellular Ca2+ concentration by inducing a PLC-dependent Ca2+ release from the ER. [Ca2+]cyt (upper panel) and [Ca2+]ER (lower panel) were simultaneously evaluated before and after spiperone exposure. Graphs representing the mean of fluorescence kinetics over time with (black line) or without extracellular Ca2+ (grey line) in HCT116 (a) and CRC-SC#1 (b) cells. Histogram displaying quantification of fluorescence peaks relative to basal signal for Indo-1 AM and Mag-Fluo-4 AM in HCT116 and CRC-SC#1 (c) cells. Evaluation of the effects of U73122 and 2-APB on spiperone-induced intracellular Ca2+ modulation, [Ca2+]cyt (upper panel), and [Ca2+]ER (lower panel) were simultaneously evaluated in the absence of extracellular Ca2+ before and after spiperone exposure. Graph representing the mean of fluorescence kinetics over time in cells pretreated with vehicle (dotted black line), U73122 10 μmol/L (solid black line), and 2APB 50 μmol/L (solid grey line) in HCT116 cells (d) and CRC-SC#1 cells (e). Histogram displaying quantification of fluorescence peaks relative to basal signal for Indo-1 AM and Mag-Fluo-4 AM in HCT116 cells and CRC-SC line #1 (f). Data represent the mean ± SD of at least three independent experiments. *: Student’s t-test p < 0.05; **: Student’s t-test p < 0.01; ***: Student’s t-test p < 0.001; ****: Student’s t-test p < 0.0001.
Figure 5
Figure 5
Spiperone induces Ca2+ and PLC-dependent cell death. Effect of co-treatment with spiperone and 1 μmol/L BAPTA-AM, 1 μmol/L EGTA, 2 μmol/L U73122, and 10 μmol/L 2APB in HCT116 cells. After 30 min of pretreatment, cells were co-treated with 10 μmol/L spiperone or vehicle for 24 h (a). Effect of co-treatment with spiperone and 1 μmol/L BAPTA-AM or 2 μmol/L U73122 in SW480 (b) and HCT8 cells (c). After 30 min of pretreatment, 10 μmol/L spiperone or vehicle were added, and co-treatment was maintained for 24 h. Effect of PLC silencing on spiperone-induced cell death. HCT116-silenced cells were treated for 48 with 5 μmol/L spiperone (d). Graphs displaying cell viability as the percentage of viable cells. Data show the mean ± SD of at least three independent experiments performed in triplicate. *: Student’s t-test p < 0.05; **: Student’s t-test p < 0.01; ***: Student’s t-test p < 0.001; ****: Student’s t-test p < 0.0001.
Figure 6
Figure 6
Spiperone induces a long-term increase in [Ca2+]ER and enhances intracellular storage release. [Ca2+]ER was evaluated in HCT116 and CRC-SC#1 cells treated with 10 µmol/L spiperone at different time points. Histogram displaying fluorescence quantification relative to control signal for Mag-Fluo-4 AM in HCT116 (a) and CRC-SC#1 (b) cells. [Ca2+]cyt was monitored before and after 5 µmol/L TG exposure in cells treated with spiperone at different time points. Graph representing the mean of fluorescence kinetics over time in HCT116 cells (c) and CRC-SC#1 cells (d). Histogram displaying quantification of fluorescence peaks relative to the control signal for Indo-1 after 5 µmol/L TG exposure in HCT116 (e) and CRC-SC#1 (f) cells. Data show the mean ± SD of at least three independent experiments. *: Student’s t-test p < 0.05; ****: Student’s t-test p < 0.0001.
Figure 7
Figure 7
Spiperone induces ER stress in CRC cells. Venn diagram showing the number of DEGs between HCT116 and CRC-SC#1 cells (a). Log2FC validation of RNA-Seq analysis through RT-PCR in CRC-SC#1 and HCT116 cells (b). Heatmap showing unsupervised hierarchical clustering of the 158 common DEGs between the two comparison groups (HCT116-Spip vs. HCT116-CTR and CRC-SC#1-Spip vs. CRC-SC#1-CTR) that have the same trend (c). ER Stress molecular pathways from IPA Ingenuity software, and Log2FC of the upregulated genes. Red-colored molecules are upregulated in both of the two comparison groups and, therefore, upregulated after the treatment with spiperone in HCT116 and CRC-SC#1 cells (d). Semantic plot of the common enriched biological processes (e).
Figure 8
Figure 8
Spiperone induces ER stress in CRC cells. Western blot analysis of HCT116 cells (a) and CRC-SC#1 (b) after 2, 4 and 8 h of treatment with spiperone. Lysates were analyzed for P-eIF2α, eIF2α, ATF4 ATF6, P-IRE1α, IRE1α, CHOP, and GAPDH. Data are representative images of three independent experiments. Western blot analysis of DGAT2 protein in HCT116 (c) and CRC-SC#1 cells (d). After 20 h treatment with 10 μmol/L spiperone, lysates were analyzed for DGAT2 and GAPDH. Histograms displaying DGAT2 quantification in HCT116 cells (e) and CRC-SC#1 cells (f). Data are presented as the mean ± SD from three independent experiments. *: p < 0.05.
Figure 9
Figure 9
CHOP nuclear localization is mitigated by BAPTA-AM, U73122, 4-PBA, and PLC β1 and ε1 silencing. HCT116 cells were treated with 10 μmol/L vehicle or spiperone, alone or in combination with 10 μmol/L BAPTA-AM, 1 μmol/L U73122, and 10 μmol/L 4-PBA. CHOP nuclear localization was evaluated by fluorescence microscopy by using anti-CHOP primary antibody (green). Nuclei were stained with DAPI (blue) (a). Histogram showing the ratio of the number of cells presenting CHOP nuclear localization to the total number of cells (b). Data are presented as the mean ± SD of three independent experiments, each performed in triplicate. **: Student’s t-test p < 0.01; ****: Student’s t-test p < 0.0001. Effect of co-treatment with spiperone and the ER stress inhibitor 4PBA at 10 μmol/L. After 30 min of pretreatment, HCT116, SW480, and HCT8 cells were treated with 10 μmol/L vehicle or spiperone for 24 h (c). Graphs displaying cell viability as the percentage of viable cells. Data show the mean ± SD of at least three independent experiments performed in triplicate. *: Student’s t-test p < 0.05; **: Student’s t-test p < 0.01. Effect of CHOP silencing in HCT116 cells; HCT116-silenced cells were treated for 24 and 48 h with 5 μmol/L, 10 μmol/L, and 20 μmol/L spiperone (d). Graphs displaying cell viability as the percentage of viable cells; data show the mean ± SD of at least three independent experiments performed in triplicate. ***: Student’s t-test p < 0.001; ****: Student’s t-test p < 0.0001. Effect of PLC ꞵ1 and PLC 𝜀1 silencing on CHOP nuclear localization. HCT116-silenced cells were treated for 24 h with 10 μmol/L spiperone (e). Graph showing the ratio of the number of cells presenting CHOP nuclear localization to the total number of cells (f); data are presented as the mean ± standard deviation from three independent experiments, each performed in triplicate. ****: Student’s t-test p < 0.0001.
Figure 10
Figure 10
Spiperone induces mitochondrial damage. Mitochondrial membrane potential depolarization was evaluated by JC-1 staining after 1, 3, 6 (b), and 16 h (a) treatment with 5 and 10 μmol/L spiperone, alone or in combination with 10 μmol/L BAPTA-AM and 10 μmol/L of the MCU inhibitor Ru360 in HCT116 cells (c). Pictures were acquired via fluorescence microscopy. Histogram showing quantification of the red/green fluorescence ratio as fold change relative to controls. Data are presented as the mean ± SD from three independent experiments, each performed in triplicate. *: Student’s t-test p < 0.05; **: Student’s t-test p < 0.01; ***: Student’s t-test p < 0.001; ****: Student’s t-test p < 0.0001.
Figure 11
Figure 11
Analysis of sphingolipids for HCT116 and CRC-SC#1 cell lines. Graphs displaying fold change for HCT116 cells (left panel) and CRC-SC#1 cells (right panel) relative to ceramides (Cer), hexosylceramides (HexCer), sphingomyelins (SM), sphinganine, dihydroCer, and dihydroHexCer species merging 20 and 40 h treatment. *: Student’s t-test p < 0.1; **: Student’s t-test p < 0.01; ***: Student’s t-test p < 0.001.
Figure 12
Figure 12
Lipidomic results for HCT116 and CRC-SC#1 cells. Graphs displaying the fold change for HCT116 cells (left panels) and CRC-SC#1 cells (right panels). The fatty acid derivatives are reported with the subclasses identified: acylcarnitine (CAR), N-acyl ethanolamines (NAE), and free fatty acids (FAs) (a). CAR characterization (b). Glycerophospholipids (GPLs) reported with the subclasses identified: glycerophosphoglycerol (GPG), glycerophosphoinositol (GPS), glycerophosphoinositols (GPIs), glycerophosphoethanolamine (GPE), and glycerophosphocholine (GPC) (c). For each class, the identified derivatives were reported considering both the lyso (LPS, LPI, LPG, LPE, LPC) and ether forms (PI-O, PG-O, PE-O, PE-P, PC-O) (d). *: Student’s t-test p < 0.1; **: Student’s t-test p < 0.01; ***: Student’s t-test p < 0.001.
Figure 13
Figure 13
Spiperone induces swelling of the Golgi apparatus (GA). The effect of co-treatment with spiperone and 10 μmol/L BAPTA-AM, 1 μmol/L U73122, and 10 μmol/L 4-PBA on GA morphology was evaluated via confocal microscopy in HCT116 cells and CRC-SC#1 cells. The GA was stained using anti-GOLGIN 97 primary antibody and Alexa Fluor-546 secondary antibody; nuclei were stained using DAPI (a,b). Histogram showing the ratio of the number of cells presenting GA swelling to the total number of cells in HCT116 cells (c) and CRC-SC#1 cells (d). Representative images of the effects of spiperone treatment on GA morphology in HCT116 cells silenced for PLCβ1 and PLCε1 (e). Histogram showing the ratio of the number of cells presenting GA swelling to the total number of cells (f). Data are presented as the mean ± SD from three independent experiments performed in triplicate. ****: Student’s t-test p < 0.0001.

Similar articles

Cited by

References

    1. Sung H., Ferlay J., Siegel R.L., Laversanne M., Soerjomataram I., Jemal A., Bray F. Global Cancer Statistics 2020: GLOBOCAN Estimates of Incidence and Mortality Worldwide for 36 Cancers in 185 Countries. CA Cancer J. Clin. 2021;71:209–249. doi: 10.3322/caac.21660. - DOI - PubMed
    1. Van Der Stok E.P., Spaander M.C.W., Grünhagen D.J., Verhoef C., Kuipers E.J. Surveillance after Curative Treatment for Colorectal Cancer. Nat. Rev. Clin. Oncol. 2017;14:297–315. doi: 10.1038/nrclinonc.2016.199. - DOI - PubMed
    1. Miller K.D., Nogueira L., Mariotto A.B., Rowland J.H., Yabroff K.R., Alfano C.M., Jemal A., Kramer J.L., Siegel R.L. Cancer Treatment and Survivorship Statistics, 2019. CA Cancer J. Clin. 2019;69:363–385. doi: 10.3322/caac.21565. - DOI - PubMed
    1. Ouakrim D.A., Pizot C., Boniol M., Malvezzi M., Boniol M., Negri E., Bota M., Jenkins M.A., Bleiberg H., Autier P. Trends in Colorectal Cancer Mortality in Europe: Retrospective Analysis of the WHO Mortality Database. BMJ. 2015;351:h4970. doi: 10.1136/bmj.h4970. - DOI - PMC - PubMed
    1. Brenner H., Bouvier A.M., Foschi R., Hackl M., Larsen I.K., Lemmens V., Mangone L., Francisci S. Progress in Colorectal Cancer Survival in Europe from the Late 1980s to the Early 21st Century: The EUROCARE Study. Int. J. Cancer. 2012;131:1649–1658. doi: 10.1002/ijc.26192. - DOI - PubMed