

Immunogenomic Landscape in Breast Cancer Reveals Immunotherapeutically Relevant Gene Signatures
- PMID: 35154121
- PMCID: PMC8829007
- DOI: 10.3389/fimmu.2022.805184
Immunogenomic Landscape in Breast Cancer Reveals Immunotherapeutically Relevant Gene Signatures
Erratum in
-
Corrigendum: Immunogenomic landscape in breast cancer reveals immunotherapeutically relevant gene signatures.Front Immunol. 2023 Jan 20;14:1134847. doi: 10.3389/fimmu.2023.1134847. eCollection 2023. Front Immunol. 2023. PMID: 36742333 Free PMC article.
Abstract
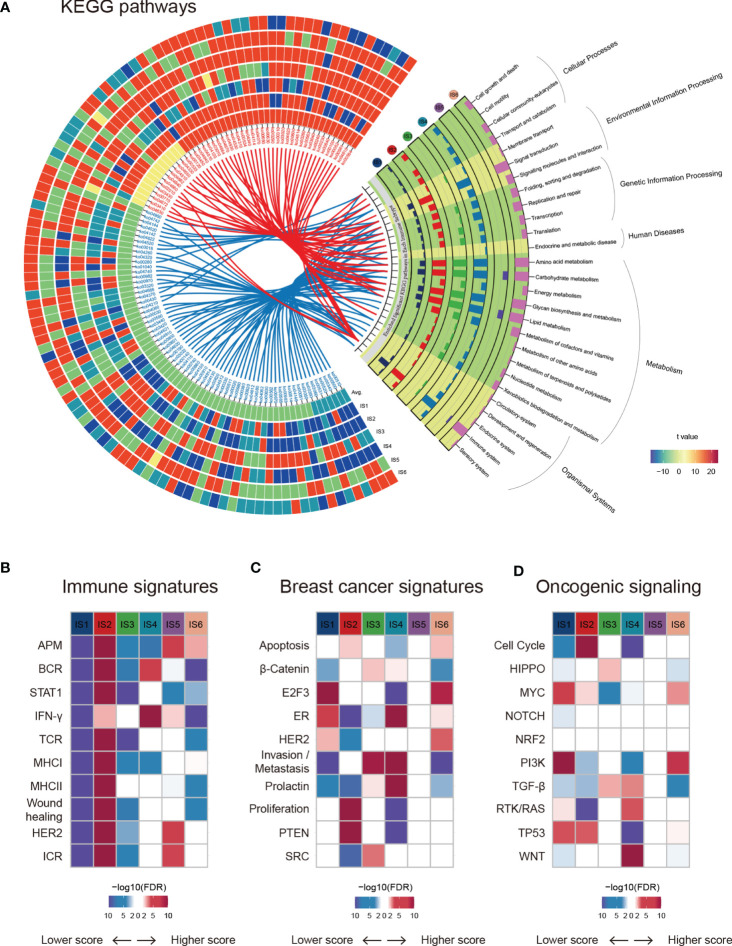
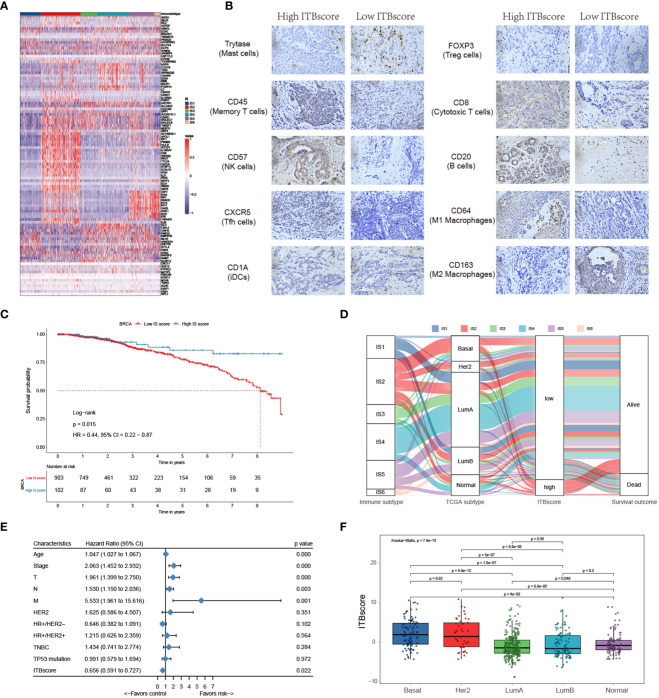
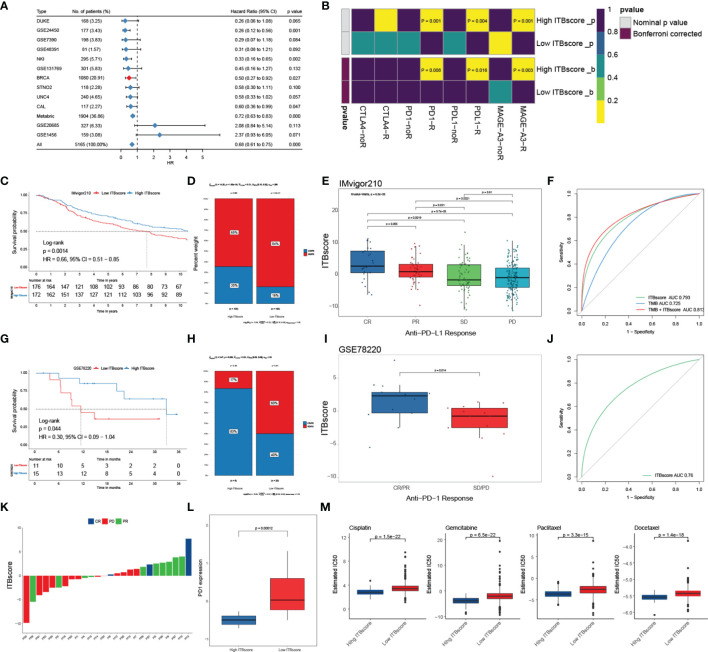
Breast cancer is characterized by some types of heterogeneity, high aggressive behaviour, and low immunotherapeutic efficiency. Detailed immune stratification is a prerequisite for interpreting resistance to treatment and escape from immune control. Hence, the immune landscape of breast cancer needs further understanding. We systematically clustered breast cancer into six immune subtypes based on the mRNA expression patterns of immune signatures and comprehensively depicted their characteristics. The immunotherapeutic benefit score (ITBscore) was validated to be a superior predictor of the response to immunotherapy in cohorts from various datasets. Six distinct immune subtypes related to divergences in biological functions, signatures of immune or stromal cells, extent of the adaptive immune response, genomic events, and clinical prognostication were identified. These six subtypes were characterized as immunologically quiet, chemokine dominant, lymphocyte depleted, wounding dominant, innate immune dominant, and IFN-γ dominant and exhibited features of the tumor microenvironment (TME). The high ITBscore subgroup, characterized by a high proportion of M1 macrophages:M2 macrophages, an activated inflammatory response, and increased mutational burden (such as mutations in TP53, CDH1 and CENPE), indicated better immunotherapeutic benefits. A low proportion of tumor-infiltrating lymphocytes (TILs) and an inadequate response to immune treatment were associated with the low ITBscore subgroup, which was also associated with poor survival. Analyses of four cohorts treated with immune checkpoint inhibitors (ICIs) suggested that patients with a high ITBscore received significant therapeutic advantages and clinical benefits. Our work may facilitate the understanding of immune phenotypes in shaping different TME landscapes and guide precision immuno-oncology and immunotherapy strategies.
Keywords: breast cancer; immune escape; immune subtype; immunotherapy; tumor microenvironment.
Copyright © 2022 Wang, Li, Li, Zhao, Li, Sun, Li, Zhao, Zhao, He, Guo, Ge, Wang, Ding, Liu, Min and Zhang.
Conflict of interest statement
The authors declare that the research was conducted in the absence of any commercial or financial relationships that could be construed as a potential conflict of interest.
Figures


Similar articles
-
Immunogenomic characterization in gastric cancer identifies microenvironmental and immunotherapeutically relevant gene signatures.Immun Inflamm Dis. 2022 Jan;10(1):43-59. doi: 10.1002/iid3.539. Epub 2021 Sep 28. Immun Inflamm Dis. 2022. PMID: 34582114 Free PMC article.
-
Investigation of Genetic Determinants of Glioma Immune Phenotype by Integrative Immunogenomic Scale Analysis.Front Immunol. 2021 Jun 16;12:557994. doi: 10.3389/fimmu.2021.557994. eCollection 2021. Front Immunol. 2021. PMID: 34220791 Free PMC article.
-
Tumor Immune Microenvironment Characterization Identifies Prognosis and Immunotherapy-Related Gene Signatures in Melanoma.Front Immunol. 2021 May 6;12:663495. doi: 10.3389/fimmu.2021.663495. eCollection 2021. Front Immunol. 2021. PMID: 34025664 Free PMC article.
-
Emerging immune gene signatures as prognostic or predictive biomarkers in breast cancer.Arch Pharm Res. 2019 Nov;42(11):947-961. doi: 10.1007/s12272-019-01189-y. Epub 2019 Nov 9. Arch Pharm Res. 2019. PMID: 31707598 Review.
-
Improving Breast Cancer Responses to Immunotherapy-a Search for the Achilles Heel of the Tumor Microenvironment.Curr Oncol Rep. 2021 Mar 23;23(5):55. doi: 10.1007/s11912-021-01040-y. Curr Oncol Rep. 2021. PMID: 33755828 Review.
Cited by
-
Histone acetylation risk model predicts prognosis and guides therapy selection in glioblastoma: implications for chemotherapy and anti-CTLA-4 immunotherapy.BMC Immunol. 2024 Jul 27;25(1):51. doi: 10.1186/s12865-024-00639-7. BMC Immunol. 2024. PMID: 39068393 Free PMC article.
-
Establishment and validation of an immune infiltration predictive model for ovarian cancer.BMC Med Genomics. 2023 Sep 28;16(1):227. doi: 10.1186/s12920-023-01657-x. BMC Med Genomics. 2023. PMID: 37759229 Free PMC article.
-
Cuproptosis in glioblastoma: unveiling a novel prognostic model and therapeutic potential.Front Oncol. 2024 Mar 28;14:1359778. doi: 10.3389/fonc.2024.1359778. eCollection 2024. Front Oncol. 2024. PMID: 38606090 Free PMC article.
-
Integrating PANoptosis insights to enhance breast cancer prognosis and therapeutic decision-making.Front Immunol. 2024 Mar 5;15:1359204. doi: 10.3389/fimmu.2024.1359204. eCollection 2024. Front Immunol. 2024. PMID: 38504988 Free PMC article.
-
Deciphering breast cancer prognosis: a novel machine learning-driven model for vascular mimicry signature prediction.Front Immunol. 2024 Aug 6;15:1414450. doi: 10.3389/fimmu.2024.1414450. eCollection 2024. Front Immunol. 2024. PMID: 39165361 Free PMC article.
References
Publication types
MeSH terms
Substances
LinkOut - more resources
Full Text Sources
Medical
Research Materials
Miscellaneous